Adaptive Pulse

Adaptive Pulse - Professional Trading Signal System

Brief Description

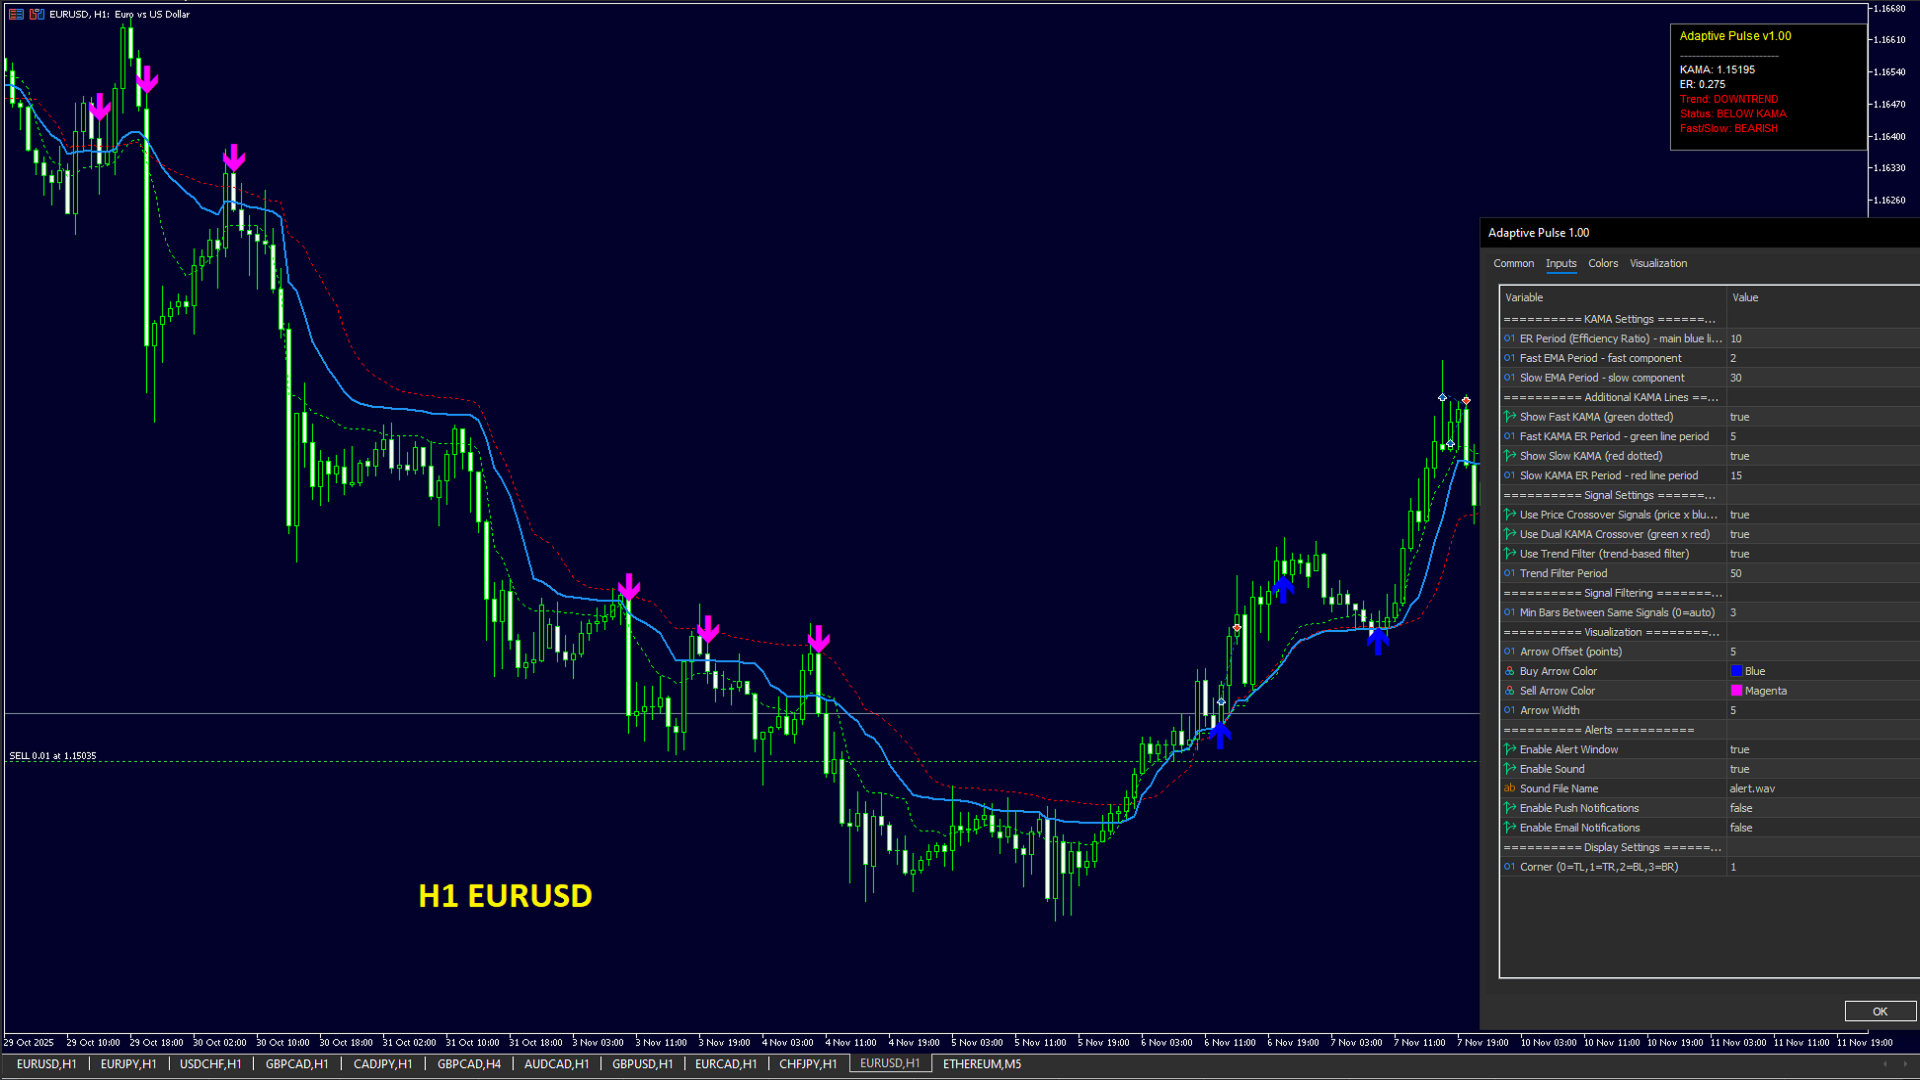
Adaptive Pulse is a professional trading signal indicator based on adaptive market analysis technology. The indicator automatically adjusts to volatility and generates precise buy and sell signals with visual arrows on the chart. It works on all timeframes and financial instruments.

Main Features

The indicator provides a three-level analysis system with three independent adaptive lines, each of which adjusts to current market conditions. The system generates two types of trading signals: when price crosses the main line and when fast and slow lines cross each other.

Key functions:

  • Triple adaptive analysis system
  • Two independent types of trading signals
  • Built-in long-term trend filter
  • Smart filtering of repeated signals with automatic mode
  • Visual buy and sell arrows
  • Information panel with current market status
  • Alert system: pop-up windows, sound, push notifications, email
  • Complete visual customization

Operating Principle

The indicator uses adaptive analysis technology that dynamically changes sensitivity depending on market conditions. During strong trend periods, the system quickly reacts to price movement, while during flat periods it slows down, filtering out market noise.

Three adaptive lines:

  • Blue main line - basic adaptive level
  • Green fast line - for short-term analysis
  • Red slow line - for long-term analysis

All signals are generated only after complete bar formation, which eliminates repainting and false signals on the current bar.

Types of Trading Signals

Price crossover signals: A buy signal is formed when price crosses the blue line from bottom to top. A sell signal is formed when price crosses the blue line from top to bottom. This type of signal can be enabled and disabled in settings.

Dual crossover signals: A buy signal is formed when the green line crosses the red line from bottom to top. A sell signal is formed when the green line crosses the red line from top to bottom. This type of signal can also be enabled and disabled independently.

Trend filter: An optional filter analyzes long-term market direction and filters out signals against the main trend. This significantly improves signal quality on higher timeframes.

Repeated signal filter: An intelligent system prevents the appearance of multiple consecutive arrows when price fluctuates in a narrow range. The filter works in automatic mode, selecting the optimal distance between signals for each timeframe, or can be configured manually.

Adjusting Signal Quantity and Quality

To get more signals: Decrease the ER Period parameter to values of 8-10. Enable the Use Price Crossover parameter. Disable the Use Trend Filter parameter. Decrease the Min Bars Between Same Signals parameter to 1-2. Use lower timeframes M1 and M5.

To get fewer signals: Increase the ER Period parameter to values of 12-14. Disable the Use Price Crossover parameter. Enable the Use Trend Filter parameter. Increase the Min Bars Between Same Signals parameter to 5-10. Use higher timeframes M15 and H1.

To get more accurate signals: Enable the Use Dual KAMA Crossover parameter. Enable the Use Trend Filter parameter. Increase the Slow KAMA Period to 25-30. Set Min Bars Between Same Signals to a value of 3-5. Use timeframes M15 or H1. This will produce fewer signals, but higher quality entries.

To eliminate repeated signals in sideways movement: Increase the Min Bars Between Same Signals parameter to values of 5-10. This will prevent the appearance of multiple consecutive arrows when price fluctuates around the adaptive line. A value of 0 enables automatic mode, which automatically selects the optimal distance depending on the timeframe.

Main Indicator Parameters

KAMA Settings section:

  • ER Period - calculation period for adaptive system efficiency (recommended 8-14)
  • Fast Period - fast adaptation component (standard value 2)
  • Slow Period - slow adaptation component (standard value 30)

Additional KAMA Lines section:

  • Show Fast KAMA - display green fast line
  • Fast KAMA Period - calculation period for fast line (recommended 5-10)
  • Show Slow KAMA - display red slow line
  • Slow KAMA Period - calculation period for slow line (recommended 15-30)

Signal Settings section:

  • Use Price Crossover - enable signals from price crossing the main line
  • Use Dual KAMA - enable signals from fast and slow line crossover
  • Use Trend Filter - enable filtering by long-term trend
  • Trend Period - calculation period for trend filter (recommended 50-100)

Signal Filtering section:

  • Min Bars Between Same Signals - minimum number of bars between identical signals (recommended 3-5). The parameter helps avoid multiple entries when price fluctuates in a narrow range. A value of 0 activates automatic mode: for M1-M5, 3 bars are used; for M15, 2 bars are used; for H1 and higher, 1 bar is used.

Visualization section:

  • Arrow Offset - arrow offset from High/Low in points (default 20)
  • Buy Arrow Color - buy arrow color
  • Sell Arrow Color - sell arrow color
  • Arrow Width - arrow line thickness from 1 to 5

Alerts section:

  • Enable Alert - enable pop-up alert windows
  • Enable Sound - enable sound alerts
  • Sound File - sound file name from Sounds folder
  • Enable Push - enable push notifications to mobile device
  • Enable Email - enable alert delivery to email

Display Settings section:

  • Corner Position - information panel position: 0 - top left corner, 1 - top right, 2 - bottom left, 3 - bottom right

Information Panel

The indicator displays a compact information panel in the chart corner with current data:

  • Current value of the main line
  • Current value of efficiency ratio
  • Trend status: uptrend, downtrend, or neutral
  • Price position relative to the main line
  • Ratio of fast and slow lines

The panel updates every second and helps quickly assess the current market situation.

Usage Features

The indicator works on any financial instruments: currency pairs, metals, indices, cryptocurrencies, stocks. It is recommended to use on instruments with sufficient liquidity and small spreads.

For scalping and intraday trading, it is better to use lower timeframes M1-M5 with Price Crossover mode enabled. For position trading, M15-H1 timeframes with Trend Filter enabled are recommended.

The indicator does not repaint signals after they appear, as calculation is performed only on fully formed bars. Arrows remain on the chart and do not change their position.

All alerts trigger only once when a new signal appears on a closed bar. There are no repeated alerts on the same bar.

The repeated signal filtering system automatically adapts to the timeframe or can be configured manually for maximum control over arrow appearance frequency.

Indicator Advantages

Adaptive technology allows the indicator to work effectively in various market conditions without the need for constant manual adjustment. The system automatically adjusts to current volatility.

The ability to select signal types and combine them provides flexibility in building a trading strategy. You can use only one type of signal or combine them for additional confirmation.

Intelligent filtering of repeated signals protects against multiple false entries during periods of sideways price movement. Automatic filtering mode selects optimal values for each timeframe.

Visual design is maximally clear and does not overload the chart with unnecessary information. All important data is displayed in a compact panel.

The alert system allows you to not miss important signals even when working with multiple charts simultaneously.

The indicator is fully ready to work immediately after installation with optimal default settings. If necessary, all parameters are easily adapted to individual trading style.


Recommended products
RSIScalperPro
PATRICK WENNING
Introducing RSIScalperPro - the revolutionary RSI-based indicator for Metatrader 5, specifically designed for scalping in the one-minute chart. With RSIScalperPro, you'll have a powerful toolkit for precise entry and exit signals to take your trading to the next level. RSIScalperPro utilizes two different RSI indicators that provide clear signals for overbought and oversold areas. You can customize the time periods and limit values of the two RSIs according to your preferences to achieve the be
SMC Structure Markup
Seyed Mohammad Hosseini Hejazi
4.75 (12)
Overview The Smart Money Structure Markup Indicator for MetaTrader 5 is a powerful tool designed to help traders identify key market structures based on popular Smart Money Concepts (SMC) strategies. This indicator detects micro-market structures, providing insights into price movements and potential trend changes. It highlights important elements such as valid Break of Structure (BOS), Change of Character (CHoCH), and Inducement (IDM), helping traders to make informed decisions. Key Features Ma
FREE
Highly configurable Accumulation and Distribution (AD) indicator. Features: Highly customizable alert functions (at levels, crosses, direction changes via email, push, sound, popup) Multi timeframe ability Color customization (at levels, crosses, direction changes) Linear interpolation and histogram mode options Works on strategy tester in multi timeframe mode (at weekend without ticks also) Adjustable Levels Parameters: Ad Timeframe:  You can set the lower/higher timeframes for Ad. Ad Bar Shif
FREE
Dynamic ATR Percentile
Daniel Naranjo Morales
Dynamic ATR Percentile Overview The Dynamic ATR Percentile is a volatility analysis tool designed to help traders objectively gauge current market conditions. Volatility is not static; what is considered a "high" ATR value for one instrument or timeframe can be "low" for another. This indicator solves that problem by calculating dynamic volatility zones based on historical data, providing a clear and adaptive visual guide. Instead of relying on fixed ATR values, this indicator analyzes the recen
Liquidity Pressure Index
Murtadha Majid Jeyad Al-Khuzaie
Liquidity Pressure Index (LPI) is an advanced technical indicator designed to uncover the hidden battle between buyers and sellers in the market. Unlike conventional oscillators that only rely on price movements, LPI integrates market depth (order book data), ATR-based volatility compression, and adaptive smoothing to give traders a deeper view of true liquidity dynamics. By combining price action with volume absorption and order flow pressure, the LPI helps traders anticipate shifts in market
FREE
VWAP Cloud
Flavio Javier Jarabeck
4.1 (10)
Do you love VWAP? So you will love the VWAP Cloud . What is it? Is your very well known VWAP indicator plus 3-levels of Standard Deviation plotted on your chart and totally configurable by you. This way you can have real Price Support and Resistance levels. To read more about this just search the web for "VWAP Bands" "VWAP and Standard Deviation". SETTINGS VWAP Timeframe: Hourly, Daily, Weekly or Monthly. VWAP calculation Type. The classical calculation is Typical: (H+L+C)/3 Averaging Period to
FREE
I recommend you to read the  product's blog  (manual) from start to end so that it is clear from the beginning what the indicator offers. This multi time frame and multi symbol supply and demand zone dashboard indicator sends alerts when the price has reached a supply/demand zone. It is also possible to use it to be alerted about regular double tops/bottoms instead of zones. It can be used with all time frames from M1 to MN. Maximum 9 time frames can be shown in the dashboard at the same time. 
VWAP Indicator MT5
Kyra Nickaline Watson-gordon
Description : VWAP (Volume-Weighted Average Price) is the ratio of the value traded to total volume traded over a particular time horizon. It is a measure of the average price at which pair is traded over the trading horizon. Read More. All Symbols and All Timeframes are supported. Indicator Inputs :     VWAP Mode : Mode of VWAP Calculation. Options can be selected : Single,Session,Daily,Weekly,Monthly     Volumes : Real Volumes,Tick Volumes     Price Type : Used price for calculating. O
I recommend you to read the   product's blog  (manual) from start to end so that it is clear from the beginning what the indicactor offers. This multi time frame and multi symbol indicator identifies double or triple top/bottom formations or a following neckline breakout (confirmed top/bottom). It offers RSI, pin bar, engulfing, tweezer, morning/evening star filters as well divergence filter options which makes it possible to filter out only the strongest setups. The indicator can also be used
Critical Zones MT5
Rodrigo Arana Garcia
4.93 (14)
Critical Zones   has been created especially for manual traders looking for more accurate market entries. This indicator uses advanced algorithms to detect areas of interest by calculating the most relevant support and resistance on the chart as well as their breakouts and retests. This indicator can be configured to send alerts and notifications when potentially lucrative buy/sell opportunities are detected, allowing traders to stay on top of trading opportunities even when they are not in fro
FREE
Market tops are characterized by Volume Climax Up bars, High Volume Churn and Low Volume Up bars (also called Testing). Market bottoms are characterized by Volume Climax Down bars, High Volume Churn and Low Volume Down bars (Testing). Pullbacks, in either up or down trends, are similar to market topping or bottoming patterns, but shorter in duration and with simpler volume patterns.
FREE
Algo octa
Firas Al-qasimi
Algo Octa - Indicateur d'Analyse Technique Avancé Indicateur professionnel combinant ZigZag, SAR parabolique, canaux de tendance et niveaux de Fibonacci pour une analyse technique complète.  if you don't understand how to use Technical Support via product feedback or MQL5 messaging system.  Fonctionnalités Principales Analyse Multi-Composants  ZigZag coloré avec détection automatique des extremums  Intégration du SAR parabolique pour la confirmation de tendance  Création automatique de canau
SMC Market Blueprint
Alex Amuyunzu Raymond
SMC Market Blueprint Institutional Market Structure Analyzer Based on Smart Money and ICT Concepts Overview SMC Market Blueprint is a comprehensive institutional-grade indicator designed to decode the true structure of the market using Smart Money Concepts (SMC) and ICT (Inner Circle Trader) methodology. It maps the internal market framework — identifying structure shifts, liquidity zones, and order flow transitions across multiple timeframes — giving traders a clear blueprint of how institution
VWAP Indicator
LUC JACOBUS A VERHEECKE
4.2 (25)
Volume Weighted Average Price (VWAP) The volume weighted average price (VWAP) is a  trading   benchmark  used by traders that gives the average price a security has traded at throughout the day, based on both volume and price. It is important because it provides traders with insight into both the trend and value of a security. This indicator VWAP V2 is free and is the manual version of the extended Easy VWAP indicator (30 Euro), where the date and time properties are automatically entered. With
FREE
Cobra Mis
Vitalii Zakharuk
A fundamental technical indicator that allows you to assess the current market situation in order to enter the market of the selected currency pair in a trend and with minimal risk. This indicator was created on the basis of the original extreme search indicators, the indicator is well suited for determining a reversal or a big sharp jerk in one direction, thanks to it you will know when this will happen, he will notify you with the appearance of a blue dot for buying red for sale. It basical
Stackable VWAP
Flavio Javier Jarabeck
3.5 (4)
Volume Weighted Average Price (VWAP) is a trading benchmark commonly used by Big Players that gives the average price a Symbol has traded throughout the day. It is based on both Volume and price. Additionally we put in this indicator the MVWAP (Moving Volume Weighted Average Price). For those who do not know the usage and the importance od this indicator I recommend a great article about this subject at Investopedia ( https://www.investopedia.com/articles/trading/11/trading-with-vwap-mvwap.asp
FREE
EA Features Highlights Smart Order Management: Supports global order switch, dynamic max position calculation, time interval control, etc. Flexible Take Profit & Stop Loss: Supports dynamic stop loss, floating loss protection, trailing stop and other profit protection mechanisms. SAR Signal Filtering: Uses Parabolic SAR trend signals for more accurate entry points. Advanced Risk Control: Built-in account balance, margin ratio and other risk management mechanisms to ensure trading safety. Multi-
Relative Strength Levy Classic
Bruno Goncalves Mascarenhas
Classic RSL This is the classic indicator "Relative Strength Levy" (RSL), according to Dr. Robert Levy's study, called "The Relative Strength Concept of Common Stock Pricing", which was released as a hardcover book in late 60's of the last century. Key concept Use this indicator on various instruments to compare their relative strength: The resulting analysis values ​​will fluctuate around 1 The strongest instruments will have the highest RSL values ​​(above 1) and the weakest instruments wi
Daily VWAP
Riccardo Moreo
4.75 (4)
This is the Volume Avarage Weighted Price (VWAP) it's a indicator that shows where is the avarage of the current volumes and the levels at which the price is considered premium, above the second upper band, or discount, under the second lower band, it's also very usefull to use the VWAP level as a target for operations since it's a very liquid level so the price it's attracted to it. feel free to leave a feedback either positive or negative based on your expereince with this indicator, enjoy the
FREE
Automatic Vwap Midas
Ricardo Almeida Branco
5 (1)
The 3 Automatic Vwap (Midas) Indicator can be used for Price and Volume studyers to map the movement of market drivers. It automatically plots 3 Vwaps, two of which are dynamic and will be updated throughout the day if new highs or new lows emerge. The third Vwap is daily and can help if the trend is up or down. Also, an auxiliary indicator that plots (also dynamic) points of interest with OHLC prices (Open, High and Low of the current day and Close of the previous day) was inserted. Success and
Shaka Laka Gold EA
Sandeep Kumar Tiwary
Specialized for GOLD Trading with Advanced VWAP Strategy Transform your Gold trading with this sophisticated dual VWAP system specifically optimized for XAUUSD markets. Key Features Dual VWAP Technology Fast VWAP (100 bars) for short-term momentum Slow VWAP (500 bars) for trend confirmation Volume-weighted precision pricing for optimal entry/exit points Intelligent Position Management Smart scaling system that adds positions on favorable retracements Automatic position reversals w
Quant Kelly Trader
Christian Alexander Foehl
The Quant Kelly Trader EA combines precise market structure signals with mathematically founded Kelly-based risk management. Designed for trading the S&P500 (US500) on the M15 timeframe, it merges fast capital growth with controlled risk – inspired by the strategies of the world’s top quants and investors. With a clear focus on accumulation phases and an adapted Kelly formula, the EA offers a professional tool for traders aiming to exploit growth potential while keeping risks under control. Str
Steady Bands3
Roberto Tavares
Equidistant bands indicator with calculated moving average, allows you to configure the band size and can be used freely as an entry / exit indicator. Buffer 0 = price, buffer 1 = upper band, buffer 2 = lower band. you can also configure the periods of moving averages used in the calculations and also the shift to previous bars in addition to the price that can CLOSE (default) or OPEN. Excellent for fast daily moving pairs and frequent returns.
FREE
Vwap Bands Auto
Ricardo Almeida Branco
The Vwap Bands Auto indicator seeks to automatically map the maximum market frequency ( automatic update of the outermost band ) and has two intermediate bands that also adjust to daily volatility. Another tool from White Trader that combines price and volume, in addition to mapping the daily amplitude. The external band is updated automatically when the daily maximum or minimum breaks the current frequency, and can be an input signal, seeking a return to the daily vwap. Thus, in addition t
Quantum VWAP Pro for MT5
QUANTUM TRADING SOFTWARE LIMITED
The VWAP indicator is another of our suite of volume indicators and one which was first referred to in 1988 when it appeared in an article entitled “The Total Cost Of Transactions On The NYSE” in the March edition of the Journal Of Finance from that year, which went on to explain its importance, particularly from an institutional perspective, which underpins its significance in appreciating the power and importance of this indicator. In many ways, it is akin to the volume price analysis methodol
Gold Grok
Ihar Tsitou
Символ XAUUSD Timeframe (период) Day Тип Artificial intelligence Минимальный депозит 1500 USD (or the equivalent of another currency) Совместимость с ЛЮБЫМ брокером ДА Запуск без предварительных настроек ДА Данный эксперт представляет собой ансамблевую систему моделей, обученный на пространстве синтезированных фракталов высокой размерности Второго уровня. Живой Сигнал: https://www.mql5.com/ru/signals/2343812?source=Site+Profile+Seller Ключевые особенности: Безопасность депозита Не использу
I  recommend you to read the   product's blog  (manual) from start to end so that it is clear from the beginning what the indicator offers. This multi time frame and multi symbol indicator scans for Pin bars, Morning/evening stars, Engulfings, Tweezers, Three Line Strikes, Inside bars and Pennants and Triangles.  The indicator can also be used in single chart mode. Please read more about this option in the product's   blog . Combined with your own rules and techniques, this indicator will allow
ShortBS是一个很好的短线交易指示器,能很好与 BestPointOfInitiation ( https://www.mql5.com/zh/market/product/96671 )配合,能让你找到最合适的buy和sell位置,指标不含有未来函数,不会重新绘制。是一个针对(如果你感觉到这个指标能够帮助你进行更准确的交易,请帮忙给个好评,希望我的作品能够帮助更多有需要的人) ===================参数列表===================== maPeriod: 25 slowPeriod:20 fastPeriod:10 stepPeriod:5 =================参考使用方法=================== 此指标可以适用于任何交易品种,能够用在任何周期。
A useful dashboard that shows the RSI values for multiple symbols and Time-frames. It can be easily hidden/displayed with a simple click on the X top left of the dashboard. You can input upper and lower RSI values and the colours can be set to show when above/below these values. The default values are 70 and 30. You can choose whether the dashboard is displayed on the right or left of the chart. If you want to have 2 dashboards on the same chart you must input a different name for each. The sca
FREE
Hydra Trend Rider is a non-repainting, multi-timeframe trend indicator that delivers precise buy/sell signals and real-time alerts for high-probability trade setups. With its color-coded trend line, customizable dashboard, and mobile notifications, it's perfect for traders seeking clarity, confidence, and consistency in trend trading. Download the Metatrader 4 Version Read the Indicator User Manual here. HURRY!  Price  increasing soon! Read the product description carefully before purchasing the
Buyers of this product also purchase
New Update of   Smart Trend Trading System MT5 For  2026 Market: If You Buy this Indicator you will Get my Professional Trade Manager + EA  for FREE . First of all Its worth emphasizing here that this Trading System is Non-Repainting   , Non Redrawing and Non Lagging Indicator Which makes it ideal from both manual and robot trading .  [Online course] , [manual] and [download presets] . The Smart Trend Trading System MT5 is a comprehensive trading solution tailored for new and experienced traders
Divergence Bomber
Ihor Otkydach
4.99 (77)
Each buyer of this indicator also receives the following for free: The custom utility "Bomber Utility", which automatically manages every trade, sets Stop Loss and Take Profit levels, and closes trades according to the rules of this strategy Set files for configuring the indicator for various assets Set files for configuring Bomber Utility in the following modes: "Minimum Risk", "Balanced Risk", and "Wait-and-See Strategy" A step-by-step video manual to help you quickly install, configure, and s
Gold Sniper Scalper Pro
Ich Khiem Nguyen
5 (4)
Gold Sniper Scalper Pro - Gold (XAU/USD) Trading System on MetaTrader 5 For the serious trader: Approach Gold trading with a structured, data-driven methodology that combines multiple market analysis factors. This tool is built to support your Gold trading analysis. Limited Price Opportunity This is a chance to own Gold Sniper Scalper Pro before the price increases. The product price will increase by $50 after every 10 subsequent purchases. Final Price: $498 Features That Define Your Analytical
Entry In The Zone and SMC Multi Timeframe is a real-time market analysis tool developed based on Smart Money Concepts (SMC). It is designed to help traders analyze market structure systematically and gain a clearer view of overall market direction. The system analyzes Reversal Points, Key Zones, and Market Structure across multiple timeframes, while displaying Point Of Interest (POI) , No Repaint Signals, and Auto Fibonacci Levels to help detect pullbacks and reversal points with precision. Real
Atomic Analyst MT5
Issam Kassas
4.31 (26)
New Update of   Atomic Analyst MT5 For  2026 Market: If You Buy this Indicator you will Get my Professional   Trade Manager + EA  for   FREE . First of all Its worth emphasizing here that this Trading Indicator is   Non-Repainting   , Non Redrawing and Non Lagging Indicator   Indicator, Which makes it ideal from both manual and robot trading.  User manual: settings, inputs and strategy . The Atomic Analyst  is a PA Price Action Indicator that uses Strength and Momentum of the price to find a bet
FX Power MT5 NG
Daniel Stein
5 (28)
FX Power: Analyze Currency Strength for Smarter Trading Decisions Overview FX Power is your go-to tool for understanding the real strength of currencies and Gold in any market condition. By identifying strong currencies to buy and weak ones to sell, FX Power simplifies trading decisions and uncovers high-probability opportunities. Whether you’re looking to follow trends or anticipate reversals using extreme delta values, this tool adapts seamlessly to your trading style. Don’t just trade—trade
Quantum TrendPulse
Bogdan Ion Puscasu
5 (19)
Introducing Quantum TrendPulse , the ultimate trading tool that combines the power of SuperTrend , RSI , and Stochastic into one comprehensive indicator to maximize your trading potential. Designed for traders who seek precision and efficiency, this indicator helps you identify market trends, momentum shifts, and optimal entry and exit points with confidence. Key Features: SuperTrend Integration: Easily follow the prevailing market trend and ride the wave of profitability. RSI Precision: Detect
Grabber System MT5
Ihor Otkydach
4.79 (19)
Let me introduce you to an excellent technical indicator – Grabber, which works as a ready-to-use "All-Inclusive" trading strategy. Within a single code, it integrates powerful tools for technical market analysis, trading signals (arrows), alert functions, and push notifications. Every buyer of this indicator also receives the following for free: Grabber Utility for automatic management of open orders Step-by-step video guide: how to install, configure, and trade with the indicator Custom set fi
First of all Its worth emphasizing here that this Trading Tool is Non Repainting , Non Redrawing and Non Lagging Indicator , Which makes it ideal for professional trading . Online course, user manual and demo. The Smart Price Action Concepts Indicator is a very powerful tool for both new and experienced traders . It packs more than 20 useful indicators into one , combining advanced trading ideas like Inner Circle Trader Analysis and Smart Money Concepts Trading Strategies . This indicator focus
Top indicator for MT5   providing accurate signals to enter a trade without repainting! It can be applied to any financial assets:   forex, cryptocurrencies, metals, stocks, indices .  Watch  the video  (6:22) with an example of processing only one signal that paid off the indicator! MT4 version is here It will provide pretty accurate trading signals and tell you when it's best to open a trade and close it. Most traders improve their trading results during the first trading week with the help of
SynaptixQuant Dominance Matrix
Devie Arevalo Montemayor
5 (1)
SynaptixQuant Dominance Matrix: Institutional-Grade Market State Extraction Engineered for traders who require a data-driven view of market behaviour beyond surface-level indicators. The Synaptix Quant (SQ) Dominance Matrix is not a conventional currency strength display. Behind its intentionally streamlined interface runs a sophisticated analytical architecture designed to quantify market conditions with precision. Every output is generated through layered signal processing built to identify d
Trend indicator AI mt5
Ramil Minniakhmetov
5 (12)
Trend Ai indicator  mt5 is great tool that will enhance a trader’s market analysis by combining trend identification with actionable entry points and reversal alerts.  This indicator empowers users to navigate the complexities of the forex market with confidence and precision Beyond the primary signals, Trend Ai indicator identifies secondary entry points that arise during pullbacks or retracements, enabling traders to capitalize on price corrections within the established trend. Important Advan
FX Volume MT5
Daniel Stein
4.79 (24)
FX Volume: Experience Genuine Market Sentiment from a Broker’s Perspective Quick Overview Looking to elevate your trading approach? FX Volume provides real-time insights into how retail traders and brokers are positioned—long before delayed reports like the COT. Whether you’re aiming for consistent gains or simply want a deeper edge in the markets, FX Volume helps you spot major imbalances, confirm breakouts, and refine your risk management. Get started now and see how genuine volume data can
TPSproTREND PrO MT5
Roman Podpora
4.72 (18)
Buy TREND PRO now and get another advanced trend indicator for free To receive, write in private messages. ИНСТРУКЦИЯ RUS    -  INSTRUCTIONS  ENG    -  VERSION MT4   Main functions: Accurate entry signals WITHOUT REPAINTING! Once a signal appears, it remains valid! This is a significant distinction from repainting indicators that might provide a signal and then alter it, potentially leading to deposit losses. Now, you can enter the market with higher probability and precision. There's also a f
How many times have you bought a trading indicator with great back-tests, live account performance proof with fantastic numbers and stats all over the place but after using it, you end up blowing your account? You shouldn't trust a signal by itself, you need to know why it appeared in the first place, and that's what RelicusRoad Pro does best! User Manual + Strategies + Training Videos + Private Group with VIP Access + Mobile Version Available A New Way To Look At The Market RelicusRoad is the
Blahtech Supply Demand MT5
Blahtech Limited
4.54 (13)
Was: $299  Now: $99  Supply Demand uses previous price action to identify potential imbalances between buyers and sellers. The key is to identify the better odds zones, not just the untouched ones. Blahtech Supply Demand indicator delivers functionality previously unavailable on any trading platform. This 4-in-1 indicator not only highlights the higher probability zones using a multi-criteria strength engine, but also combines it with multi-timeframe trend analysis, previously confirmed swings a
TrendLine PRO MT5
Evgenii Aksenov
4.67 (33)
The Trend Line PRO indicator is an independent trading strategy. It shows the trend change, the entry point to the transaction, as well as automatically calculates three levels of Take Profit and Stop Loss protection. Trend Line PRO is perfect for all Meta Trader symbols: currencies, metals, cryptocurrencies, stocks and indices. The indicator is used in trading on real accounts, which confirms the reliability of the strategy. Robots using   Trend Line PRO   and real Signals can be found here: 
Was: $249  Now: $99   Market Profile defines a number of day types that can help the trader to determine market behaviour. A key feature is the Value Area, representing the range of price action where 70% of trading took place. Understanding the Value Area can give traders valuable insight into market direction and establish the higher odds trade. It is an excellent addition to any system you may be using. Inspired by Jim Dalton’s book “Mind Over Markets”, this indicator is designed to suit the
Quantum Trend Sniper
Bogdan Ion Puscasu
4.74 (53)
Introducing   Quantum Trend Sniper Indicator , the groundbreaking MQL5 Indicator that's transforming the way you identify and trade trend reversals! Developed by a team of experienced traders with trading experience of over 13 years,   Quantum Trend Sniper Indicator   is designed to propel your trading journey to new heights with its innovative way of identifying trend reversals with extremely high accuracy. ***Buy Quantum Trend Sniper Indicator and you could get Quantum Breakout Indicator for
Trend Forecaster
Alexey Minkov
5 (7)
The Trend Forecaster indicator utilizes a unique proprietary algorithm to determine entry points for a breakout trading strategy. The indicator identifies price clusters, analyzes price movement near levels, and provides a signal when the price breaks through a level. The Trend Forecaster indicator is suitable for all financial assets, including currencies (Forex), metals, stocks, indices, and cryptocurrencies. You can also adjust the indicator to work on any time frames, although it is recommen
Shock Pullback
Suleiman Alhawamdah
5 (1)
Shock Pullback v 3.5 + AI/ML forecasts: - Add Integrated Artificial and deep learning have been integrated within the MQL5 environment. - A qualitative addition for integrated future forecasts using deep learning and artificial intelligence (AI/ML) within MQL5, based on the methodology and operation of the core indicator built on the Shock Pullback and its inherent integrated functions. - Suitable for scalping trading  How to Use the Indicator  Shock Pullback: There are 3 images in the com
Market Structure Patterns
Samuel Manoel De Souza
4.47 (19)
Available for   MT4   and   MT5 . Join the Market Structure Patterns channel to download materials available for study and/or additional informations. Related posts: Market Structure Patterns - Introdução Market Structure Patterns   is an indicator based on   smart money concepts   that displays   SMC/ICT   elements that can take your trading decisions to the next level. Take advantage of the   alerts ,   push notifications   and   email messages   to keep informed from when an element is form
Best Solution for any Newbie or Expert Trader! This Indicator is a unique, high quality and affordable trading tool because we have incorporated a number of proprietary features and a new formula. With only ONE chart you can read Currency Strength for 28 Forex pairs! Imagine how your trading will improve because you are able to pinpoint the exact trigger point of a new trend or scalping opportunity? User manual:   click here That's the first one, the original! Don't buy a worthless wannabe clone
Super Signals Channel Indicator Its channel is a non-repaint indicator that reacts more with recent price movements. For this reason, the Super Signals Channel Indicator is a better match for short-term or day trading strategy. The Super Signals Channel only plots swing trading opportunities. So most of its trade signals appear during consolidation or sidelined periods of the market. Super Signals Channel Indicator for MT5 Explanation The green band below the price shows the dynamic support lev
Volume Profile Pro Signals  Precision volume analysis meets automatic signal generation. What It Does Volume Profile Pro Signals builds a live, data-driven picture of where trading volume truly occurs — exposing market zones where price is accepted or rejected. It highlights POC, VAH, VAL, and identifies HVN/LVN areas with exact accuracy. From that foundation, it generates real-time breakout signals (VAH/VAL) and plots smart SL/TP levels from ATR volatility data. Every component — from profile
AriX
Temirlan Kdyrkhan
1 (4)
AriX Indicator for MT5 A powerful trend-following and signal-evaluation tool AriX is a custom MT5 indicator that combines Moving Averages and ATR-based risk/reward logic to generate clear buy/sell signals. It visualizes dynamic SL/TP levels, evaluates past trade outcomes, and displays win/loss statistics in a clean on-chart panel. Key features include: Buy/Sell signals based on MA crossovers ATR-based SL/TP1/TP2/TP3 levels with visual lines and labels Signal outcome tracking with real-time stat
MACD Intraday Trend PRO is an Indicator developed through an adaptation made of the original MACD created by Gerald Appel in the 1960s. Through years of trading it was observed that by changing the parameters of the MACD with Fibonacci proportions we achieve a better presentation of the continuity of the trend movements, making that it is possible to more efficiently detect the beginning and end of a price trend. Due to its efficiency in detecting price trends, it is also possible to identify ve
Matrix Arrow Indicator MT5
Juvenille Emperor Limited
5 (17)
Matrix Arrow Indicator MT5  is a unique 10 in 1 trend following   100% non-repainting  multi-timeframe indicator that can be used on all symbols/instruments:   forex,   commodities,   cryptocurrencies,   indices,   stocks .  Matrix Arrow Indicator MT5  will determine the current trend at its early stages, gathering information and data from up to 10 standard indicators, which are: Average Directional Movement Index (ADX) Commodity Channel Index (CCI) Classic Heiken Ashi candles Moving Average
TPSpro RFI Levels MT5
Roman Podpora
4.5 (18)
INSTRUCTIONS RUS   /   INSTRUCTIONS   ENG    -     Version MT4 Main functions: Displays active zones of sellers and buyers! The indicator displays all the correct first impulse levels/zones for purchases and sales. When these levels/zones are activated, where the search for entry points begins, the levels change color and are filled with certain colors. Arrows also appear for a more intuitive perception of the situation. LOGIC AI - Display of zones (circles) for searching entry points when acti
Step into the world of Forex trading with confidence, clarity, and precision using Gold Indicator a next-generation tool engineered to take your trading performance to the next level. Whether you’re a seasoned professional or just beginning your journey in the currency markets, Gold Indicator equips you with powerful insights and help you trade smarter, not harder. Built on the proven synergy of three advanced indicators, Gold Indicator focuses exclusively on medium and long-term trends elimina
More from author
ADX MultiTF Dashboard
Anastasia Danilova
5 (3)
ADX MultiTF Dashboard Overview ADX MultiTF Dashboard is a multi-timeframe indicator that displays key information about trend strength and direction simultaneously across three selected timeframes. The indicator presents data in a compact dashboard format, showing ADX values, directional movement indicators, and RSI readings for comprehensive market analysis. The dashboard provides critical information for trading decisions including trend strength measured by ADX, trend direction determined by
FREE
Smart Grid Navigator
Anastasia Danilova
Adaptive Grid Trading System Smart Grid Navigator is a professional trading expert advisor that uses a multi-level grid strategy with an intelligent entry filtering system. The program automatically manages positions based on technical indicator analysis and market conditions. The advisor comes with optimized settings and is ready to use immediately after installation. You can launch it on a chart and start testing. All parameters have safe default values and can be adapted to your trading style
Shadow Pulse Brief Description Shadow Pulse is a professional indicator for identifying reversal points based on the mean reversion method. It generates highly accurate buy and sell signals using an intelligent multi-level filtering system. Trading Strategy The indicator is designed to work on any timeframes from M1 to H4 and shows exceptional results when scalping gold (XAUUSD). It can bde effectively applie both for aggressive trading on lower periods and for medium-term positions on higher ti
Filter:
No reviews
Reply to review