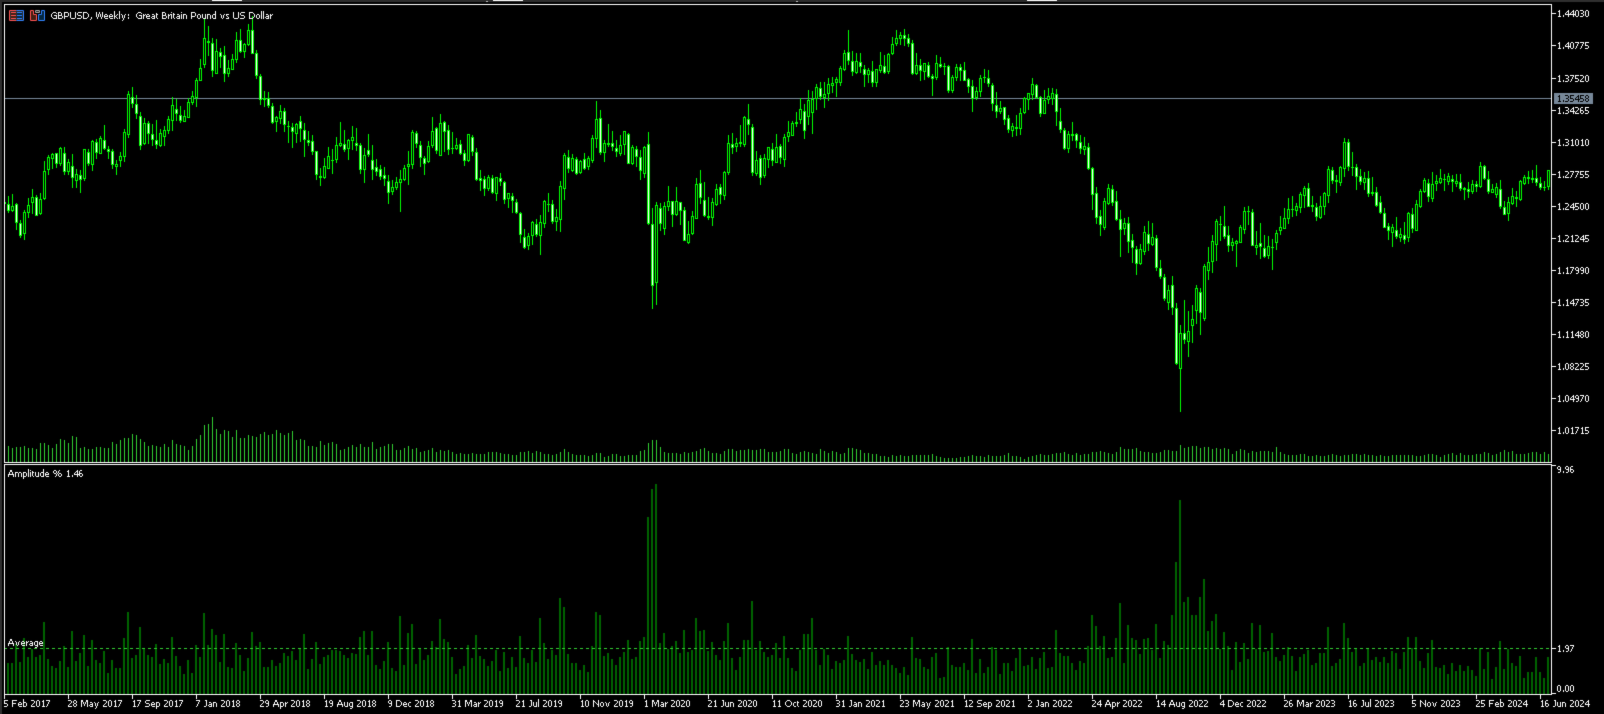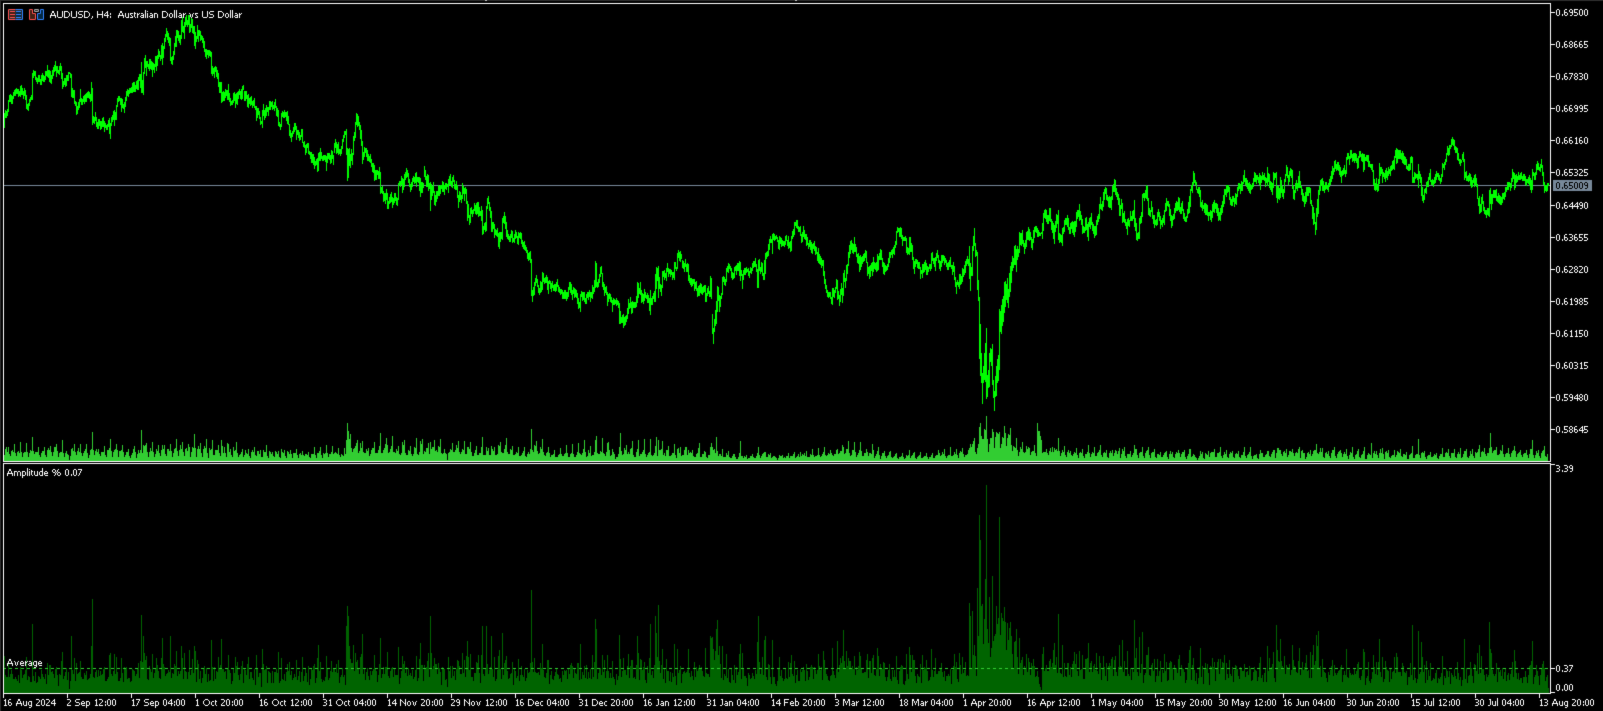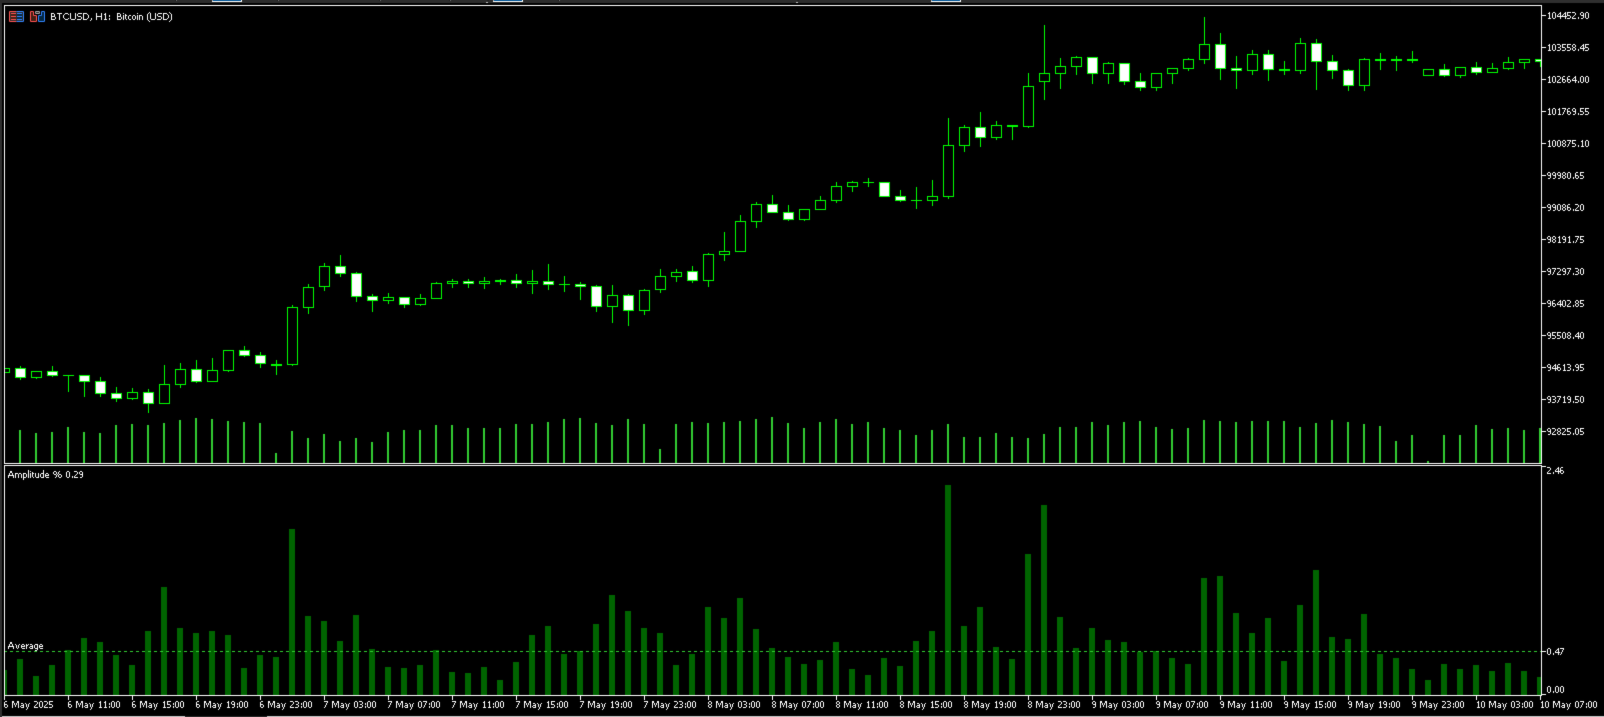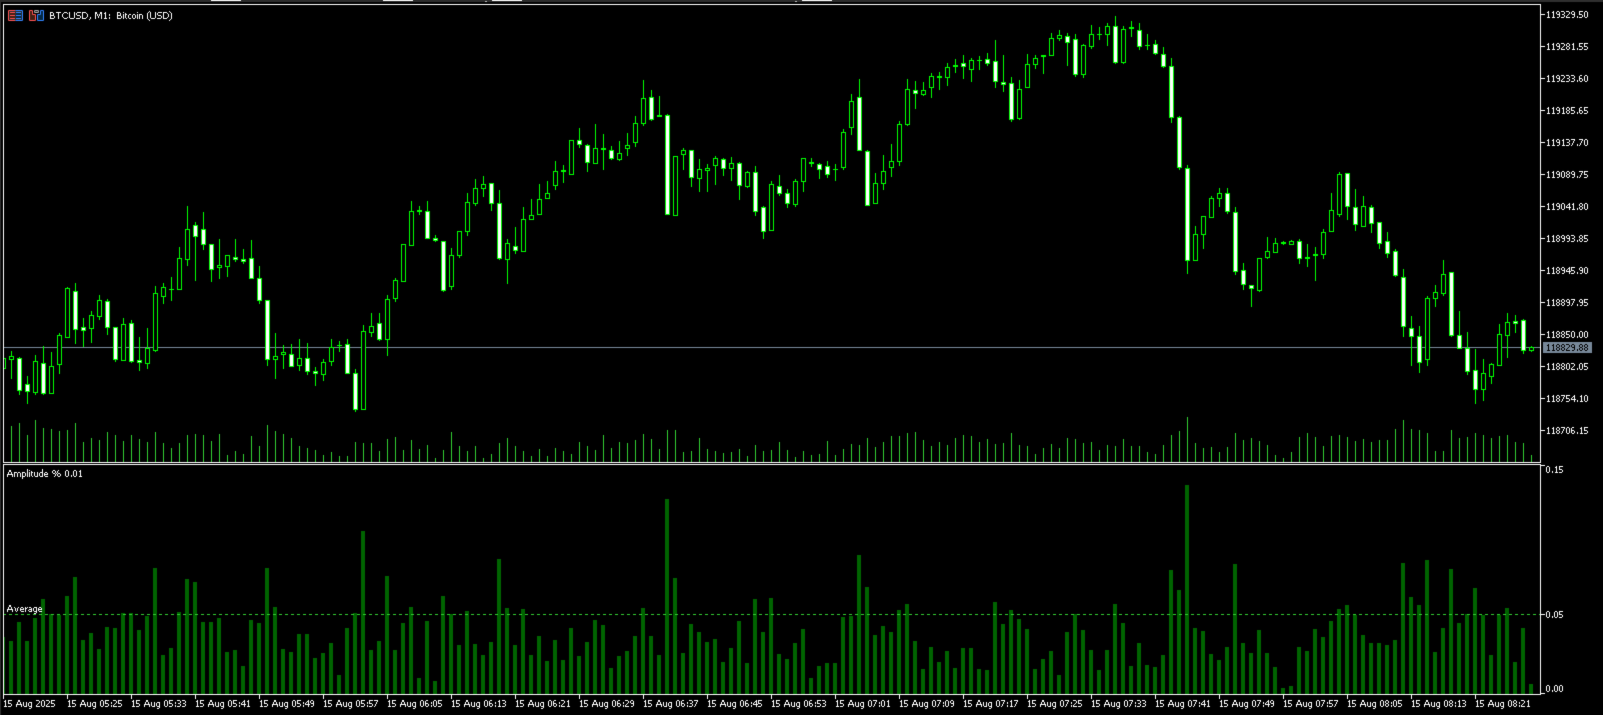
Candle Amplitude Oscillator
- Indicators
- Version: 1.10

Gain a crystal-clear perspective on market volatility with the Candle Amplitude Oscillator. This lightweight and efficient tool moves beyond simple price analysis to show you the true energy within each candle, helping you make more informed trading decisions.
Instead of guessing whether a market is active or quiet, this indicator gives you a precise, standardized measurement of volatility that works on any symbol and any timeframe.
What is Candle Amplitude?
Candle Amplitude measures the total distance a candle has traveled from its highest point to its lowest point. The indicator then converts this range into a universal percentage value. This is a crucial advantage because it provides a standardized way to compare volatility across completely different instruments, from a tight Forex pair like EUR/CHF to a volatile cryptocurrency like Bitcoin. A 2% amplitude bar means the same thing everywhere.
How It Works
The indicator plots two elements in a separate window below your main chart:
-
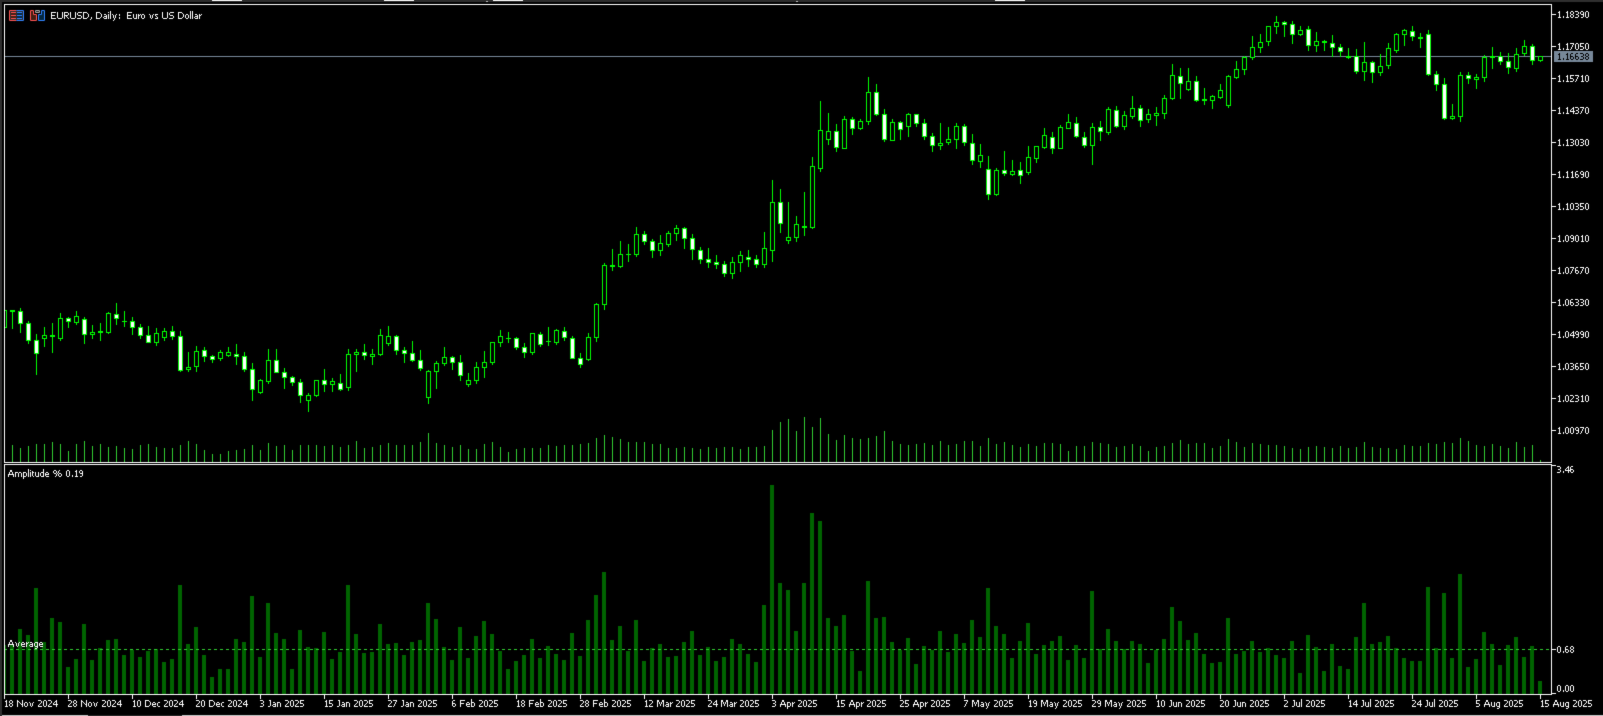
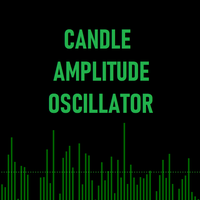
The Amplitude Histogram: Each bar in the histogram represents a single price candle, showing you its calculated amplitude percentage. Taller bars signify higher volatility, while shorter bars indicate a quiet, consolidating market.
-
The Dynamic Average Line: A horizontal line is drawn across the histogram, representing the average amplitude over a recent period. This line provides immediate context, allowing you to see if the current volatility is above or below the recent norm at a single glance.
Key Features & Benefits
-
Non-Repainting and Non-Lagging: The indicator's values are final. Once a price bar closes, its amplitude is calculated and permanently fixed. What you see is what actually happened.
-
Universal Compatibility: Works seamlessly on any timeframe and with any financial instrument available in your terminal, including Forex, cryptocurrencies, indices, and stocks.
-
Instant Volatility Context: The dynamic average line acts as a benchmark, instantly telling you if the market is unusually active or quiet compared to the recent past.
-
Lightweight & Fast: Built with efficient code to ensure it runs smoothly without slowing down your MetaTrader 5 terminal.
-
Fully Customizable: Easily adjust the colors, widths, and calculation periods to match your unique trading style and chart theme.
How It Can Enhance Your Trading
-
Identify Breakout Potential: A series of low-amplitude bars followed by a sudden spike above the average can signal a strong potential breakout.
-
Gauge Trend Strength: In a healthy trend, you often expect to see consistently strong amplitude on trending candles. A decline in amplitude might suggest the trend is losing momentum.
-
Improve Risk Management: By observing the average amplitude, you can get a better sense of the market's recent "character" and make more informed decisions about stop-loss placement.
-
Filter Low-Quality Setups: Avoid entering trades during periods of extremely low volatility where price action is choppy and unpredictable.
Input Parameters
You have full control over the indicator's appearance and behavior:
Histogram Settings
-
InpBarColor: Sets the color of the histogram bars.
-
InpBarWidth: Adjusts the thickness of the histogram bars.
Average Amplitude Settings
-
InpAveragePeriod: The number of recent bars to use for calculating the average amplitude line.
-
InpAverageColor: Sets the color of the average line.
-
InpAverageWidth: Adjusts the thickness of the average line.
-
InpAverageStyle: Choose the style of the average line (e.g., solid, dotted, dashed).
The Candle Amplitude Oscillator is a professional utility designed to provide clarity. It is not a signal provider, but rather an essential decision-support tool for traders who value a deeper understanding of market dynamics.