Support and Ressistance
- Indicators
- Raphael Lorenz Baumgartner
- Version: 1.0
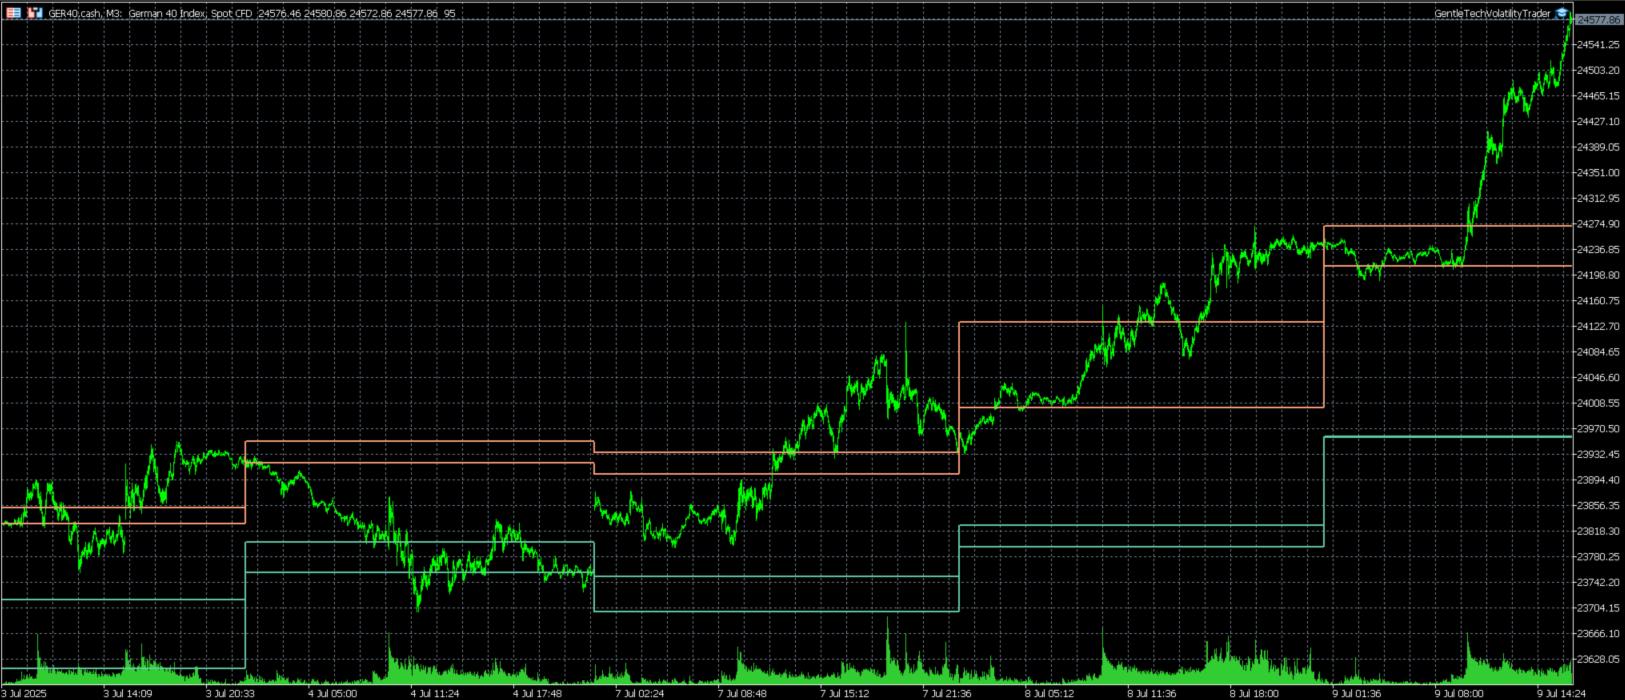
Last Day Support & Resistance
Platform: MetaTrader 5
Type: Custom Indicator
Display: Chart Window (Overlay)
Functions:
-
Calculates Support and Resistance zones based on high/low patterns of the previous day.
-
Uses a sliding sampling window ( SampleWindowSize ) to detect recent price ranges.
-
Detects potential support if current price range is significantly below previous highs.
-
Detects potential resistance if price range is significantly above previous lows.
-
Updates four output buffers:
-
LDResistanceHigh – potential resistance top
-
LDResistanceLow – potential resistance base
-
LDSupportHigh – potential support top
-
LDSupportLow – potential support base
-
Input Parameters:
-
SampleWindowSize (default: 10)
Number of candles used to detect a relevant price segment (mini-range).
Output Values:
-
LDResistanceHigh / LDResistanceLow
-
High and low boundaries of recent price action above prior range → interpreted as resistance zone.
-
-
LDSupportHigh / LDSupportLow
-
High and low boundaries of recent price action below prior range → interpreted as support zone.
-