Sideways Detector indicator MT4
- Indicators
- Eda Kaya
- Version: 1.3
Sideways Detector indicator for MetaTrader 4
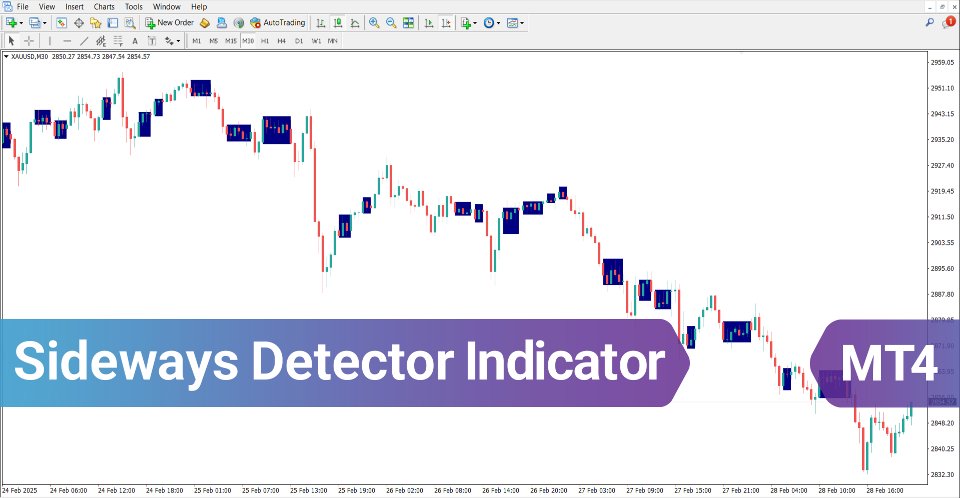
The Sideways Detector indicator is a technical analysis tool on the MetaTrader 4 platform that displays range areas and identifies the market condition in blue boxes. This MetaTrader 4 indicator uses internal algorithms to detect price ranges and determine whether a trend exists.
«Indicator Installation & User Guide»
MT4 Indicator Installation |Sideways Detector indicator MT5| ALL Products By TradingFinderLab | Best MT4 Indicator: Refined Order Block Indicator for MT4 | Best MT4 Utility: Trade Assistant Expert TF MT4 | TP & SL Tool: Risk Reward Ratio Calculator RRR MT4 | Money Management: Easy Trade Manager MT4 | Trade Copier: Free Fast Local Trade Copier MT4
Sideways Detector Specifications Table
The general specifications and features of the Sideways Detector indicator are displayed in the table below:
| Category | Trading Cycles – Trading Assist – Price Action |
| Platform | MetaTrader 4 |
| Skill Level | Intermediate |
| Indicator Type | Range – Breakout |
| Timeframe | Multi Timeframe |
| Trading Style | Intraday Trading |
| Trading Market | All Markets |
Indicator Overview
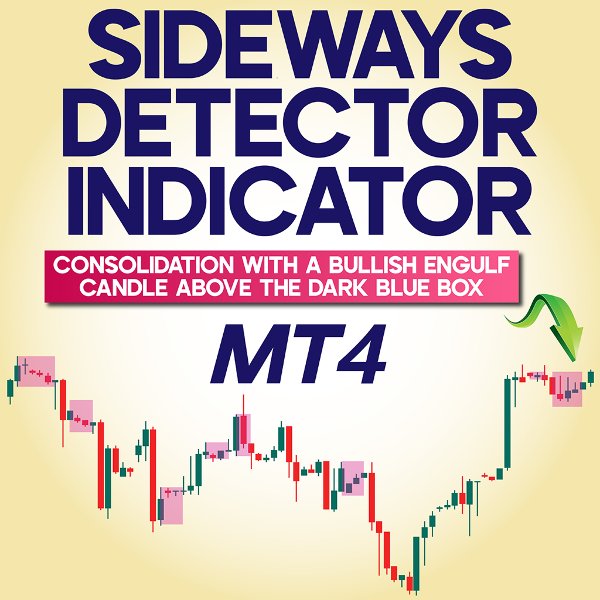
If the price oscillates within a range without a trend, the Sideways Detector indicator displays it in a blue box.
This box acts as a zone for exiting trades or an entry opportunity for fast scalpers. Furthermore, this range may also be considered a support or resistance level. If a stabilizing candle closes outside this zone, the probability of a new trend formation increases.
Uptrend Conditions
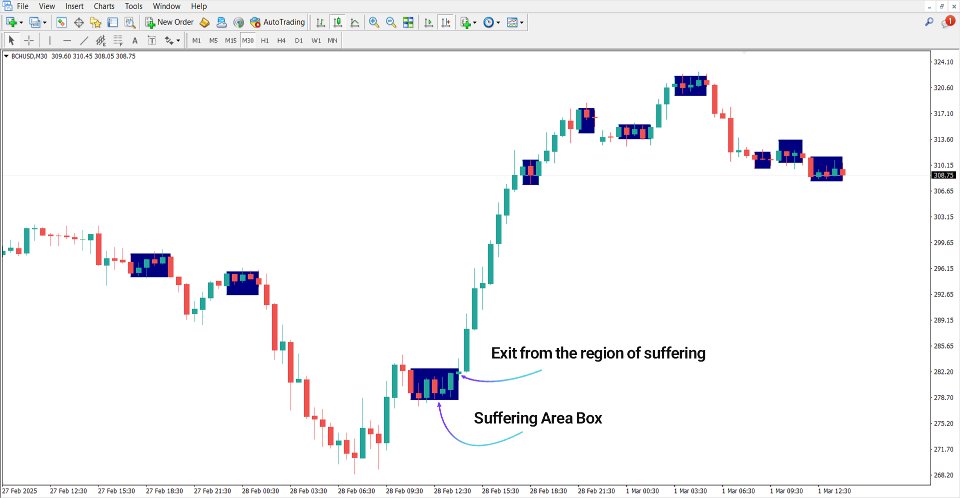
The Bitcoin Cash (BCH/USD) price chart is shown in a 30-minute timeframe. The occurrence of several trendless candles within a price range indicates market indecision. If the price breaks upward from this range, it signals strong buyer entry and creates a favorable opportunity for entering buy trades.
Downtrend Conditions
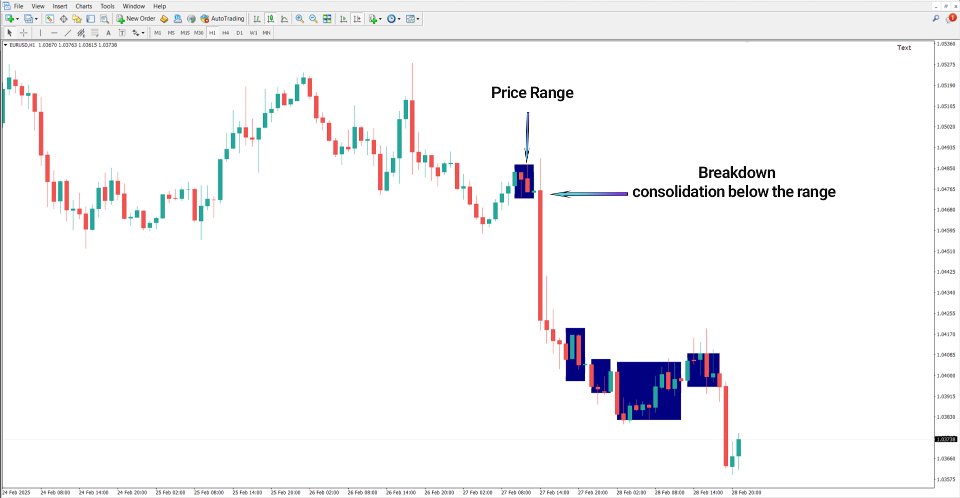
The EUR/USD currency pair chart is displayed in a one-hour timeframe.
This MetaTrader 4 Trading Assisti ndicator, by showing non-trending ranges in blue, enables the detection of a range-bound market. If a candle stabilizes below this range, it confirms an exit from the range phase and increases the likelihood of a new downtrend beginning.
Indicator Settings
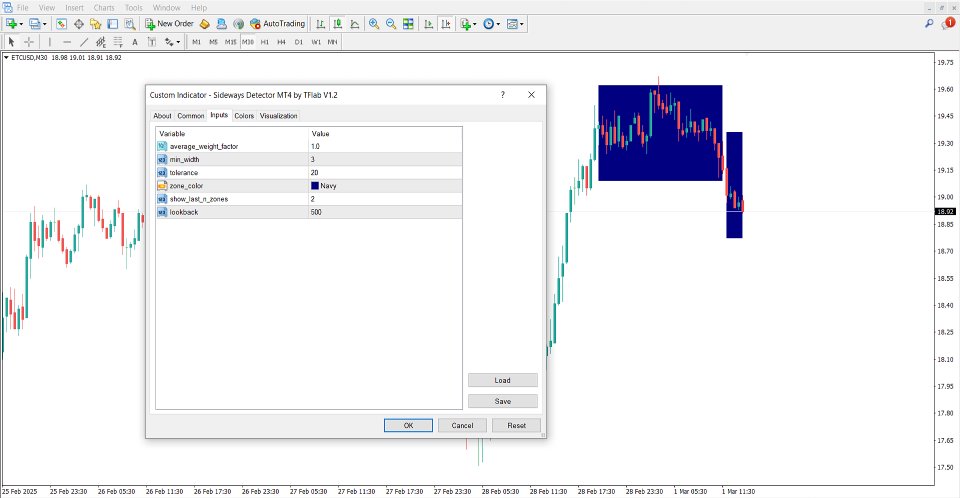
Image below shows the adjustable parameters in the settings panel:
- Average weight factor: Weighted average coefficient
- Min width: Minimum range width
- Tolerance: Tolerance or sensitivity level
- Zone Color: Zone color
- Show Last N Zones: Display the last N zones
- Lookback: Number of candles examined
Conclusion
The Sideways Detector indicator identifies neutral markets and detects trend breakout points. A correct understanding of how this indicator works can increase trading accuracy and reduce the risk of entering the market under unfavorable conditions.
