Period Multi Candle Tracer
- Indicators
- Version: 1.10
- Updated: 15 November 2026
- Activations: 5

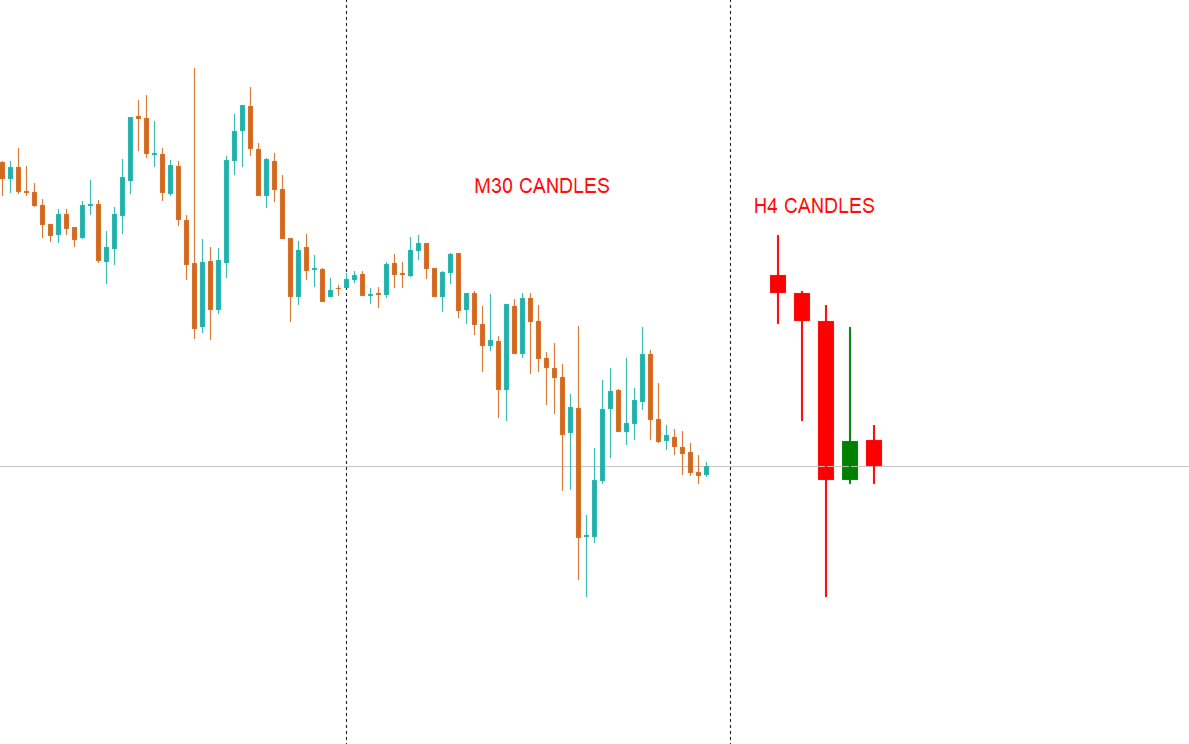
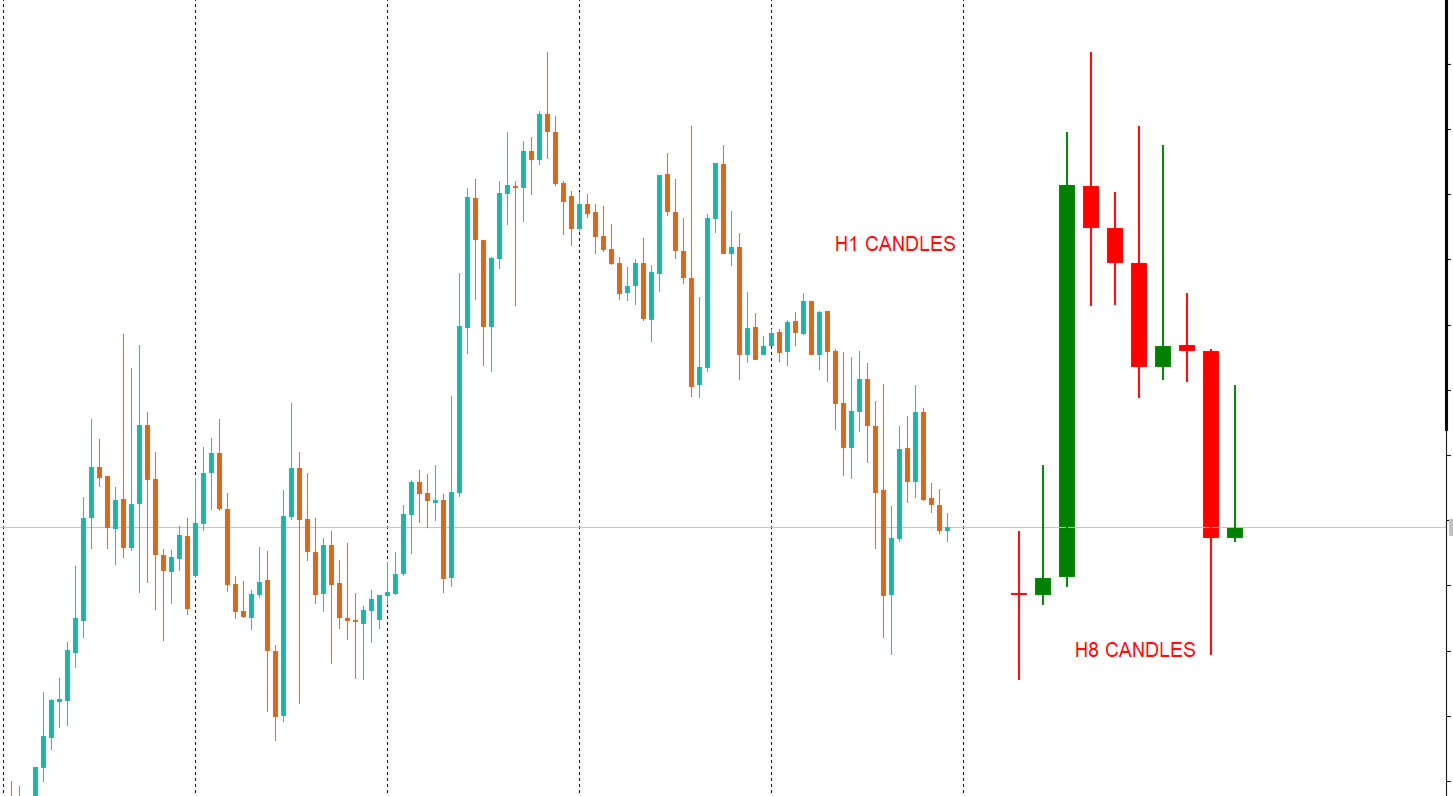
Period Multi Candle Tracer draws the latest candles of up to four timeframes of your choice on the chart you are already trading, so you can read the higher-timeframe picture without switching charts.
You can show the candles in two ways.
On chart: each timeframe is a labelled group of candles placed in the empty space to the right of the current price. They use the same price scale as your chart, so higher-timeframe highs, lows, opens and closes line up directly with current price.
Panel: a sub-window opens below the chart with one column per timeframe. Each column is scaled to its own range and shows the timeframe name, the candles, and the current price with the % change of the running candle. You can resize the panel by dragging its border.
Each of the 4 timeframe slots has its own settings: switch it on or off, pick any timeframe from M1 to MN1, choose how many candles to show (1 to 10), and give it its own bullish and bearish colours so every timeframe is easy to tell apart.
You can also draw OHLC bars instead of candles, and adjust the body width, line thickness, spacing between candles, spacing between timeframe groups, and the distance from the last bar. Timeframe labels have their own colour and size. The panel uses your chart background colour by default.
The indicator updates on every tick and once per second, so the running candle stays current even when the market is quiet. Higher-timeframe history is loaded in the background and nothing is drawn from incomplete data. You can run several copies on the same chart, for example one on the chart and one in the panel. Its objects are hidden from the object list, cannot be moved by accident, and are removed when you remove the indicator.
Tips:
- On-chart mode draws to the right of price, so turn on Chart shift (Chart properties, Common tab) and increase the shift if the groups do not fit.
- Very large timeframes, such as MN1 on an M5 chart, can go beyond the visible price range in on-chart mode. Panel mode always fits every timeframe.
INPUTS
Timeframes (slots 1 to 4)
- Show Timeframe 1-4: switch each slot on or off. Slot 1 is on by default, slots 2-4 are off.
- Timeframe 1-4: the timeframe to show. Defaults are D1, H4, W1 and MN1.
- Candles/Bars: how many candles to show for that timeframe, 1 to 10. Default 3.
- Bullish Color and Bearish Color: up and down colours for that timeframe. Defaults are Green/Red, DodgerBlue/OrangeRed, Teal/Purple and OliveDrab/Goldenrod.
Display Settings
- Display Location: On chart (right of price) or Panel below the chart.
- Show As Bar Instead of Candle: draw OHLC bars instead of candles.
- Wick / Bar Line Width: line thickness in pixels. Default 2.
- Show Timeframe Labels: show the timeframe names, and the price and % change in the panel.
- Label Color and Label Font Size: appearance of the labels. Default Gray, 8.
On-Chart Mode
- Initial Display Offset: bars between the last bar and the first group. Default 10.
- Body Width: candle body width in bars. Default 2.
- Space Between Candles: in bars. Default 1.
- Space Between Timeframes: in bars. Default 3.
Panel Mode
- Panel Resizable By Dragging: lets you drag the panel border to resize it. Default on.
- Panel Height: fixed height in pixels, used only when the panel is not resizable. Default 150.
- Panel Background: None uses the chart background colour.
- Column Separator Color: colour of the lines between columns. Default DimGray.