ZigZag3LZZ
- Indicators
- Version: 1.0
- Activations: 5

What It Is For
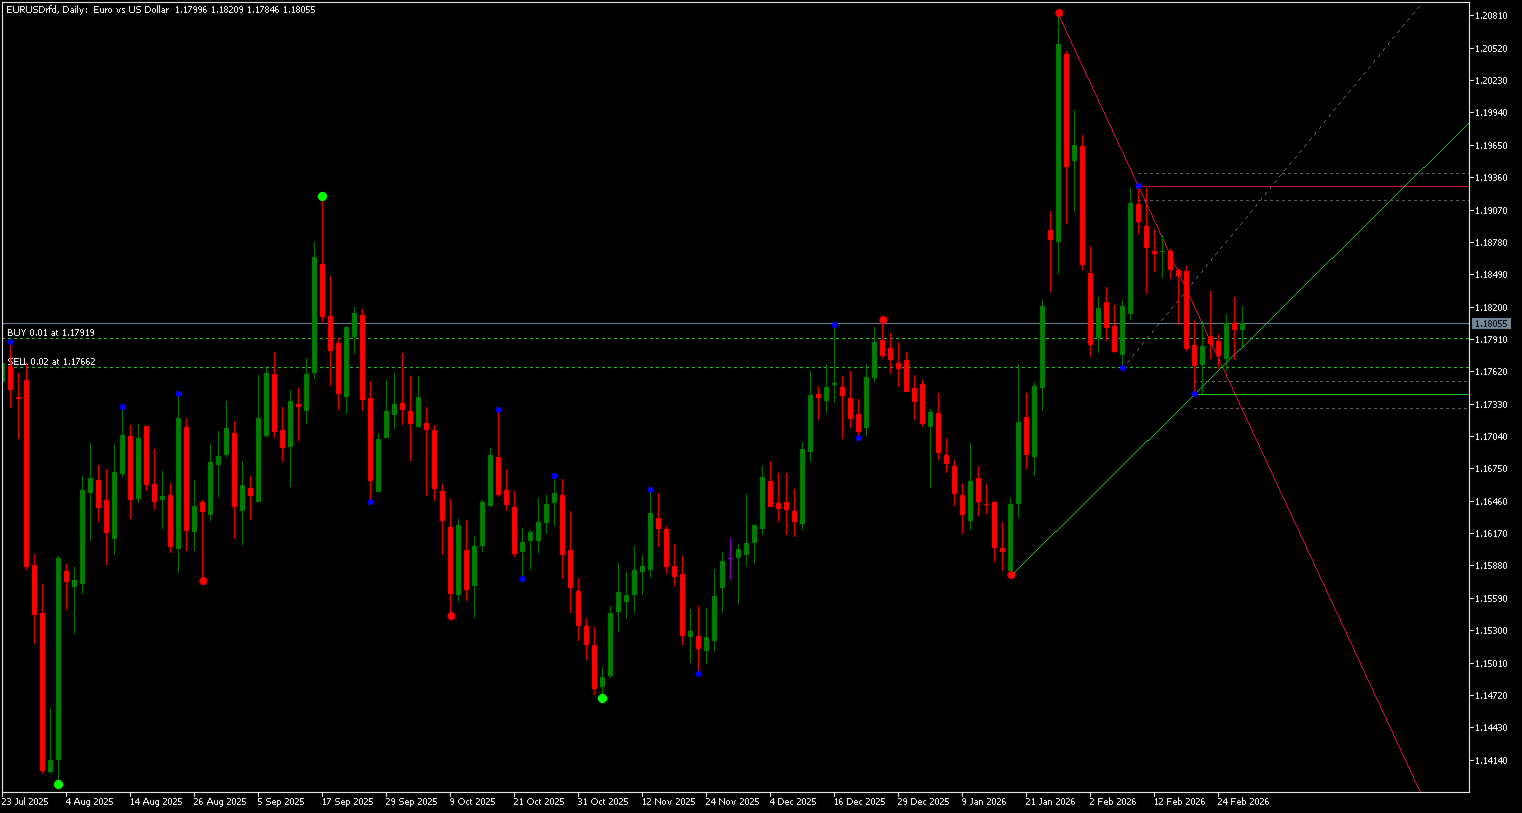
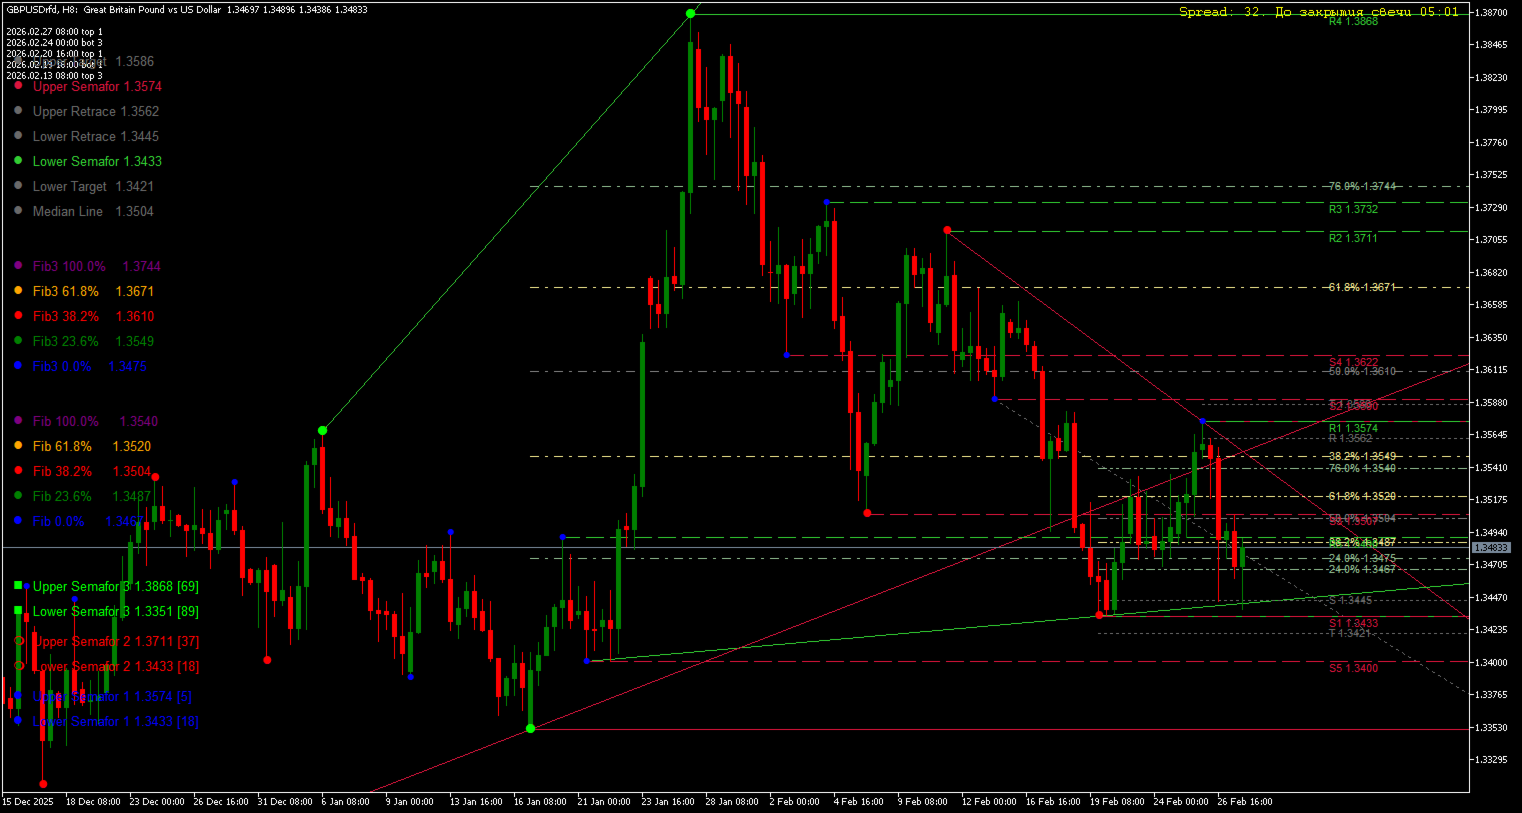
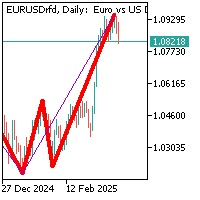
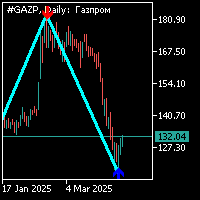
The ZigZag_3LZZ indicator is designed for technical analysis of financial markets. It displays three multi-colored broken ZigZag lines with different periods (5, 13, 34) on the chart, allowing the trader to:
-
Visually identify key price reversal levels
-
Filter out insignificant price fluctuations and market noise
-
Build trend lines based on the latest extremums
-
Automatically calculate Fibonacci levels (0.24, 0.382, 0.5, 0.618, 0.76)
-
Identify current support and resistance levels
-
Receive instant reversal signals when new extremums appear
-
Visually compare three time periods on one chart
Where It Is Used
The indicator is used in various trading strategies:
-
Trend Trading — determining trend direction using three multi-directional ZigZag lines
-
Level Trading — market entry from support/resistance levels
-
Reversal Point Detection — signals when new extremums form
-
Fibonacci Trading — automatic construction of correction and extension levels
-
Multi-Timeframe Analysis — comparing three ZigZag levels to confirm signals
-
Scalping — using fast signals from ZigZag with period 5
-
Swing Trading — working with trend lines from ZigZag with period 34
Which Markets It Is Used On
The indicator is universal and works on all types of markets:
| Market | Application Features |
|---|---|
| Forex | Works excellently on all currency pairs, especially on majors (EURUSD, GBPUSD, USDJPY) |
| Stock Market | Effective for analyzing highly liquid stocks |
| Commodity Market | Suitable for gold (XAUUSD), oil (WTI, Brent), silver |
| Cryptocurrencies | Performs well on Bitcoin, Ethereum, and other altcoins |
| Futures | Applicable for index futures (S&P 500, Dow Jones) |
| ETFs | Suitable for analyzing exchange-traded funds |
Which Instruments Are Best to Use
Currency Pairs (Forex):
-
Majors: EURUSD, GBPUSD, USDJPY, AUDUSD, USDCAD, NZDUSD, USDCHF
-
Cross rates: EURGBP, EURJPY, GBPJPY, AUDJPY
-
Exotics: USDTRY, USDZAR, USDRUB (parameter adjustment required)
Stocks:
-
Blue chips: Apple, Microsoft, Google, Amazon, Tesla
-
Banking sector: JPMorgan, Goldman Sachs
-
Oil & Gas sector: Exxon, Shell
Cryptocurrencies:
-
Bitcoin (BTCUSD)
-
Ethereum (ETHUSD)
-
Binance Coin (BNBUSD)
-
Cardano (ADAUSD)
Commodities:
-
Gold (XAUUSD)
-
Silver (XAGUSD)
-
Brent Oil (UKOIL, Brent)
-
WTI Oil (USOIL)
Which Timeframes Are Best to Use
| Timeframe | ZigZag Level | Strategy |
|---|---|---|
| M1-M5 (minutes) | Period 5 | Scalping, market entry on fast signals |
| M15-M30 (15-30 minutes) | Period 13 | Short-term trading, intraday movements |
| H1-H4 (hourly) | Period 34 | Medium-term trading, trend determination |
| D1-W1 (daily/weekly) | Combination of all three | Long-term analysis, global levels |
Optimal Timeframe Settings:
-
For scalping (M1-M5): use signals from ZigZag 1 (blue), ignore the green
-
For intraday trading (M15-M30): pay attention to intersections of blue and red
-
For medium-term trading (H1-H4): focus on red and green levels
-
For long-term analysis (D1+): use all three levels to determine the global trend
Features
-
Three ZigZag levels with periods 5, 13, and 34 (fully customizable)
-
Three colors for each level (blue, red, green)
-
Different sized circles for better visualization (the larger the period, the larger the circle)
-
Automatic construction of trend lines, Fibonacci levels, support/resistance
-
Sound alerts when price reaches important levels
-
Instant reversal signals when a new extremum appears on the current bar
-
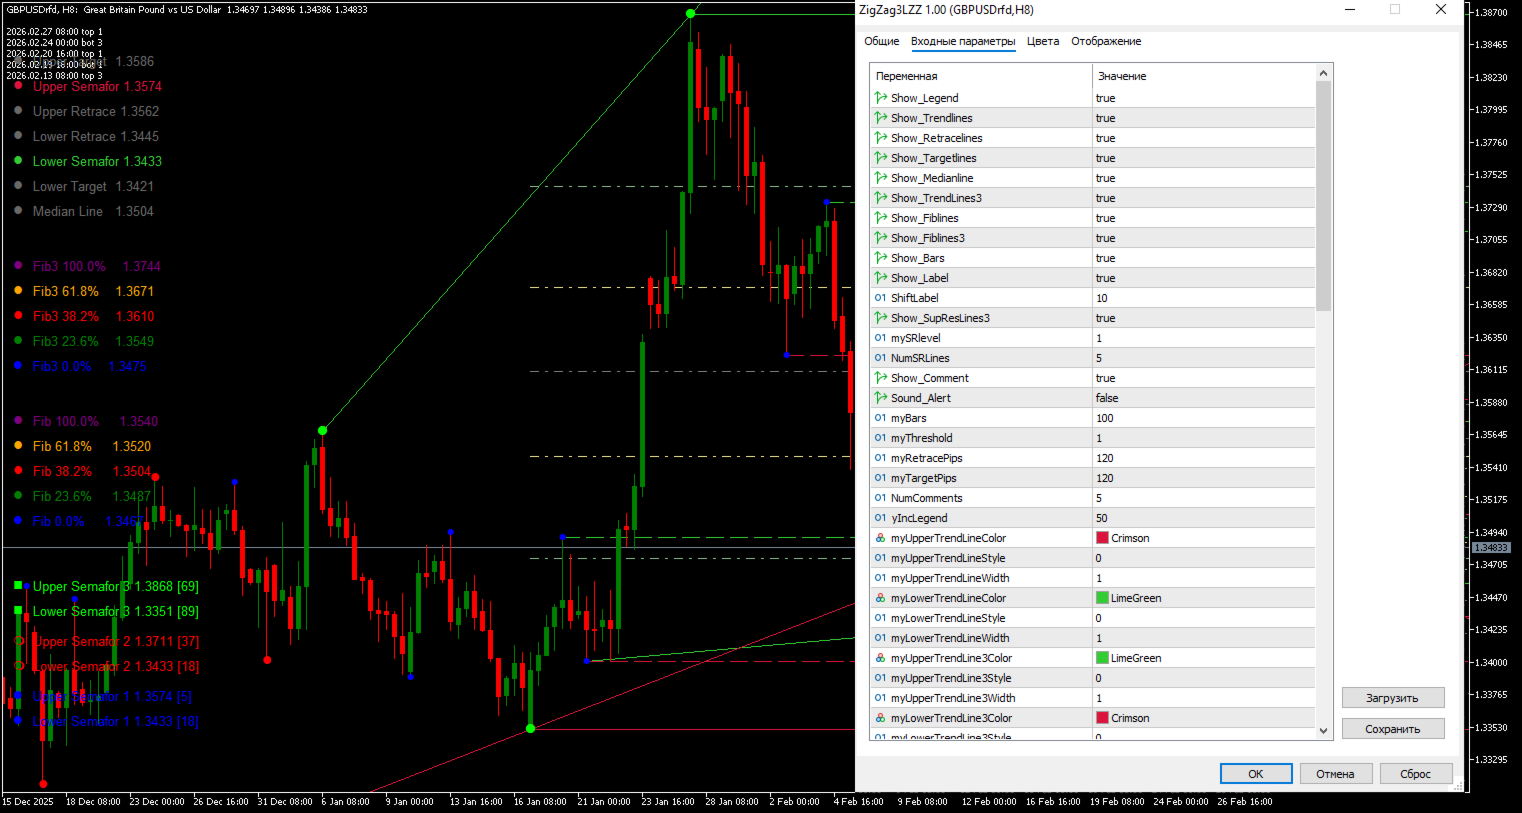
Customizable color palette through the "Colors" tab in properties
-
Legend on the chart displaying current values of all levels
-
No external indicators required — all ZigZag logic is built into the code
-
Protection against frequent redrawing — optimized for stable operation
Disadvantages
-
Lag — like any ZigZag, the indicator redraws when new extremums form (historical data may change)
-
Complexity for beginners — a large number of lines and levels can overload the chart
-
Not an independent signal — requires confirmation from other technical analysis tools
-
Reacts to noise — at small periods, it may give false signals on volatile markets
-
Requires adjustment for specific currency pairs and timeframes (optimal parameters may vary)
-
Function overload — when all options are enabled, the chart becomes difficult to read
How to Use
-
Install the indicator on the chart (drag it into the price window)
-
In the settings, select the desired display elements:
-
Trend lines (Trendlines)
-
Fibonacci levels (Fiblines)
-
Support/resistance levels (SupResLines)
-
-
Customize the colors to your style ("Colors" tab)
-
Watch for the appearance of new circles — these are signals of a possible reversal
-
Use trend lines to determine the direction of movement
-
Fibonacci levels will help determine targets and correction levels
-
When price reaches important levels, the indicator will sound an alert
Recommended Settings
For Beginners:
-
Enable only Show_Trendlines and Show_Bars
-
Disable all other options for chart clarity
For Professionals:
-
Show_Trendlines — for trend determination
-
Show_Fiblines — for correction levels
-
Show_SupResLines3 — for support/resistance levels
-
Sound_Alert — for sound notifications
For Multi-Timeframe Analysis:
-
Install the indicator on H1 with periods 5, 13, 34
-
Install the same indicator on H4 with periods 8, 21, 55
-
Compare signals for confirmation
ZigZag_3LZZ is not just an indicator, but a complete trading system that combines three ZigZag indicators, automatic Fibonacci level analysis, trend line construction, and support/resistance level identification. Suitable for both beginner traders (in basic configuration) and professionals (with full feature set).