Anchored VWAP indicator

5

Anchored VWAP (Volume-Weighted Average Price) Indicator

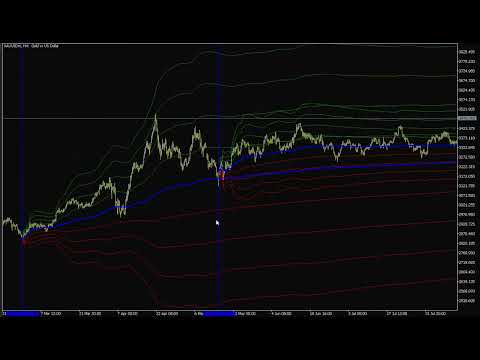
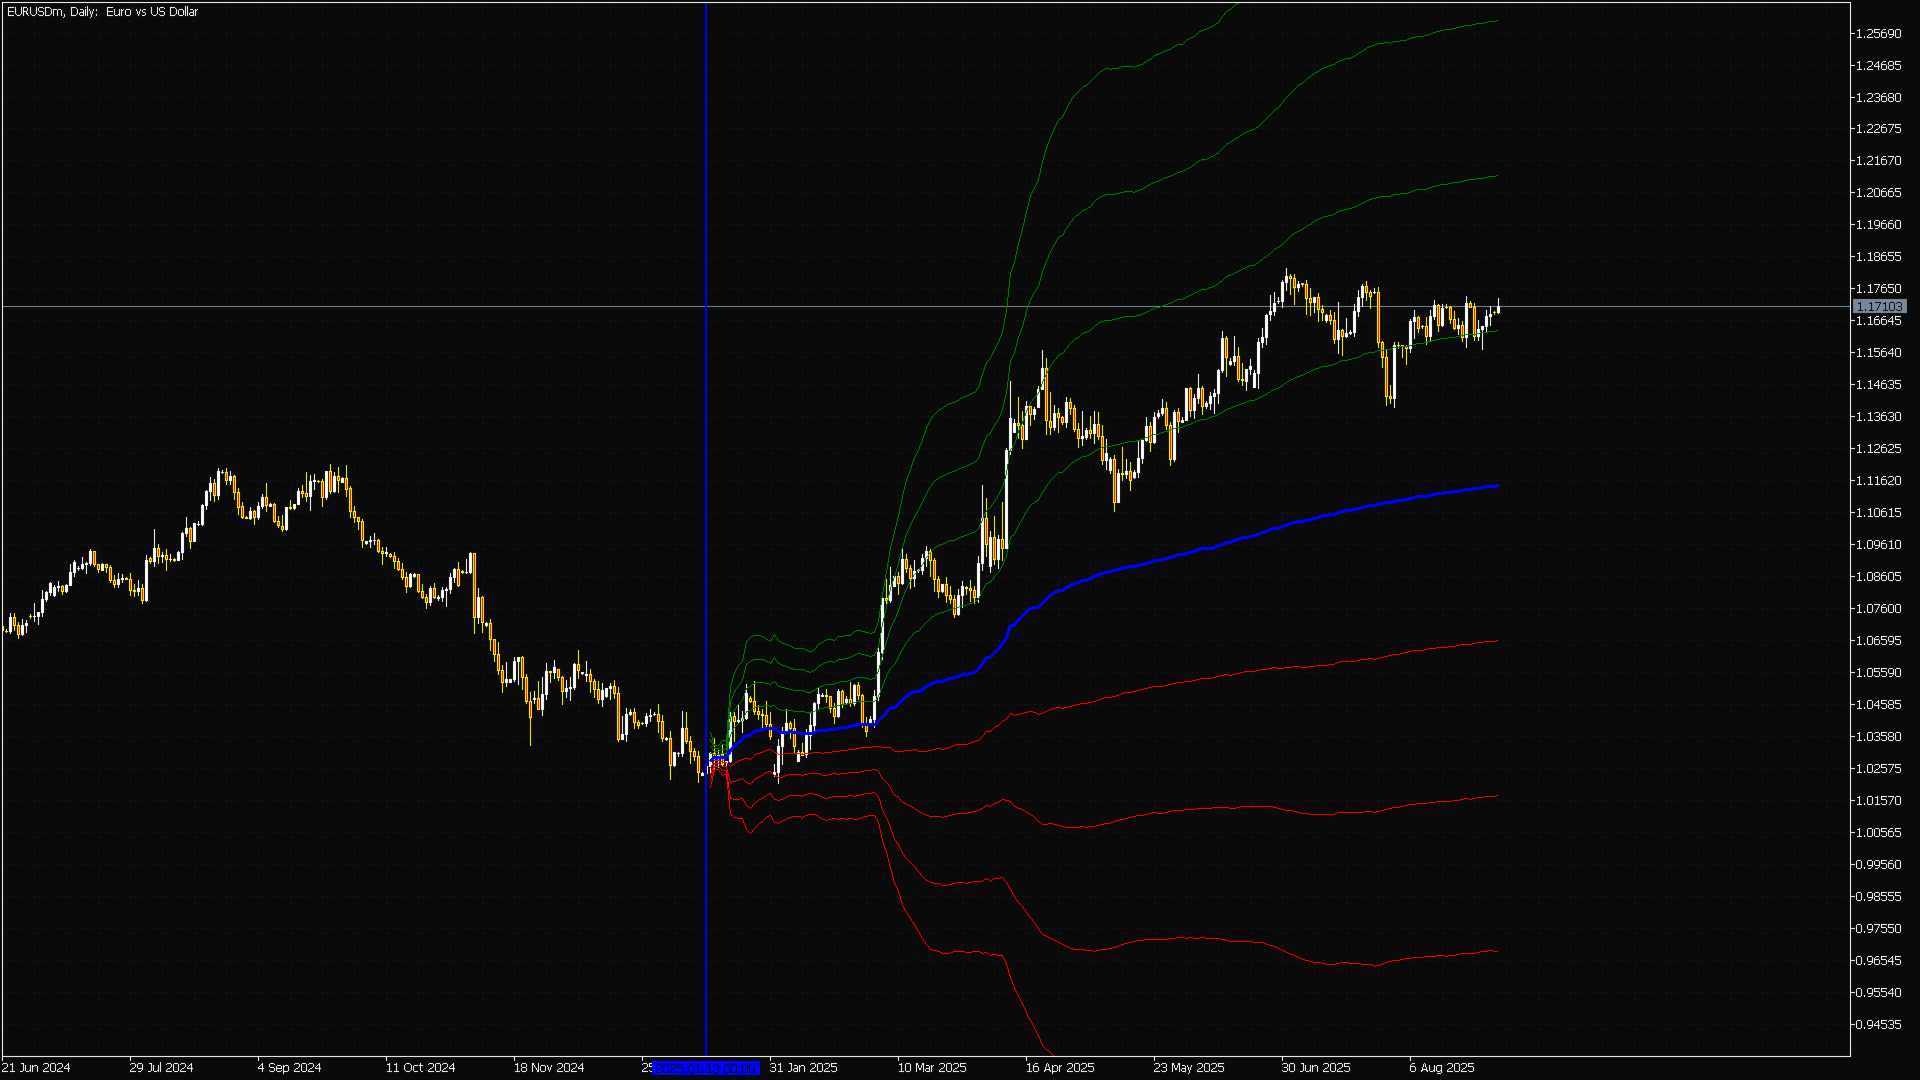
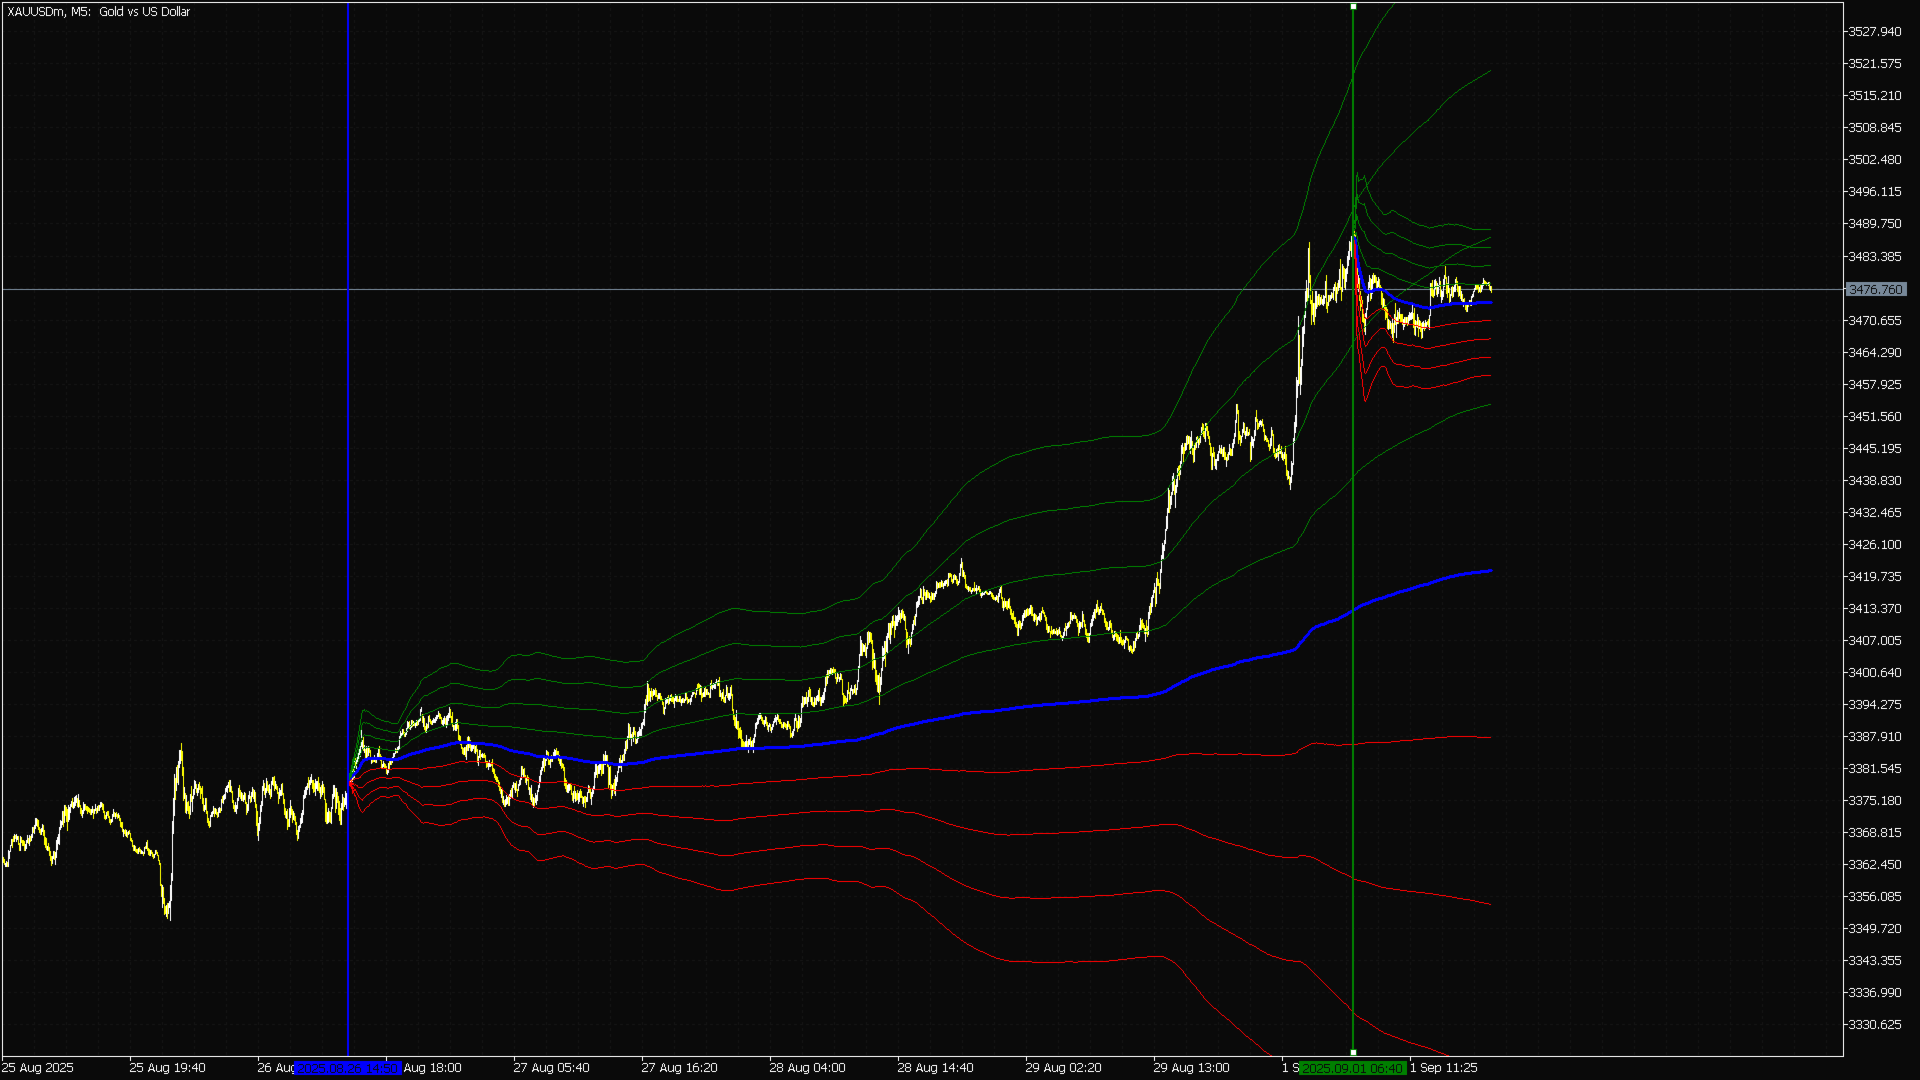
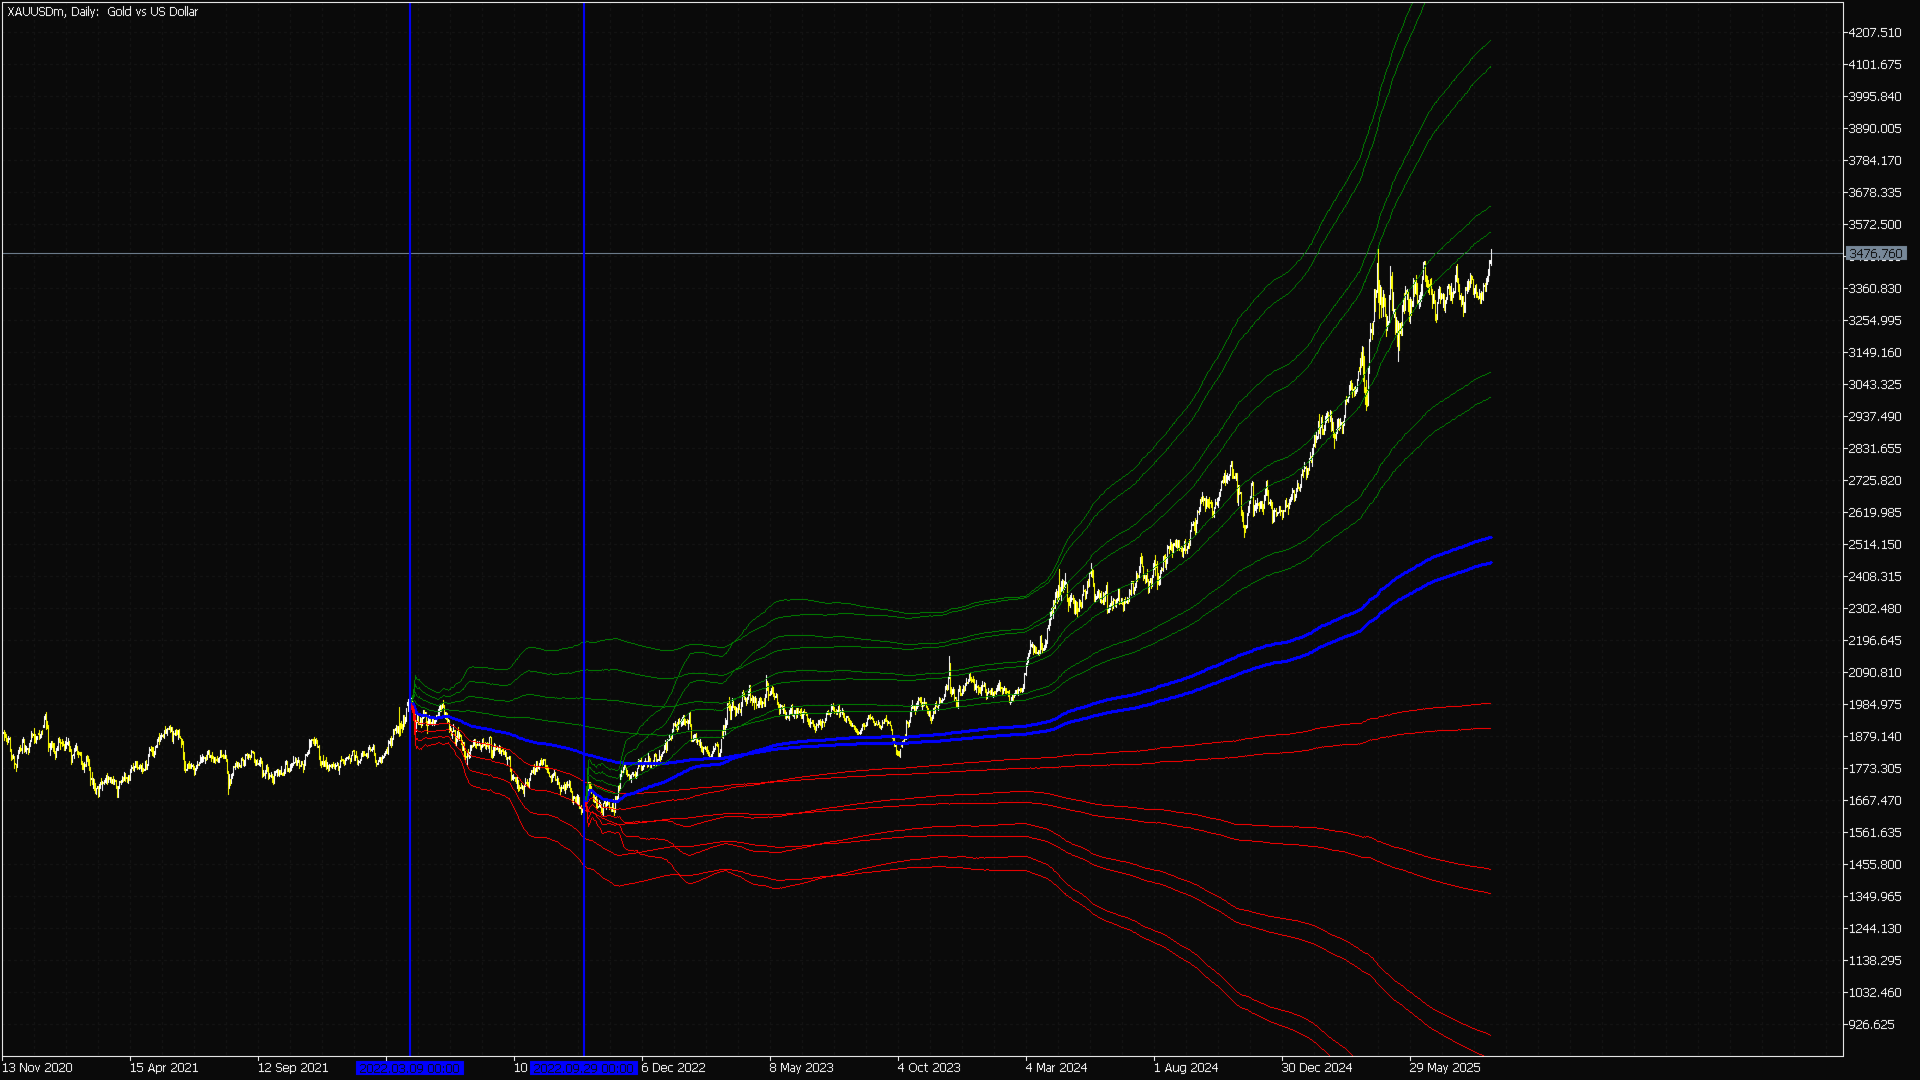
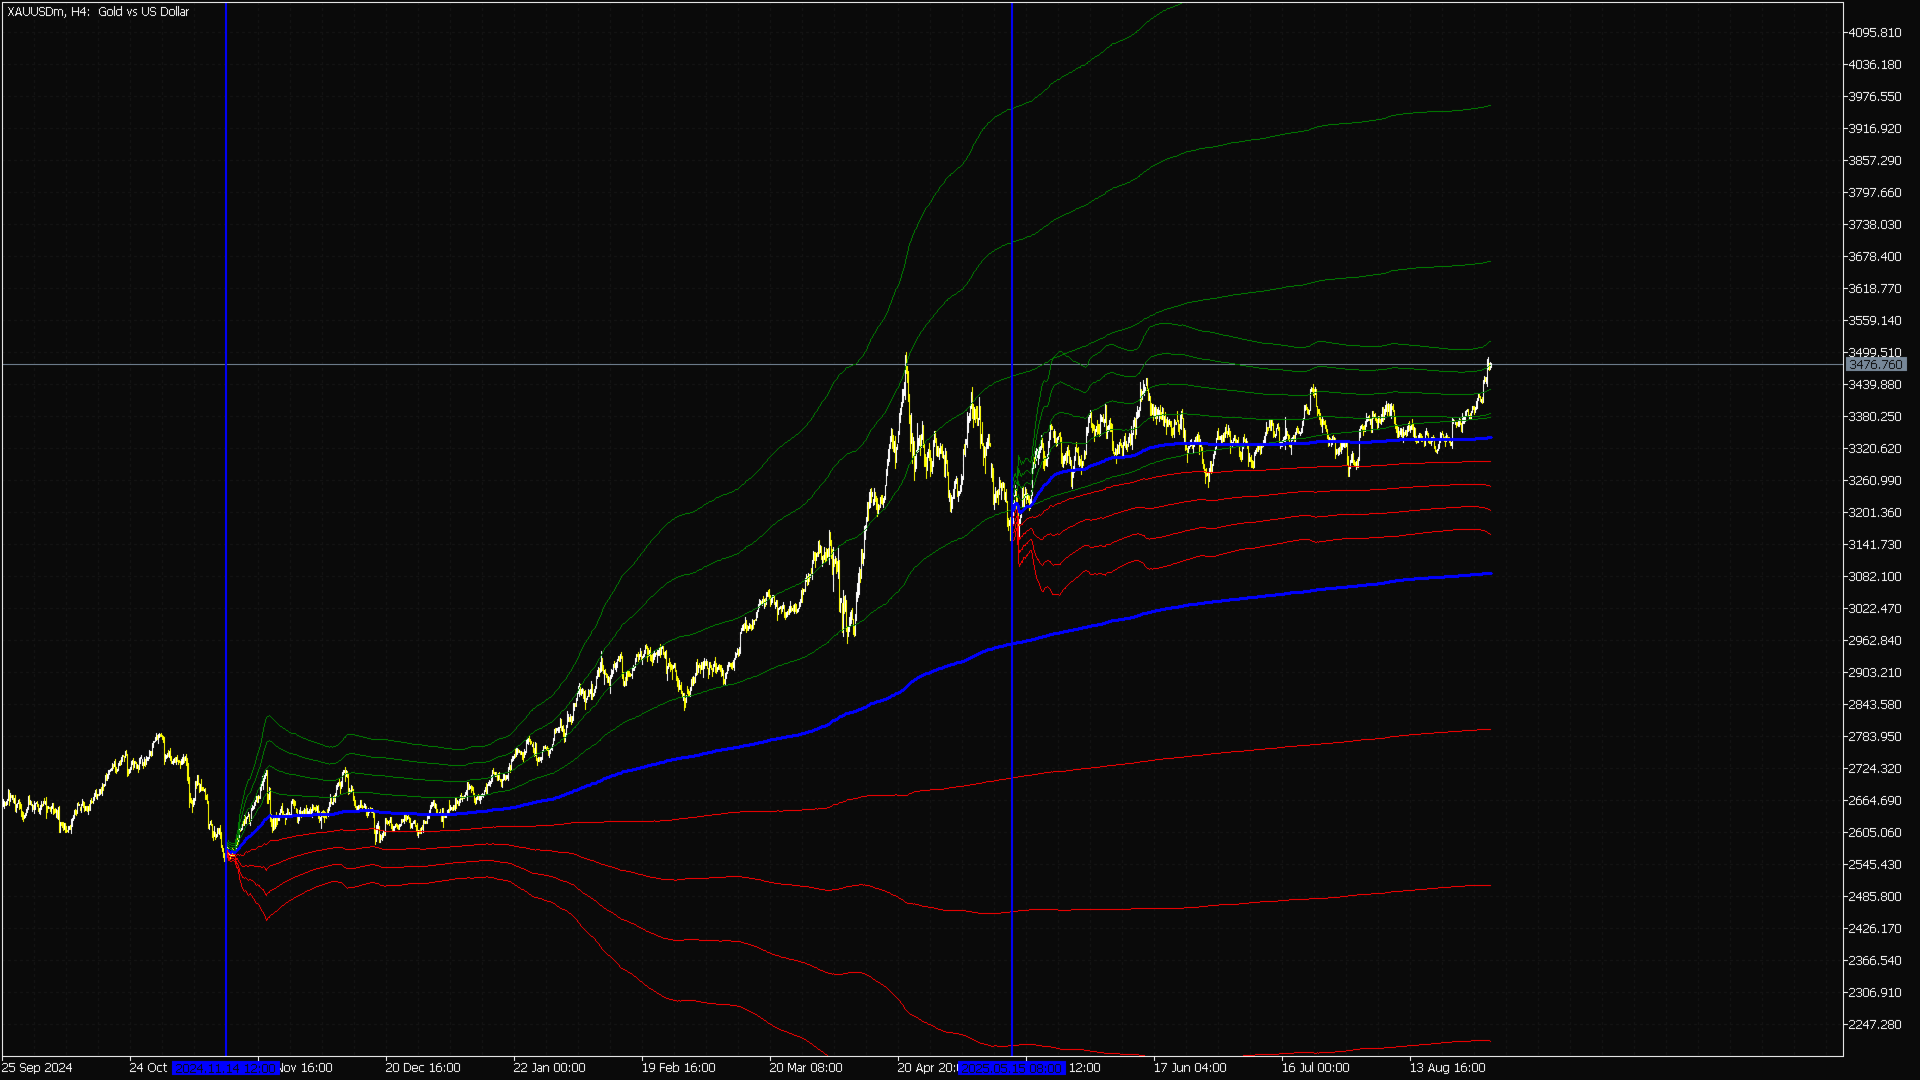
The Anchored VWAP (Volume-Weighted Average Price) is a technical analysis tool that calculates the average price of an asset, weighted by volume, from a specific user-defined starting point. Unlike traditional VWAP, which resets daily, the Anchored VWAP allows traders to select a significant event, such as earnings reports, swing highs/lows, or other key price levels, to analyze price trends and market sentiment.

By anchoring the VWAP to a chosen date or price level, traders can gain deeper insights into institutional activity, support/resistance zones, and trend strength. The indicator helps identify fair value areas and potential entry/exit points based on how price interacts with the anchored VWAP line.

Key Features:

  • Customizable anchor point to analyze price action from critical events
  • Helps determine trend direction and fair value areas
  • Useful for spotting dynamic support and resistance levels
  • Applicable across multiple timeframes for enhanced market analysis

The Anchored VWAP is widely used by technical traders, portfolio managers, and algorithmic strategists to refine their trading decisions by combining price, volume, and time into a single, insightful metric.


Reviews 10
zatami
42
zatami 2025.09.03 07:42 
 

Great tool you made Ahmad Kazbar. Its ability to show on different time frames is great. My only frustration is that whenever it's on the chart, a click on the chart moves the avwap start line to where I clicked. Though the way I solve this is to either change timeframes or remove the avwap or exit platform and come back on, I still feel you can do something about it unless I'm not doing something right. Please incorporate an option to hold the start line in place where it is without any shifting whenever I click any point in the chart. I know you may have done it that way for the purpose of one just selecting any point with a click, but there's need to give one an option to allow or not to allow because there are other tools I use which need clicking always. Thank you for this wonderful tool.

UPDATE: Thank you Ahmad Kazbar for replying me immediately. It shows indeed Developer Support to User is excellent.

I'm applying what you said in your reply by allowing the default look back (starting point) setting of 200 starting point candles. Then changing the starting point to the candle I want by double-clicking on the line and moving it. When I press again, the point does not move; only move when I press again twice. You're some genius. Well-done for helping with this Support and providing this awesome tool.

baik6211
66
baik6211 2025.09.02 03:45 
 

Very very very good

Findolin
1489
Findolin 2025.08.14 13:23 
 

Ein exzellenter Indikator! Vielen Dank!

Recommended products
Classic Crab Harmonic Pattern Indicator for MetaTrader 5 The Classic Crab Harmonic Pattern, introduced by Scott Carney in 2000, is one of the most recognized harmonic patterns in technical analysis. Known for its precise Fibonacci measurements and favorable risk-to-reward ratio, it helps traders identify potential price reversal zones with accuracy. The Classic Crab Harmonic Pattern Indicator for MetaTrader 5 automatically detects this pattern on price charts, marking the key points X, A, B, C,
FREE
Basic Vwap
james mugendi
4 (1)
Simple Vwap with the daily, weekly and monthly VWAP is the abbreviation for   volume-weighted average price , which is a technical analysis tool that shows the ratio of an asset's price to its total trade volume. It provides traders and investors with a measure of the average price at which a stock is traded over a given period of time. How it's used Identify entry and exit points:   Traders can use VWAP to determine when to buy or sell an asset.   Understand price trends :  Traders can use V
FREE
VWAP and MVWAP
Flavio Javier Jarabeck
4.17 (6)
Volume Weighted Average Price (VWAP) is a trading benchmark commonly used by Big Players that gives the average price a Symbol has traded throughout the day. It is based on both Volume and price. Additionally we put in this indicator the MVWAP (Moving Volume Weighted Average Price). For those who do not know the usage and the importance od this indicator I recommend a great article about this subject at Investopedia ( https://www.investopedia.com/articles/trading/11/trading-with-vwap-mvwap.asp )
FREE
Stackable VWAP
Flavio Javier Jarabeck
3.5 (4)
Volume Weighted Average Price (VWAP) is a trading benchmark commonly used by Big Players that gives the average price a Symbol has traded throughout the day. It is based on both Volume and price. Additionally we put in this indicator the MVWAP (Moving Volume Weighted Average Price). For those who do not know the usage and the importance od this indicator I recommend a great article about this subject at Investopedia ( https://www.investopedia.com/articles/trading/11/trading-with-vwap-mvwap.asp
FREE
MIDAS Super VWAP
Flavio Javier Jarabeck
4.4 (10)
Imagine VWAP, MVWAP and MIDAS in one place... Well, you found it! Now you can track the movement of Big Players in various ways, as they in general pursue the benchmarks related to this measuring, gauging if they had good execution or poor execution on their orders. Traders and analysts use the VWAP to eliminate the noise that occurs throughout the day, so they can measure what prices buyers and sellers are really trading. VWAP gives traders insight into how a stock trades for that day and deter
FREE
Wolf Wave Pattern Indicator MetaTrader 5 The Wolf Wave Pattern Indicator for MetaTrader 5 is a specialized technical analysis tool designed to detect price wave patterns across different financial instruments. This indicator automatically identifies the five-wave geometric structure known as the Wolf Wave Pattern, which is commonly used by traders to pinpoint potential market reversal zones. By marking these formations directly on the price chart, the indicator assists traders in making timely e
FREE
The indicator highlights the points that a professional trader sees in ordinary indicators. VisualVol visually displays different volatility indicators on a single scale and a common align. Highlights the excess of volume indicators in color. At the same time, Tick and Real Volume, Actual range, ATR, candle size and return (open-close difference) can be displayed. Thanks to VisualVol, you will see the market periods and the right time for different trading operations. This version is intended f
FREE
Weis Waves
Flavio Javier Jarabeck
2.83 (18)
The original author is David Weis, an expert in the Wyckoff Method. The Weis Wave is a modern adaptation of the 1930's Wyckoff Method, another expert in Tape Reading techniques and Chart Analysis. Weis Waves takes market volume and stacks it into waves according to price conditions giving the trader valuable insights about the market conditions. If you want to learn more about this subject you can find tons of videos in YouTube. Just look for "The Wickoff Method", "Weis Wave" and "Volume Spread
FREE
Midas VWAP
Paulo Henrique Faquineli Garcia
4 (2)
Volume Weighted Average Price (VWAP) is a trading benchmark commonly used by Big Players that gives the average price a Symbol has traded throughout the day. It is based on both Volume and price. This indicator contains Daily VWAP and MIDAS' VWAP, which means you are able to anchor the beggining of MIDAS' calculations and, therefore you will be able to use this methodology to study price versus volume moves after anchor point. You will be able to anchor up to 3 HIGH MIDAS VWAP's and 3 LOW. Wish
FREE
VWAP Level MT5
Francesco Lenza
4.5 (2)
The VWAP Level indicator is a technical analysis tool that calculates the weighted average price for the traded volumes of a specific asset. The VWAP provides traders and investors with the average price of an asset over a specific time frame. It is commonly used by investors to compare data on "passive" trading operations, such as pension funds and mutual funds, but also by traders who want to check if an asset has been bought or sold at a good market price. To calculate the VWAP level we us
FREE
Bollinger Bands B
Flavio Javier Jarabeck
4.5 (2)
John Bollinger created this indicator in 2010 as a way to read the original indicator (Bollinger Bands) in a more "technical" way, shown as an oscillator. The typical range of the Bollinger Bands %B is 0 - 0.5 - 1.0, where "0" represents the lower band, the "0.5" the middle band, and "1" the upper band. The line on the indicator represents the Closing prices. As simple as that. SETTINGS Bollinger Bands period of analysis Standard Deviation multiplier Shift Price type to be analyzed If you like
FREE
Waves Sizer
Flavio Javier Jarabeck
3.86 (7)
Wyckoff fans, enjoy! Ideally to be used with the Weis Waves indicator, but it can be easily used alone, the Waves Sizer puts the range (in resulting Price movement) done by the Price on its market swings. You can control how accurate or loose will be the swings. This tool is very helpful for visually know how much the Price has traveled in your Timeframe. This way you can confront this level of effort with the resulting Volume, etc... Weis Waves indicator: https://www.mql5.com/en/market/produc
FREE
VWAP Simple
Deibson Carvalho
4.24 (29)
The Volume Weighted Average Price is similar to a moving average, except volume is included to weight the average price over a period.    Volume-Weighted Average Price [VWAP] is a dynamic, weighted average designed to more accurately reflect  a security’s true average price over a given period . Mathematically, VWAP is the summation of money (i.e., Volume x Price) transacted divided by the total volume over any time horizon, typically from market open to market close. VWAP reflects the capitali
FREE
Value Chart Candlesticks
Flavio Javier Jarabeck
4.69 (13)
The idea of a Value Chart indicator was presented in the very good book I read back in 2020 , " Dynamic Trading Indicators: Winning with Value Charts and Price Action Profile ", from the authors Mark Helweg and David Stendahl. The idea is simple and the result is pure genius: Present candlestick Price analysis in a detrended way! HOW TO READ THIS INDICATOR Look for Overbought and Oversold levels. Of course, you will need to test the settings a lot to find the "correct" one for your approach. It
FREE
Quantitative Candlesticks Qstick
Flavio Javier Jarabeck
4 (2)
Qstick is a way to objectively quantify candlestick analysis and improve the interpretation of candlestick patterns. Qstick was developed by Tushar Chande and published in his book " The New Technical Trader - Boost Your Profit by Plugging Into the Latest Indicators (1994) ". Qstick is built based on a moving average of the difference between the Open and Close prices. The basis of the idea is that the Opening and Closing prices are the heart of candlestick analysis. We strongly recommend the re
FREE
Weis Waves RSJ
JETINVEST
4.56 (9)
The Weis Waves RSJ Indicator sums up volumes in each wave. This is how we receive a bar chart of cumulative volumes of alternating waves. Namely the cumulative volume makes the Weis wave charts unique. It allows comparing the relation of the wave sequence characteristics, such as correspondence of the applied force (expressed in the volume) and received result (the price progress). If you still have questions, please contact me by direct message:  https://www.mql5.com/en/users/robsjunqueira/
FREE
Head and Shoulders Visual Indicator for MetaTrader 5 The Head and Shoulders Visual Indicator for MetaTrader 5 is designed to identify two key reversal patterns: the Head and Shoulders Top (Bearish) and the Head and Shoulders Bottom (Bullish). This tool is ideal for spotting market turning points and anticipating trend reversals. «Indicator Installation & User Guide» MT5 Indicator Installation  |  Head and Shoulders Visual Indicator MT4  | ALL Products By  TradingFinderLab  | Best MT5 Indicator: 
FREE
Tabajara V5
Flavio Javier Jarabeck
4.83 (35)
Metatrader 5 version of the famous Andre Machado's Tabajara indicator. If you don't know Andre Machado's Technical Analysis work you don't need this indicator... For those who need it and for those several friend traders who asked this porting from other platforms, here it is... FEATURES 8-period Moving Average 20-period Moving Average 50-period Moving Average 200-period Moving Average Colored candles according to the inflexion of the 20-period MA SETTINGS You can change the Period of all MA's
FREE
Auto Fibonacci Retracement Indicator — Flexible and Reliable This isn’t just another Auto Fibonacci Retracement indicator. It’s one of the most flexible and dependable tools available . If you find it useful, please consider leaving a review or comment — your feedback means a lot! Check out my other helpful tools below: Smart Alert Manager   - Set up advanced alerts and send them to Mobile, Telegram, Discord, Webhook... Timeframes Trend Scanner    - Scan the trend of assets in difference timefr
FREE
Fibonacci Progression with Breaks Indicator MT5 Fibonacci Progression with Breaks Indicator MT5 interprets market price shifts incrementally, following the principles of the Fibonacci sequence. This technical indicator initiates from a key pivot and plots Fibonacci-based price zones aligned with the prevailing trend direction. Additionally, it highlights trade opportunities by displaying green and red arrows to indicate potential buy or sell setups. «Indicator Installation & User Guide» MT5 Ind
FREE
Easy VWAP
Luca Spinello
VWAP Indicator, the short form of Volume Weighted Average Price, is similar to a moving average but takes into consideration the tick volume of the candles. The indicator calculates the moving average multiplying the price of each candle for the tick volume in the candle. Said calculation weighs with more significance price where more transactions were made. Features: Visual styling customizable Period customizable Ease of use
FREE
Triple Stochastic Oscillator for MT5 The   Triple Stochastic Oscillator for MT5   applies three consecutive smoothing phases to filter out unwanted market noise and highlight the genuine direction of price action. In addition to clarifying price movement, this technical tool also measures the strength of the prevailing trend and identifies overbought or oversold market conditions. «Indicator Installation & User Guide» MT5 Indicator Installation  |  Triple Stochastic Oscillator MT4   | ALL Produ
FREE
Wave Box Market Frenquency
Jean Jacques Huve Ribeiro
4.75 (4)
Totally linked to the result of a movement and the duration he had. Its height records how many ticks the asset walked during a given movement, its width shows us the duration that movement had. Its configuration must be in line with the Weis Wave Indicator configuration to observe the movement force and can indicate a possible accumulation or distribution of the movement;
FREE
VWAP Indicator
LUC JACOBUS A VERHEECKE
4.2 (25)
Volume Weighted Average Price (VWAP) The volume weighted average price (VWAP) is a  trading   benchmark  used by traders that gives the average price a security has traded at throughout the day, based on both volume and price. It is important because it provides traders with insight into both the trend and value of a security. This indicator VWAP V2 is free and is the manual version of the extended Easy VWAP indicator (30 Euro), where the date and time properties are automatically entered. With
FREE
MACD and Volume Indicator for MetaTrader 5 The MACD (Moving Average Convergence Divergence) and Volume Indicators combine core principles of technical analysis. By analyzing the convergence and divergence of moving averages, this tool provides critical insights into trend strength and potential reversals. The integration of momentum and volume analysis makes it a powerful resource for informed trading strategies. «Indicator Installation & User Guide» MT5 Indicator Installation  |  MACD and Volum
FREE
Aggression Volume
Flavio Javier Jarabeck
4.25 (16)
Aggression Volume Indicator is the kind of indicator that is rarely found in the MQL5 community because it is not based on the standard Volume data provided by the Metatrader 5 platform. It requires the scrutiny of all traffic Ticks requested on the platform... That said, Aggression Volume indicator requests all Tick Data from your Broker and processes it to build a very special version of a Volume Indicator, where Buyers and Sellers aggressions are plotted in a form of Histogram. Additionally,
FREE
Introduction This indicator detects volume spread patterns for buy and sell opportunity. The patterns include demand and supply patterns. You might use each pattern for trading. However, these patterns are best used to detect the demand zone (=accumulation area) and supply zone (=distribution area). Demand pattern indicates generally potential buying opportunity. Supply pattern indicates generally potential selling opportunity. These are the underlying patterns rather than direct price action. T
FREE
Donchian Pro
Paulo Henrique Faquineli Garcia
5 (3)
The Donchian Channel Channels are among the most popular tools of technical analysis, as they visually convey to the analyst the limits within which most price movement tends to occur. Channel users know that valuable information can be obtained at any time, whether prices are in the central region of a band or close to one of the border lines. One of the best known techniques to explore these concepts is Bollinger Bands. However, John Bollinger was not the only one to research the application
FREE
The Wormhole time frame indicator for MetaTrader 5 (MT5) is not just another trading tool—it’s your competitive edge in the financial markets. Designed with both novice and professional traders in mind, the Wormhole transforms how you analyze data and make decisions, ensuring you stay ahead of the curve. Why You Need the (free) Wormhole Indicator Outsmart the Competition: The ability to view two timeframes on the same chart simultaneously means you’re always one step ahead. No more switching be
FREE
Anti Alternate Shark Harmonic Pattern Indicator for MT5 The Anti Alternate Shark Harmonic Pattern Indicator is designed to detect deep reversal zones and price reactions in overbought or oversold market conditions. This MetaTrader 5 tool identifies precise reversal points in technical analysis by tracking structural changes in wave direction and formation. «Indicator Installation & User Guide» MT5 Indicator Installation  | Anti Alternate Shark Harmonic Indicator MT4 | ALL Products By  TradingFin
FREE
Buyers of this product also purchase
Divergence Bomber
Ihor Otkydach
4.98 (65)
Each buyer of this indicator also receives the following for free: The custom utility "Bomber Utility", which automatically manages every trade, sets Stop Loss and Take Profit levels, and closes trades according to the rules of this strategy Set files for configuring the indicator for various assets Set files for configuring Bomber Utility in the following modes: "Minimum Risk", "Balanced Risk", and "Wait-and-See Strategy" A step-by-step video manual to help you quickly install, configure, and s
Trend Screener Pro MT5
STE S.S.COMPANY
4.87 (91)
Unlock the Power of Trends Trading with the Trend Screener Indicator: Your Ultimate Trend Trading Solution powered by Fuzzy Logic and Multi-Currencies System! Elevate your trading game with the Trend Screener, the revolutionary trend indicator designed to transform your Metatrader into a powerful Trend Analyzer. This comprehensive tool leverages fuzzy logic and integrates over 13 premium features and three trading strategies, offering unmatched precision and versatility. LIMITED TIME OFFER : Tre
How many times have you bought a trading indicator with great back-tests, live account performance proof with fantastic numbers and stats all over the place but after using it, you end up blowing your account? You shouldn't trust a signal by itself, you need to know why it appeared in the first place, and that's what RelicusRoad Pro does best! User Manual + Strategies + Training Videos + Private Group with VIP Access + Mobile Version Available A New Way To Look At The Market RelicusRoad is the
Gold Stuff mt5
Vasiliy Strukov
4.92 (189)
Gold Stuff mt5 is a trend indicator designed specifically for gold and can also be used on any financial instrument. The indicator does not redraw and does not lag. Recommended time frame H1. Contact me immediately after the purchase to get   personal bonus!  You can get a free copy of our Strong Support and Trend Scanner indicator, please pm. me! Settings  and manual   here  Please note that I do not sell my EA's or special sets on telegram, it is only available on Mql5 and my set files are on
***  Entry In The Zone and SMC Multi Timeframe is a real-time market analysis tool developed based on the Smart Money Concepts (SMC) framework. It automatically analyzes reversal points and key zones across multiple timeframes, emphasizing No Repaint signals and highlighting Points of Interest (POI) .It also features an Auto Fibonacci Level System that automatically draws Fibonacci lines to help detect pullbacks and reversal points instantly. Most importantly, the signals help identify potentia
Grabber System MT5
Ihor Otkydach
5 (15)
Let me introduce you to an excellent technical indicator – Grabber, which works as a ready-to-use "All-Inclusive" trading strategy. Within a single code, it integrates powerful tools for technical market analysis, trading signals (arrows), alert functions, and push notifications. Every buyer of this indicator also receives the following for free: Grabber Utility for automatic management of open orders Step-by-step video guide: how to install, configure, and trade with the indicator Custom set fi
Trend indicator AI mt5
Ramil Minniakhmetov
5 (11)
Trend Ai indicator  mt5 is great tool that will enhance a trader’s market analysis by combining trend identification with actionable entry points and reversal alerts.  This indicator empowers users to navigate the complexities of the forex market with confidence and precision Beyond the primary signals, Trend Ai indicator identifies secondary entry points that arise during pullbacks or retracements, enabling traders to capitalize on price corrections within the established trend. Important Advan
Algo Pumping
Ihor Otkydach
4.74 (19)
PUMPING STATION – Your Personal All-inclusive strategy Introducing PUMPING STATION — a revolutionary Forex indicator that will transform your trading into an exciting and effective activity! This indicator is not just an assistant but a full-fledged trading system with powerful algorithms that will help you start trading more stable! When you purchase this product, you also get FOR FREE: Exclusive Set Files: For automatic setup and maximum performance. Step-by-step video manual: Learn how to tr
TPSproTREND PrO MT5
Roman Podpora
4.72 (18)
Entry points at the bar close,  without redrawing .  Trend scanner  across all assets,  MTF - mode  and much more in one tool. We recommend using it together with   RFI LEVELS. ИНСТРУКЦИЯ RUS   /   INSTRUCTIONS  ENG         /         VERSION MT4   Main functions: Accurate entry signals WITHOUT REPAINTING! Once a signal appears, it remains valid! This is a significant distinction from repainting indicators that might provide a signal and then alter it, potentially leading to deposit losses. Now,
TPSpro RFI Levels MT5
Roman Podpora
4.53 (19)
Reversal zones - levels / Active zones of a major player INSTRUCTIONS RUS   /   INSTRUCTIONS   ENG   /   Version MT4 EVERY BUYER OF THIS INDICATOR       GET ADDITIONALLY   FOR FREE   : 3 months       access to trading signals from the service       RFI SIGNALS       — ready-made entry points according to the TPSproSYSTEM algorithm. 3 months       access to training materials with regular updates - immersion in strategy and professional growth. 24/5 support on weekdays and access to a closed tra
FX Volume MT5
Daniel Stein
4.84 (19)
FX Volume: Experience Genuine Market Sentiment from a Broker’s Perspective Quick Overview Looking to elevate your trading approach? FX Volume provides real-time insights into how retail traders and brokers are positioned—long before delayed reports like the COT. Whether you’re aiming for consistent gains or simply want a deeper edge in the markets, FX Volume helps you spot major imbalances, confirm breakouts, and refine your risk management. Get started now and see how genuine volume data can
Matrix Arrow Indicator MT5
Juvenille Emperor Limited
5 (16)
Matrix Arrow Indicator MT5  is a unique 10 in 1 trend following   100% non-repainting  multi-timeframe indicator that can be used on all symbols/instruments:   forex,   commodities,   cryptocurrencies,   indices,   stocks .  Matrix Arrow Indicator MT5  will determine the current trend at its early stages, gathering information and data from up to 10 standard indicators, which are: Average Directional Movement Index (ADX) Commodity Channel Index (CCI) Classic Heiken Ashi candles Moving Average
AriX
Temirlan Kdyrkhan
1 (2)
AriX Indicator for MT5 A powerful trend-following and signal-evaluation tool AriX is a custom MT5 indicator that combines Moving Averages and ATR-based risk/reward logic to generate clear buy/sell signals. It visualizes dynamic SL/TP levels, evaluates past trade outcomes, and displays win/loss statistics in a clean on-chart panel. Key features include: Buy/Sell signals based on MA crossovers ATR-based SL/TP1/TP2/TP3 levels with visual lines and labels Signal outcome tracking with real-time stat
Atbot
Zaha Feiz
4.67 (51)
ATbot : How It Works and How to Use It How It Works The "AtBot" indicator for the MT5 platform generates buy and sell signals using a combination of technical analysis tools. It integrates Simple Moving Average (SMA), Exponential Moving Average (EMA), and the Average True Range (ATR) index to identify trading opportunities. Additionally, it can utilize Heikin Ashi candles to enhance signal accuracy. MQL Channel    Leave a massage after purchase and receive a special bonus gift. Key Features: ⦁
First of all Its worth emphasizing here that this Trading System is Non-Repainting   , Non Redrawing and Non Lagging Indicator Which makes it ideal from both manual and robot trading .  Online course, manual and download presets. The Smart Trend Trading System MT5 is a comprehensive trading solution tailored for new and experienced traders . It combines over 10 premium indicators and features more than 7 robust trading strategies , making it a versatile choice for diverse market conditions . Tre
Quantum TrendPulse
Bogdan Ion Puscasu
5 (16)
Introducing Quantum TrendPulse , the ultimate trading tool that combines the power of SuperTrend , RSI , and Stochastic into one comprehensive indicator to maximize your trading potential. Designed for traders who seek precision and efficiency, this indicator helps you identify market trends, momentum shifts, and optimal entry and exit points with confidence. Key Features: SuperTrend Integration: Easily follow the prevailing market trend and ride the wave of profitability. RSI Precision: Detect
Gold Entry Sniper
Tahir Mehmood
5 (1)
Gold Entry Sniper – Professional Multi-Timeframe ATR Dashboard for Gold Scalping & Swing Trading Gold Entry Sniper is a cutting-edge MetaTrader 5 indicator designed to give traders precise buy/sell signals for XAUUSD and other symbols, powered by ATR Trailing Stop logic and a multi-timeframe analysis dashboard . Built for both scalpers and swing traders, it combines real-time market direction , dynamic stop levels , and professional visual dashboards to help you identify high-probability gold en
Special offer : ALL TOOLS , just $35 each! New tools   will be   $30   for the   first week   or the   first 3 purchases !  Trading Tools Channel on MQL5 : Join my MQL5 channel to update the latest news from me This indicator plots breakout detection zones, referred to as “Smart Breakout Channels”, which are based on volatility-normalized price movement. These zones are shown as dynamic boxes with volume overlays. The tool detects temporary accumulation or distribution ranges using a custom nor
BUY INDICATOR AND GET NEW EXCLUSIVE EA FOR FREE AS A BONUS! ITALO ARROWS INDICATOR  is the best reversal indicator ever created, and why is that? Using extreme reversal zones on the market to show the arrows and Fibonacci numbers for the Take Profit, also with a panel showing all the information about the signals on the chart, the Indicator works on all time-frames and assets, indicator built after 8 years of experience on forex and many other markets. You know many reversal indicators around t
FX Levels MT5
Daniel Stein
5 (7)
FX Levels: Exceptionally Accurate Support & Resistance for All Markets Quick Overview Looking for a reliable way to pinpoint support and resistance levels across any market—currencies, indices, stocks, or commodities? FX Levels merges our traditional “Lighthouse” method with a forward-thinking dynamic approach, offering near-universal accuracy. By drawing from real-world broker experience and automated daily plus real-time updates, FX Levels helps you identify reversal points, set profit targe
Support And Resistance Screener Breakthrough unique Solution With All Important levels analyzer and Markets Structures Feature Built Inside One Tool ! Our indicator has been developed by traders for traders and with one Indicator you will find all Imporant market levels with one click. LIMITED TIME OFFER : Support and Resistance Screener Indicator is available for only 50 $ and lifetime. ( Original price 125$ ) (offer extended) The available tools ( Features ) in our Indicator are :  1. HH-LL S
FX Power MT5 NG
Daniel Stein
5 (20)
FX Power: Analyze Currency Strength for Smarter Trading Decisions Overview FX Power is your go-to tool for understanding the real strength of currencies and Gold in any market condition. By identifying strong currencies to buy and weak ones to sell, FX Power simplifies trading decisions and uncovers high-probability opportunities. Whether you’re looking to follow trends or anticipate reversals using extreme delta values, this tool adapts seamlessly to your trading style. Don’t just trade—trade
This dashboard shows the latest available   harmonic patterns   for the selected symbols, so you will save time and be more efficient /   MT4 version . Free Indicator:   Basic Harmonic Pattern Comparison of "Basic Harmonic Pattern" vs. "Basic Harmonic Patterns Dashboard" Indicators Feature Basic Harmonic Pattern Basic Harmonic Patterns Dashboard Functionality Detects and displays harmonic patterns on a single chart Searches multiple symbols and timeframes for harmonic patterns, displays res
First of all Its worth emphasizing here that this Trading Tool is Non Repainting , Non Redrawing and Non Lagging Indicator , Which makes it ideal for professional trading . Online course, user manual and demo. The Smart Price Action Concepts Indicator is a very powerful tool for both new and experienced traders . It packs more than 20 useful indicators into one , combining advanced trading ideas like Inner Circle Trader Analysis and Smart Money Concepts Trading Strategies . This indicator focus
MTF Supply Demand Zones MT5
Georgios Kalomoiropoulos
5 (1)
Next Generation Of Automated Supply And Demand Zones. New and Innovative Algorithm that Works At Any Chart. All Zones Are Being Created Dynamically According To Price Action Of The Market. AMAZING OFFER --> Activations from 5 to 20 for "MTF Supply Demand Zones" and "Automated Trendlines" TWO TYPES OF ALERTS -->  1) WHEN PRICE HITS A ZONE    2)WHEN A NEW ZONE IS FORMED  If you get the MTF Supply Demand Zones you can join the " Trade Like Me " Video Series. It contains 14 Live Sessions where 
The " Dynamic Scalper System MT5 " indicator is designed for the scalping method of trading within trend waves. Tested on major currency pairs and gold, compatibility with other trading instruments is possible. Provides signals for short-term opening of positions along the trend with additional price movement support. The principle of the indicator. Large arrows determine the trend direction. An algorithm for generating signals for scalping in the form of small arrows operates within trend wav
ARICoins
Temirlan Kdyrkhan
ARICoin is a powerful trading companion designed to generate high-probability entry signals with dynamic TP/SL/DP levels based on volatility. Built-in performance tracking shows win/loss stats, PP1/PP2 hits, and success rates all updated live. Key Features: Buy/Sell signals with adaptive volatility bands Real-time TP/SL/DP levels based on ATR Built-in MA Filter with optional ATR/StdDev volatility Performance stats panel (Success, Profit/Loss, PP1/PP2) Alerts via popup, sound, push, or email Cust
M1 Scalper Pro MT5
Elif Kaya
4.86 (7)
- Real price is 80$ - 45% Discount (It is 45$ now) Contact me for instruction, any questions! - Lifetime update free - Non-repaint - I just sell my products in Elif Kaya Profile, any other websites are stolen old versions, So no any new updates or support. Advantages of  M1 Scalper Pro  Profitability: M1 Scalper Pro is highly profitable with a strict exit strategy. Frequent Opportunities: M1 Scalper Pro  takes advantage of numerous small price changes. Minimal Market Risk: Limited exposure redu
ACB Breakout Arrows MT5
KEENBASE SOFTWARE SOLUTIONS
5 (1)
The ACB Breakout Arrows indicator provides a crucial entry signal in the market by detecting a special breakout pattern. The indicator constantly scans the chart for a settling momentum in one direction and provide the accurate entry signal right before the major move. Get multi-symbol and multi-timeframe scanner from here - Scanner for ACB Breakout Arrows MT 5 Key features Stoploss   and Take Profit levels are provided by the indicator. Comes with a MTF Scanner dashboard which tracks the brea
Integrated Dashboard Scanner
Krzysztof Janusz Stankiewic
Integrated Dashboard Scanner – Your Market Command Center (v3.0) Short Description Stop wasting time manually switching between dozens of charts. The   Integrated Dashboard Scanner   is a powerful multi-symbol, multi-timeframe scanner that keeps an eye on every instrument you select from a single panel. Featuring   six distinct analysis modules , including an Economic News Calendar and a professional-grade Momentum Scanner, version 3.0 is the most powerful and reliable release yet. Following a
More from author
Smart FVG (MT5) — Fair Value Gap Visualizer Summary Detect and visualize Fair Value Gaps (FVGs) with ATR-aware sensitivity and optional alerts. What it does Smart FVG identifies price ranges not overlapped by adjacent candles (FVGs) and displays them on the chart as bullish/bearish zones. Shading and colors are configurable. Optional alerts can notify you when new gaps appear or when existing gaps are filled. This is a visual analysis tool ; it does not execute trades. Key features Automatic
FREE
Smart FVG (MT5) — Fair Value Gap Visualizer Summary Detect and visualize Fair Value Gaps (FVGs) with ATR-aware sensitivity and optional alerts. What it does Smart FVG identifies price ranges not overlapped by adjacent candles (FVGs) and displays them on the chart as bullish/bearish zones. Shading and colors are configurable. Optional alerts can notify you when new gaps appear or when existing gaps are filled. This is a   visual analysis tool ; it does not execute trades. Key features Automati
FREE
Smart FVG (MT4) — Fair Value Gap Detect and visualize Fair Value Gaps (FVGs) with ATR-aware sensitivity and optional alerts. Smart FVG identifies price ranges not overlapped by adjacent candles (FVGs) and displays them on the chart as bullish/bearish zones. Shading and colors are configurable. Optional alerts can notify you when new gaps appear or when existing gaps are filled. This is a   visual analysis tool ; it does not execute trades. Key features Automatic FVG detection and clear chart an
FREE
Candle Movement Index (CMI) — Visual Candle Strength CMI evaluates each candle’s close vs. open and its intrabar range to assign a consistent color. This helps you read short-term momentum and pressure shifts at a glance. It is a visual aid for chart analysis and does not generate trading signals. Clear bullish/bearish coloring based on closing behavior. Visual sense of “strong vs. mild” movement through consistent coloring. Designed for a cleaner, easier-to-read chart. Notes CMI is for visualiz
Trend Checker MT5 (GammaTrend) — Smart Indicator for Trend & Trade Levels Summary Rule-based trend visualization with ATR-aware entries, adaptive stop-loss, and optional targets. What it does GammaTrend analyzes price action together with the Average True Range (ATR) and selected market-closure conditions to highlight trend direction, suggest potential entry zones, and compute indicative stop-loss and target levels. It is a visual analysis tool ; it does not execute trades. Key features Trend
Filter:
Khalid Albalushi
130
Khalid Albalushi 2025.09.09 17:44 
 

User didn't leave any comment to the rating

Ahmad Kazbar
11708
Reply from developer Ahmad Kazbar 2025.09.09 18:23
Thank you for the beautiful participation brother Khalid
zatami
42
zatami 2025.09.03 07:42 
 

Great tool you made Ahmad Kazbar. Its ability to show on different time frames is great. My only frustration is that whenever it's on the chart, a click on the chart moves the avwap start line to where I clicked. Though the way I solve this is to either change timeframes or remove the avwap or exit platform and come back on, I still feel you can do something about it unless I'm not doing something right. Please incorporate an option to hold the start line in place where it is without any shifting whenever I click any point in the chart. I know you may have done it that way for the purpose of one just selecting any point with a click, but there's need to give one an option to allow or not to allow because there are other tools I use which need clicking always. Thank you for this wonderful tool.

UPDATE: Thank you Ahmad Kazbar for replying me immediately. It shows indeed Developer Support to User is excellent.

I'm applying what you said in your reply by allowing the default look back (starting point) setting of 200 starting point candles. Then changing the starting point to the candle I want by double-clicking on the line and moving it. When I press again, the point does not move; only move when I press again twice. You're some genius. Well-done for helping with this Support and providing this awesome tool.

Ahmad Kazbar
11708
Reply from developer Ahmad Kazbar 2025.09.03 07:51
Thank you for your comment.
When adding the line indicator, the starting point is at 200 candles prior.
You can change the starting point to the candle you want by double-clicking on the line and moving it. When you press again, the point will not move unless you press again twice.
baik6211
66
baik6211 2025.09.02 03:45 
 

Very very very good

Ahmad Kazbar
11708
Reply from developer Ahmad Kazbar 2025.09.02 06:51
Thank you :)
Findolin
1489
Findolin 2025.08.14 13:23 
 

Ein exzellenter Indikator! Vielen Dank!

Ahmad Kazbar
11708
Reply from developer Ahmad Kazbar 2025.08.23 19:37
Thank you :)
Benjamin Afedzie
3091
Benjamin Afedzie 2025.07.02 22:15 
 

milking with product

Ahmad Kazbar
11708
Reply from developer Ahmad Kazbar 2025.08.23 19:38
thanks you :)
Rahul
20
Rahul 2025.07.02 15:50 
 

Hi brother, great plugin tool. Just sometimes it doesnt get disabled easily. Why do we need the disable and look options i dont get it. Also you can improve it by allowing multiple vwaps like the other person (https://www.mql5.com/en/market/product/106391) has made and that also allows easy adjusting without the two big buttons you have. He also allows adjusting the bands settings like we can make the standard deviation to Fib levels. Lastly, the blue line colour is too dark and it should not highlight the timestamp bec the dark blue does not show in our dark background theme. The highlight is unnecessary. The multiple vwaps tools and without the 2 big buttons, and adjustable points will make it perfect. Also, your standard deviation setting is different than the anchor vwap tool on tradingview, bec your first band is wider, it shows exactly on the corner of the swing high and lows, unlike the tradingview, so you need to show the exact setting for that ST band, bec it's great.

Cheers

juancamiloabreo
15
juancamiloabreo 2025.05.23 00:26 
 

User didn't leave any comment to the rating

Ahmad Kazbar
11708
Reply from developer Ahmad Kazbar 2025.07.21 09:43
A version will be made for Meta 4.
Kedrov
1019
Kedrov 2025.05.12 08:20 
 

Мне понравился! Спасибо!

Ahmad Kazbar
11708
Reply from developer Ahmad Kazbar 2025.07.21 09:45
thanks :)
Flaviona
134
Flaviona 2025.04.13 18:04 
 

User didn't leave any comment to the rating

Ahmad Kazbar
11708
Reply from developer Ahmad Kazbar 2025.07.21 09:43
thanks you :)
Andre des Etages
37
Andre des Etages 2025.02.27 18:55 
 

User didn't leave any comment to the rating

Ahmad Kazbar
11708
Reply from developer Ahmad Kazbar 2025.02.27 19:11
Thank you for the evaluation and participation
When using the VWAP, it must be fixed at a certain point, and the price deviation is calculated based on this point. In the future, I will work on updating or approximating the starting point every 200 candles (example) or more.
Reply to review