Anchored VWAP indicator
- Indicatori
- Versione: 2.1
- Aggiornato: 22 luglio 2026

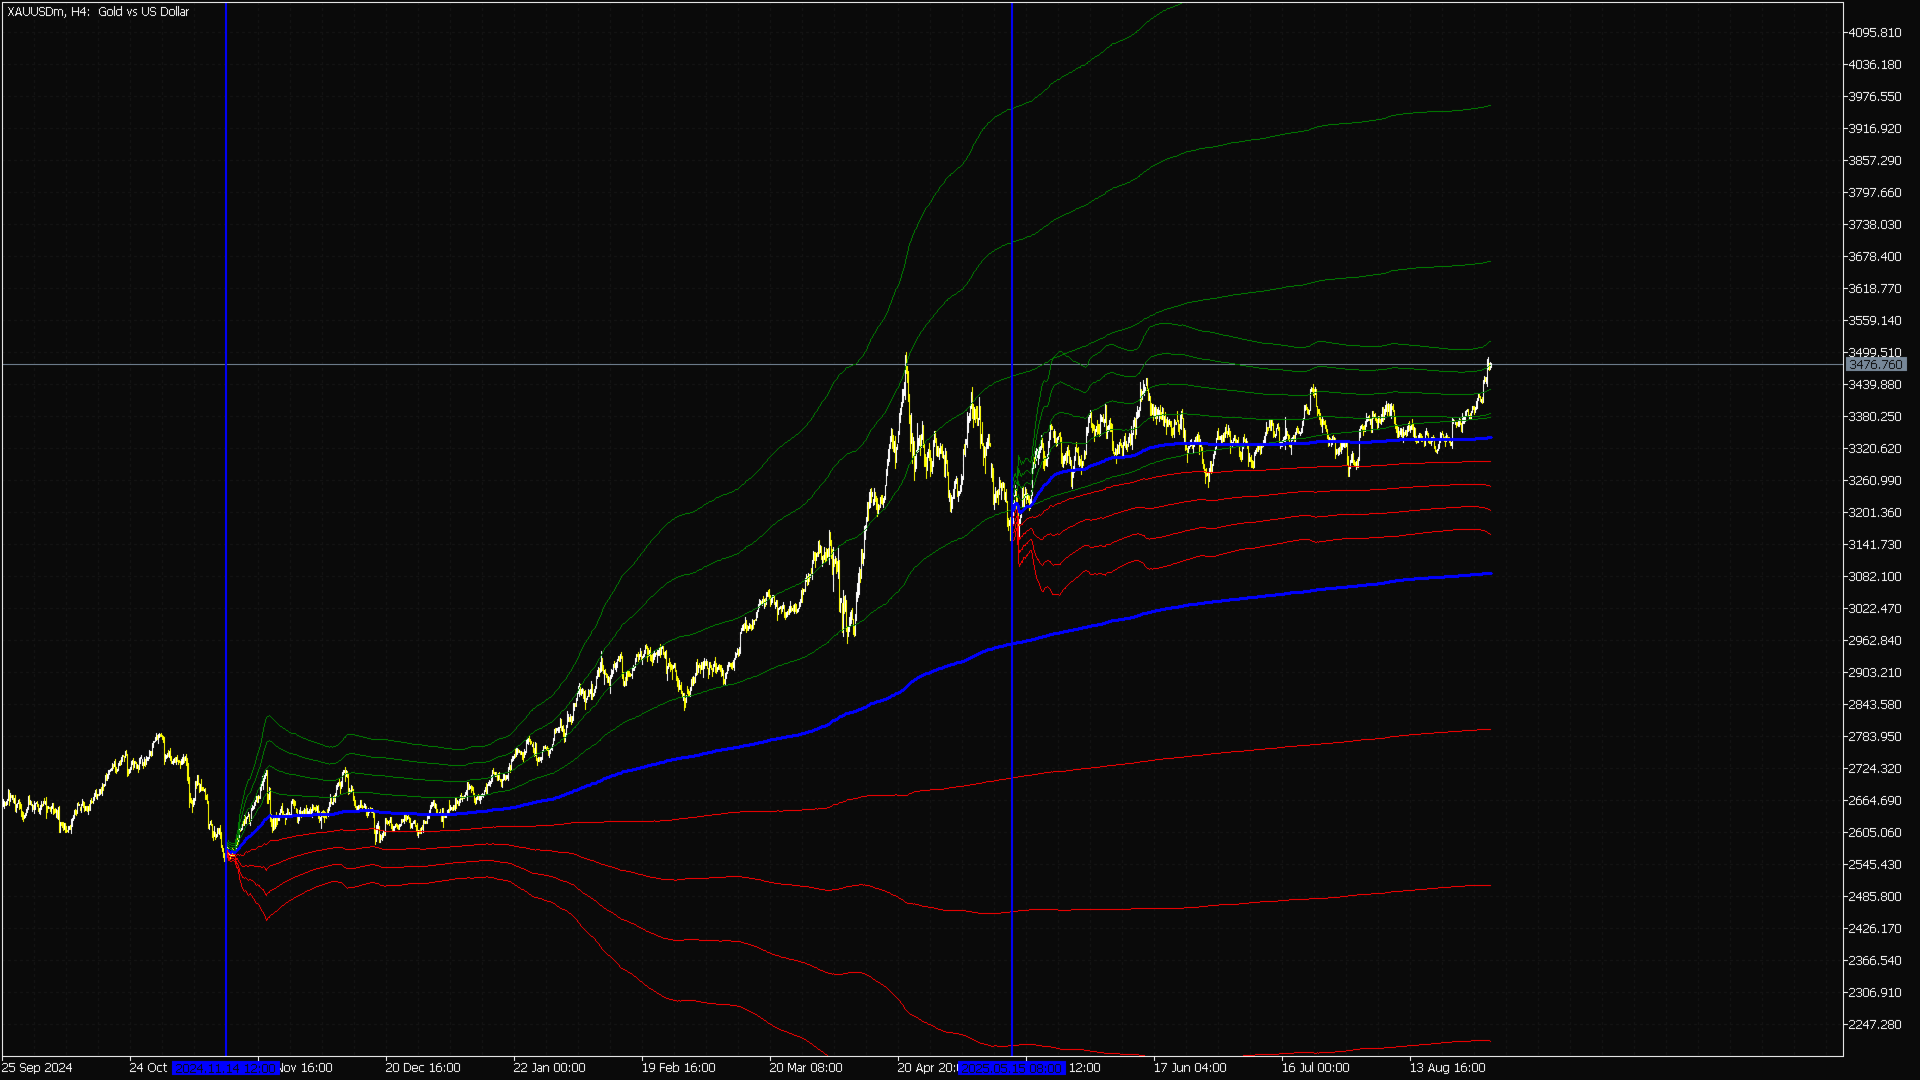
Indicatore Anchored VWAP MT5 — Prezzo Medio Ponderato per Volume Istituzionale
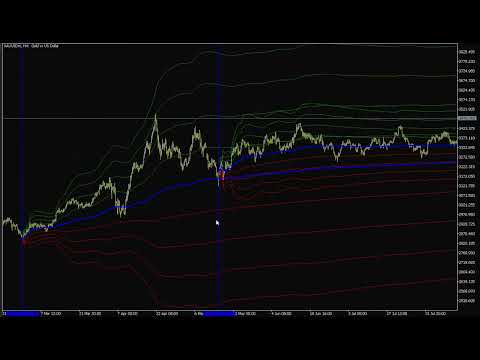
Sblocca l'analisi di mercato di livello istituzionale con l'Indicatore Anchored VWAP per MetaTrader 5. Mentre gli indicatori VWAP standard forzano un rigido reset giornaliero, questo strumento professionale ti offre un'assoluta libertà: ancora il Prezzo Medio Ponderato per Volume a qualsiasi candela specifica, massimo/minimo, evento macroeconomico o cambio di sessione.
Tracciando esattamente dove si concentra il pesante volume istituzionale a partire dal punto di inizio scelto, otterrai una visione trasparente del vero valore di mercato, supporti/resistenze dinamici e flusso di ordini liquidi.
Perché questo Anchored VWAP supera la concorrenza
- Ancoraggio interattivo istantaneo: Dimentica le noiose modifiche alle impostazioni. Basta fare un Doppio Click su qualsiasi candela direttamente sul grafico per agganciare istantaneamente l'ancora del VWAP in quel punto esatto.
- Blocco intelligente dell'ancora: Una volta posizionato, blocca il punto di ancoraggio per evitare spostamenti accidentali durante il trascinamento del grafico o il cambio di timeframe.
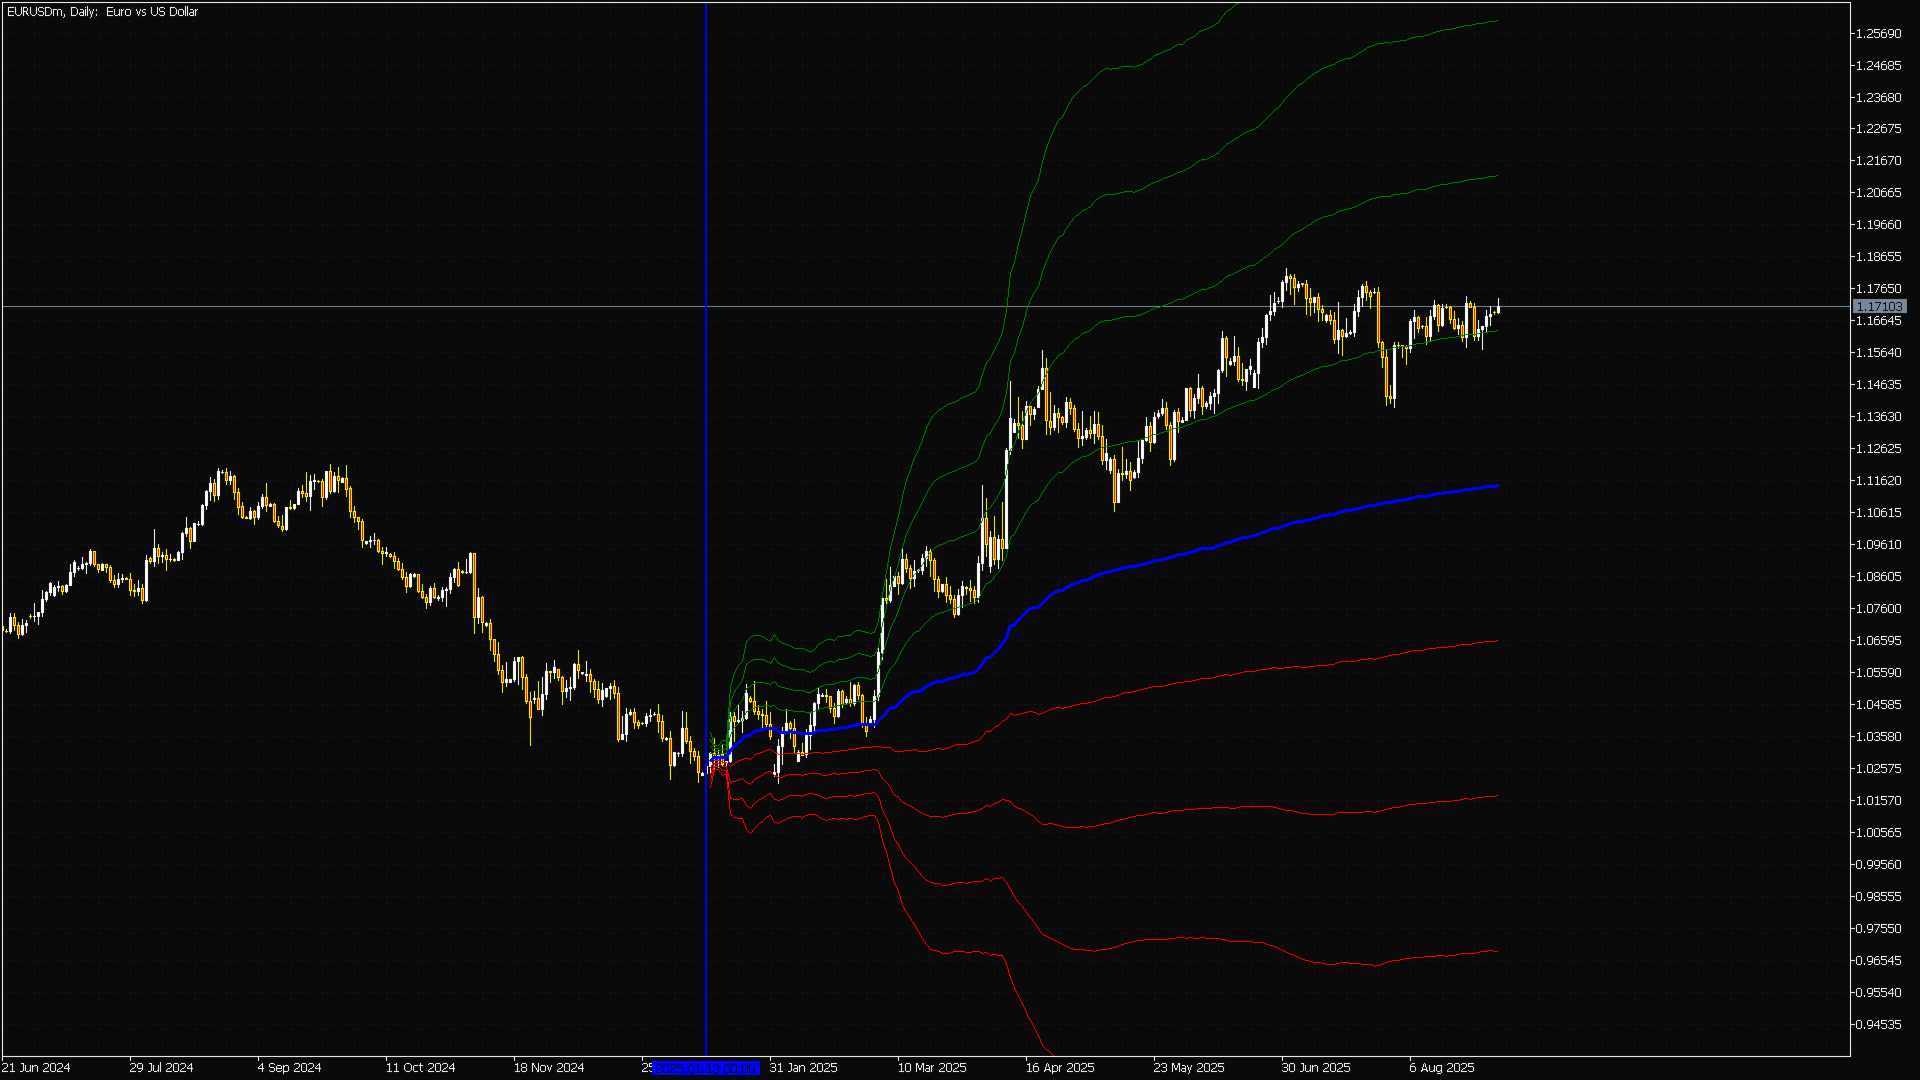
- Bande di deviazione standard dinamiche: Bande moltiplicatrici integrate e completamente personalizzabili (es. +1, +2, -1, -2) per mappare le zone di ipercomprato/ipervenduto e i canali di volatilità.
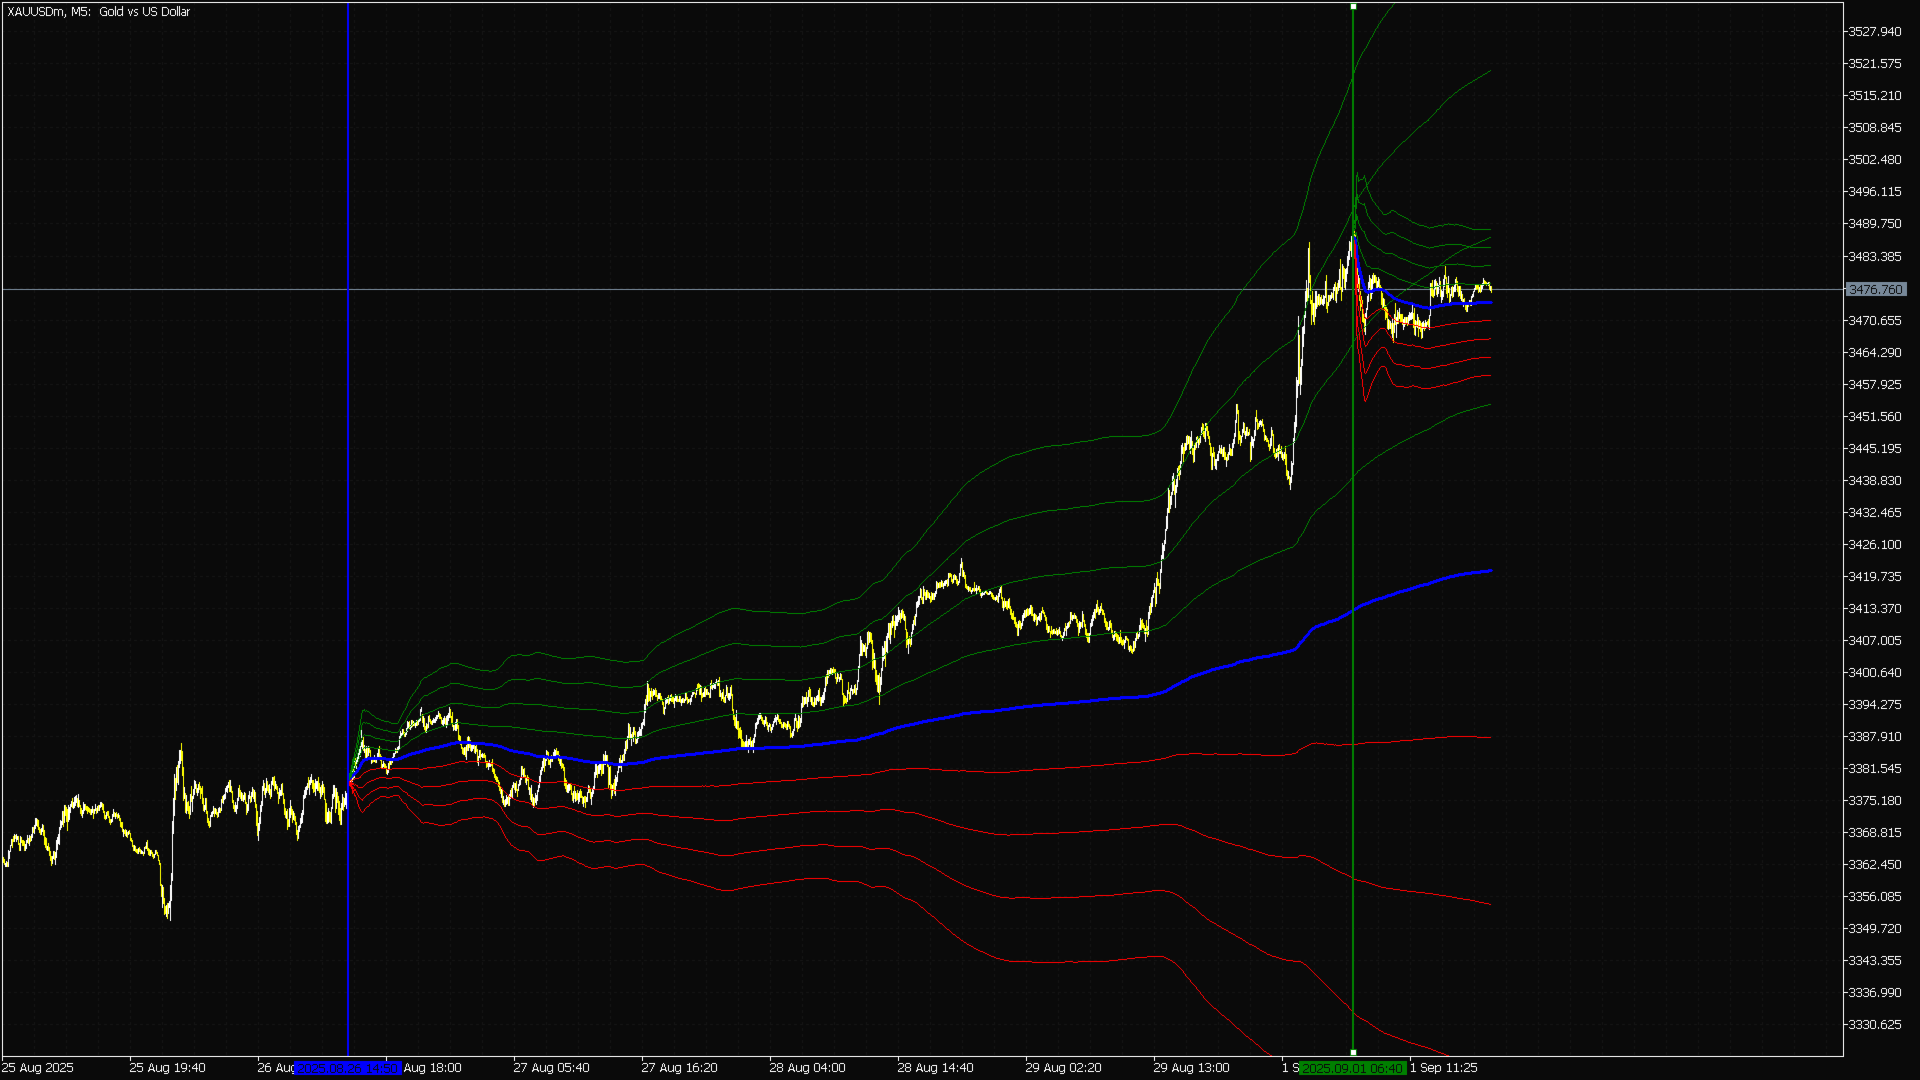
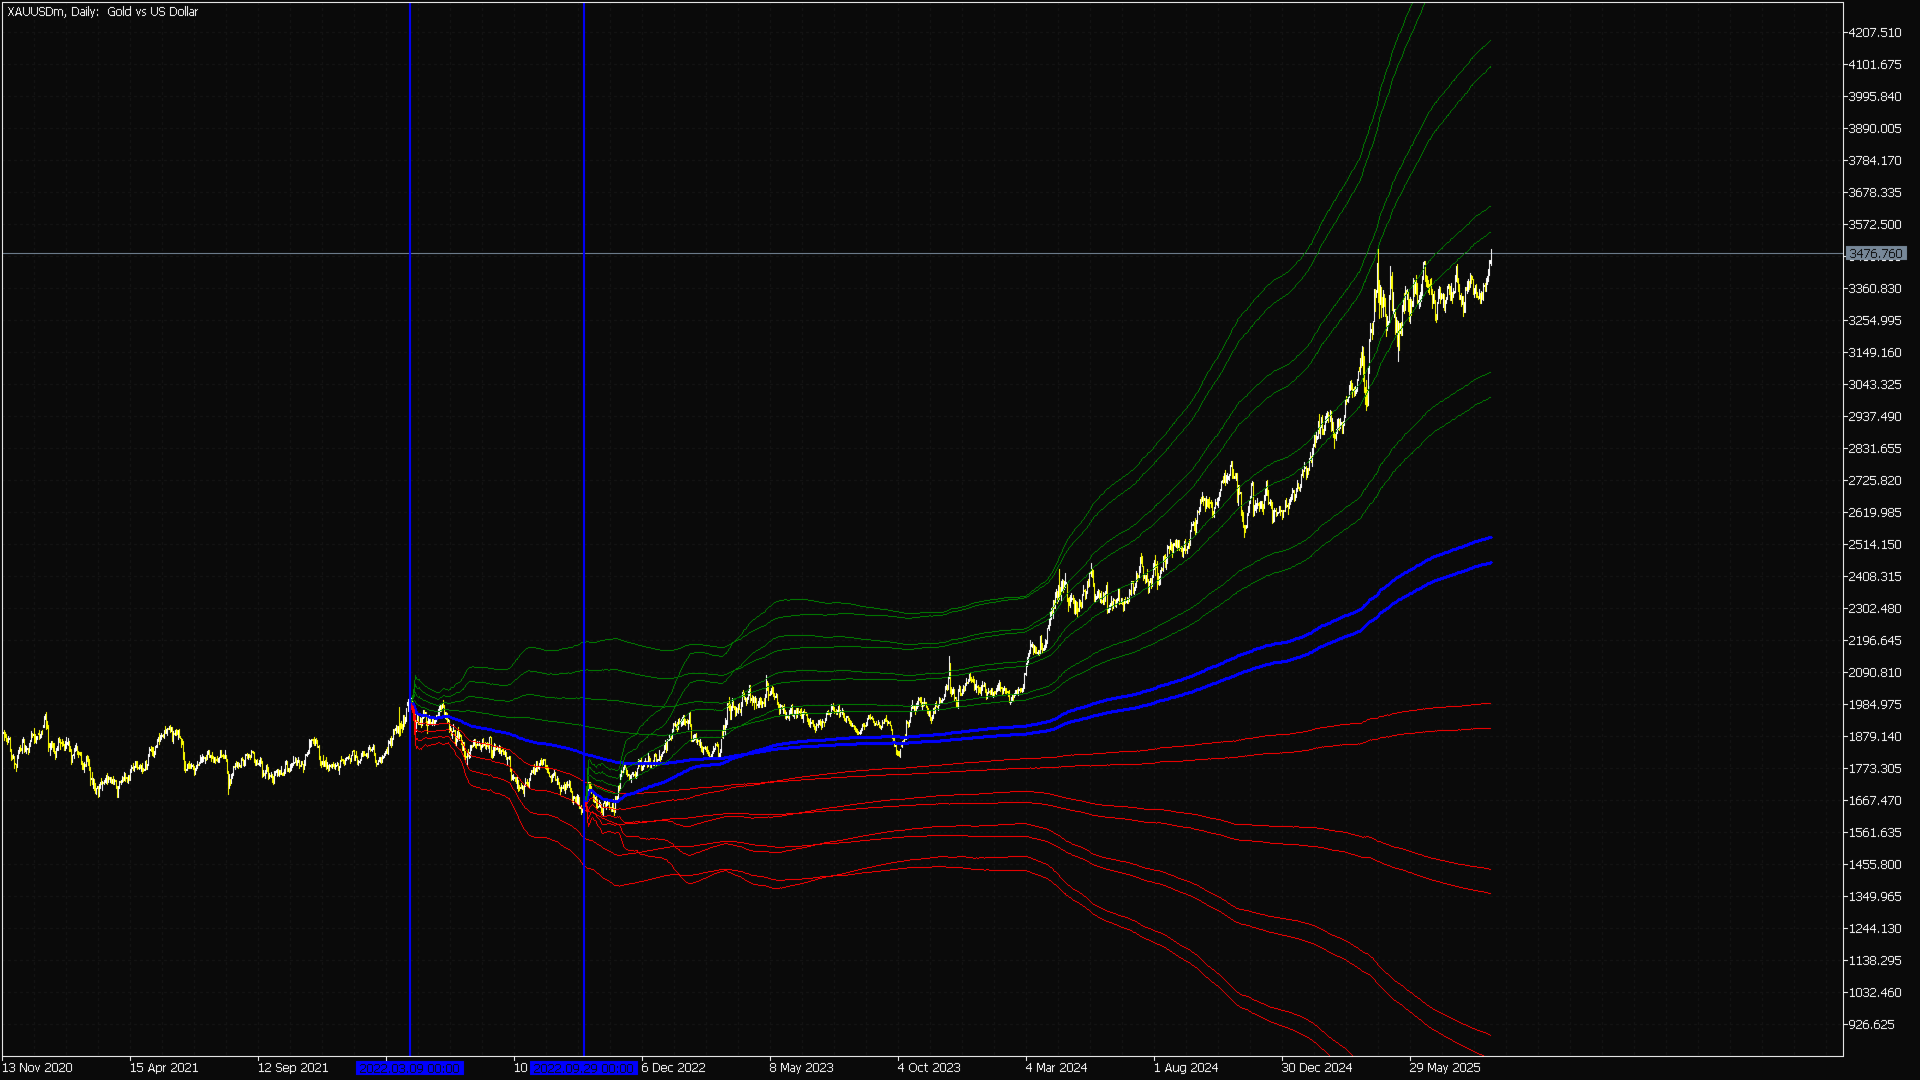
- Sincronizzazione multi-timeframe: Prestazioni impeccabili su tutti i grafici, da M1 per lo scalping fino al Daily/Weekly per il swing trading.
- Leggero e ad alte prestazioni: Zero lag. Il codice sorgente è altamente ottimizzato per garantire un rendering fluido e un utilizzo minimo della CPU, anche quando viene eseguito su più grafici contemporaneamente.
Applicazioni di trading professionale
- Allineamento con i livelli istituzionali: Allinea i tuoi ingressi con gli algoritmi delle grandi banche ancorando il prezzo dai principali massimi/minimi o dal rilascio dei tassi di interesse.
- Analisi accurata di accumulazione e distribuzione: Individua dove lo "smart money" sta accumulando posizioni osservando come il prezzo reagisce alla linea principale del VWAP.
- Scoperta del vero Fair Value: Utilizza le bande di deviazione come linee di supporto e resistenza dinamiche supportate dai volumi, invece di indicatori matematici ritardati.
Specifiche tecniche e impostazioni
- Modalità di selezione dell'ancora: Doppio click interattivo sul grafico o inserimento manuale di data e ora.
- Sorgente di calcolo: Scegli tra prezzo di Chiusura (Close), Tipico (Typical), Mediano (Median) o Ponderato (Weighted).
- Personalizzazione delle bande: Abilita/Disabilita fino a 3 bande di deviazione standard personalizzate con proprietà indipendenti di colore, spessore e stile di linea.
- Pronto per EA (Expert Advisor Friendly): I buffer di output sono completamente esposti, rendendo immediata l'integrazione nei tuoi Expert Advisor (EA) per il trading algoritmico automatizzato.
Aumenta il tuo vantaggio competitivo: Smetti di fare trading alla cieca. Dota il tuo terminale MetaTrader 5 del miglior strumento di ancoraggio volumetrico e fai trading a fianco delle mani forti.
Include aggiornamenti gratuiti a vita e supporto dedicato dello sviluppatore.


I haven't needed support yet, so I haven't rated it for now!. The indicator has helped me clarify the market picture a lot.
Thanks for sharing! And one more thing: if the indicator sent a signal when the price returns to the blue line, I think it would be PERFECT! I'm sure you can do it (for a fee, of course). Thanks again!