Anchored VWAP indicator
- Göstergeler
- Sürüm: 2.1
- Güncellendi: 22 Temmuz 2026

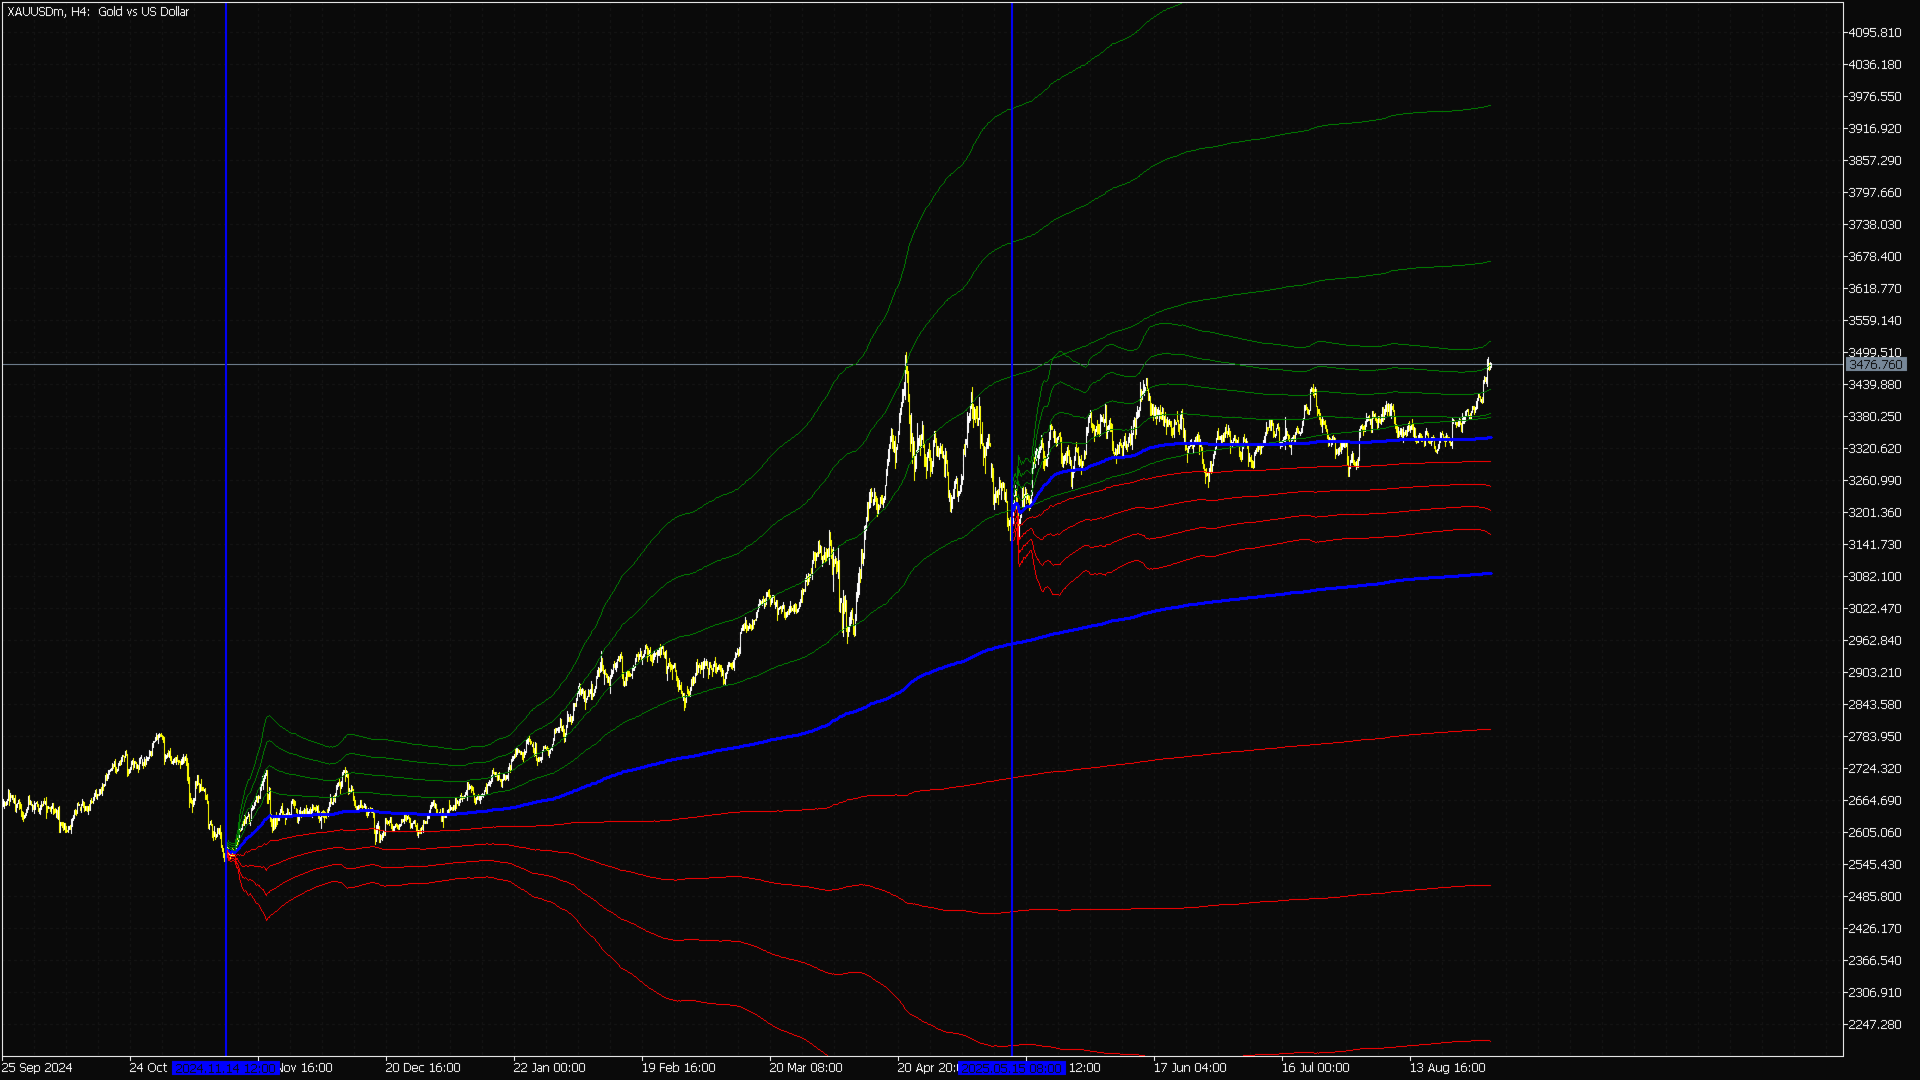
Anchored VWAP Indikatörü MT5 — Kurumsal Hacim Ağırlıklı Ortalama Fiyat
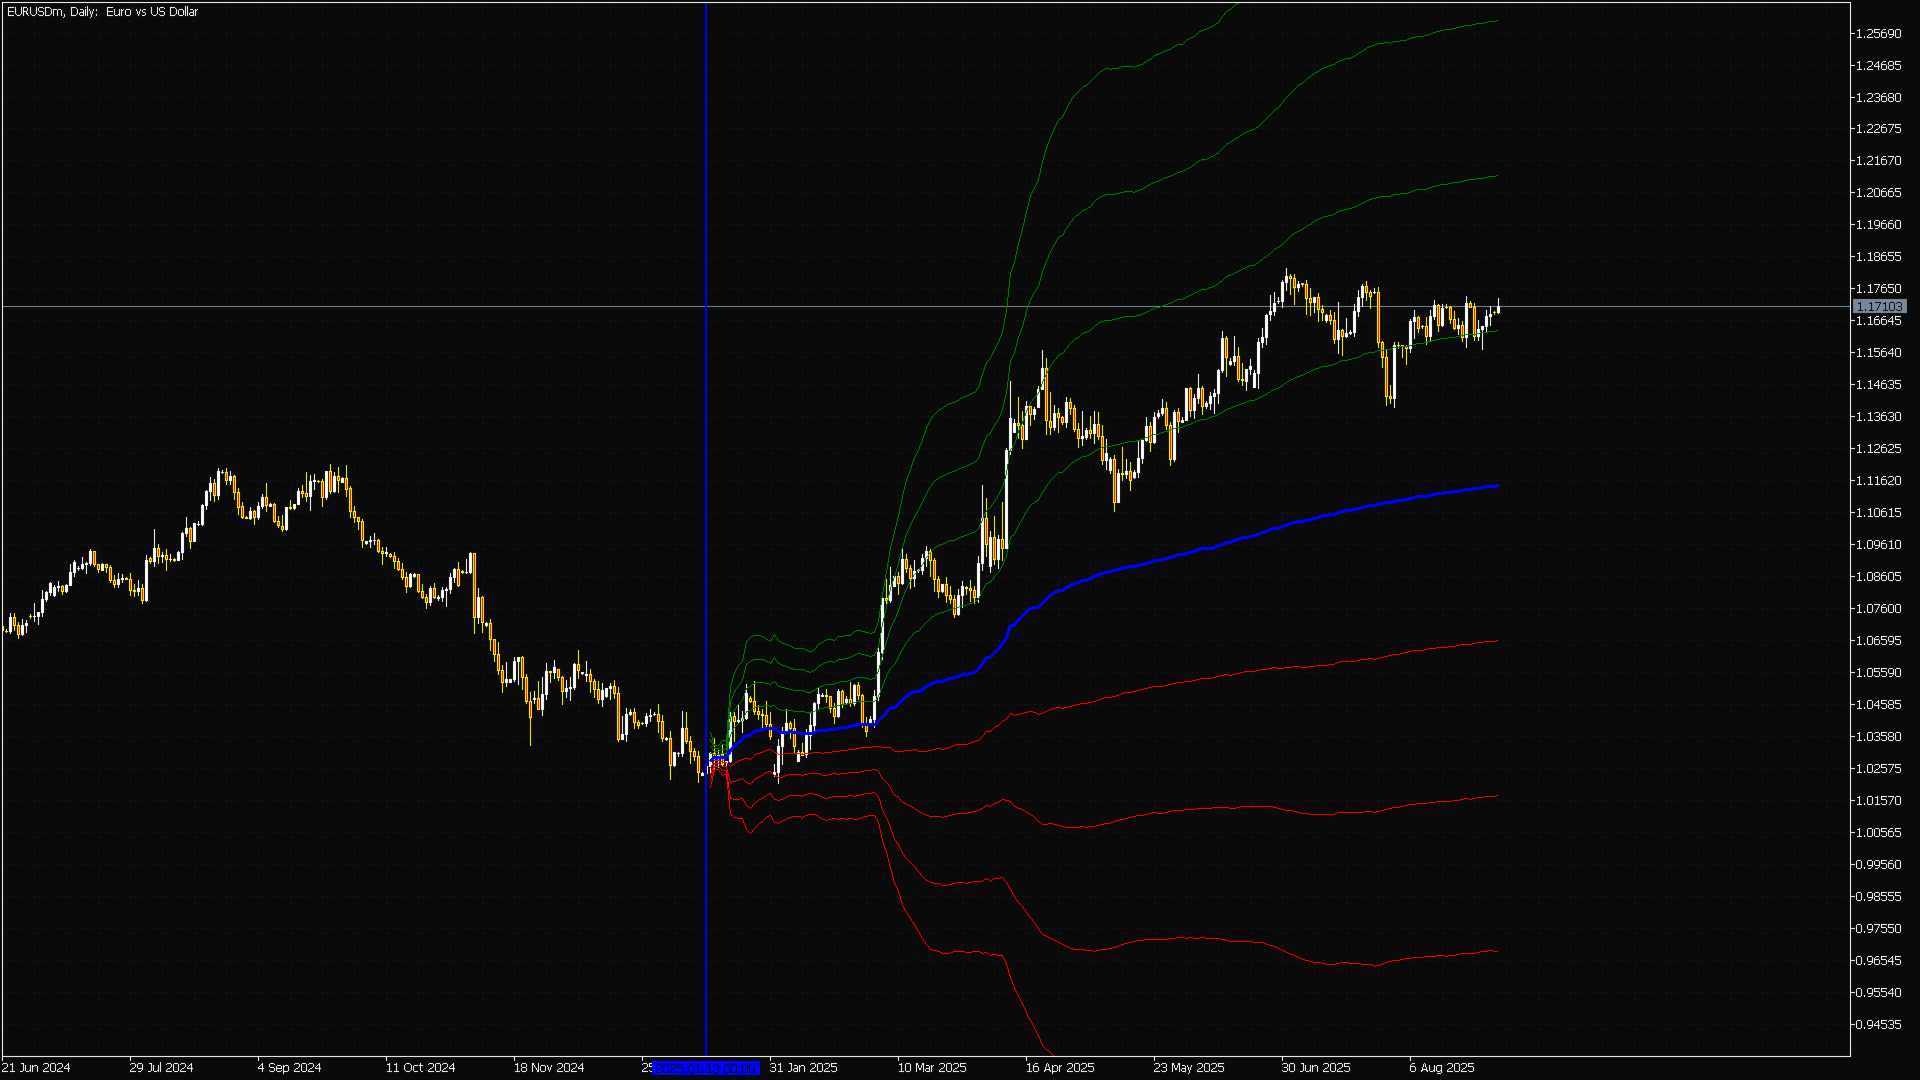
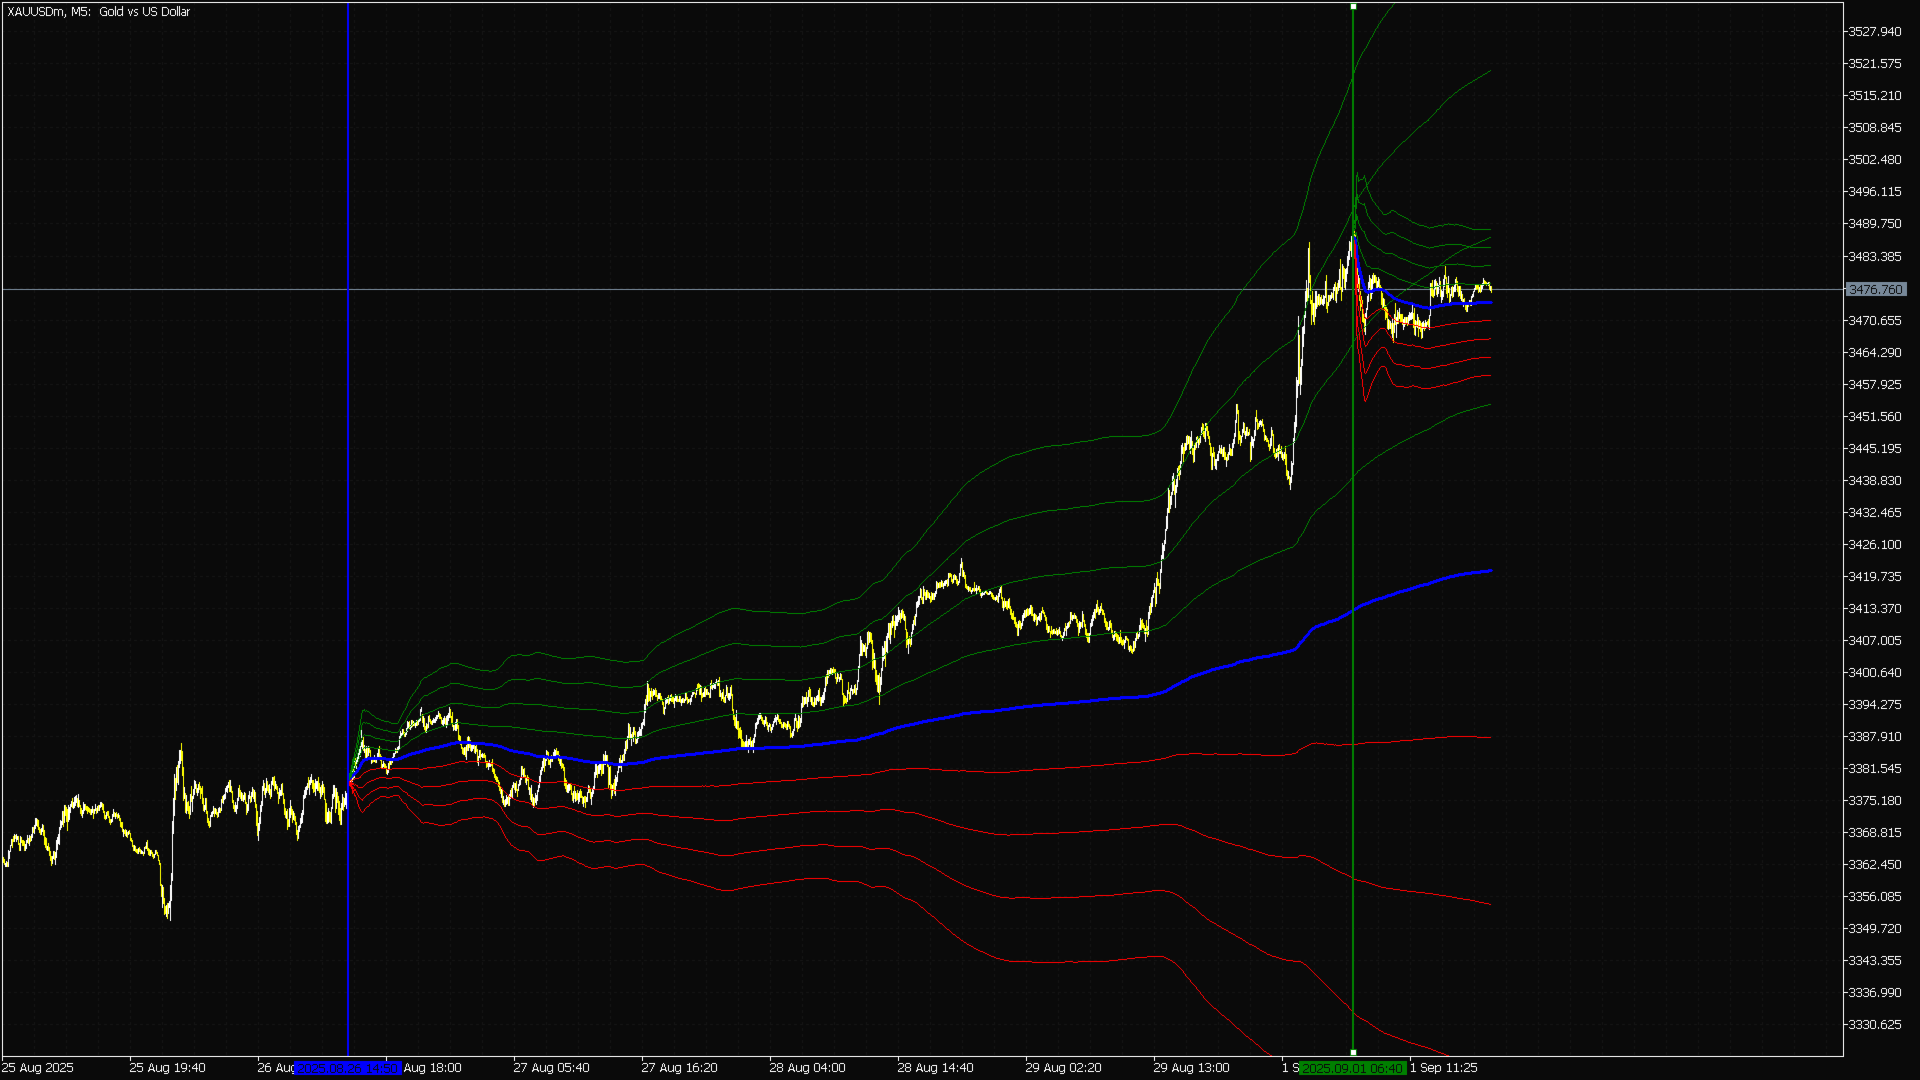
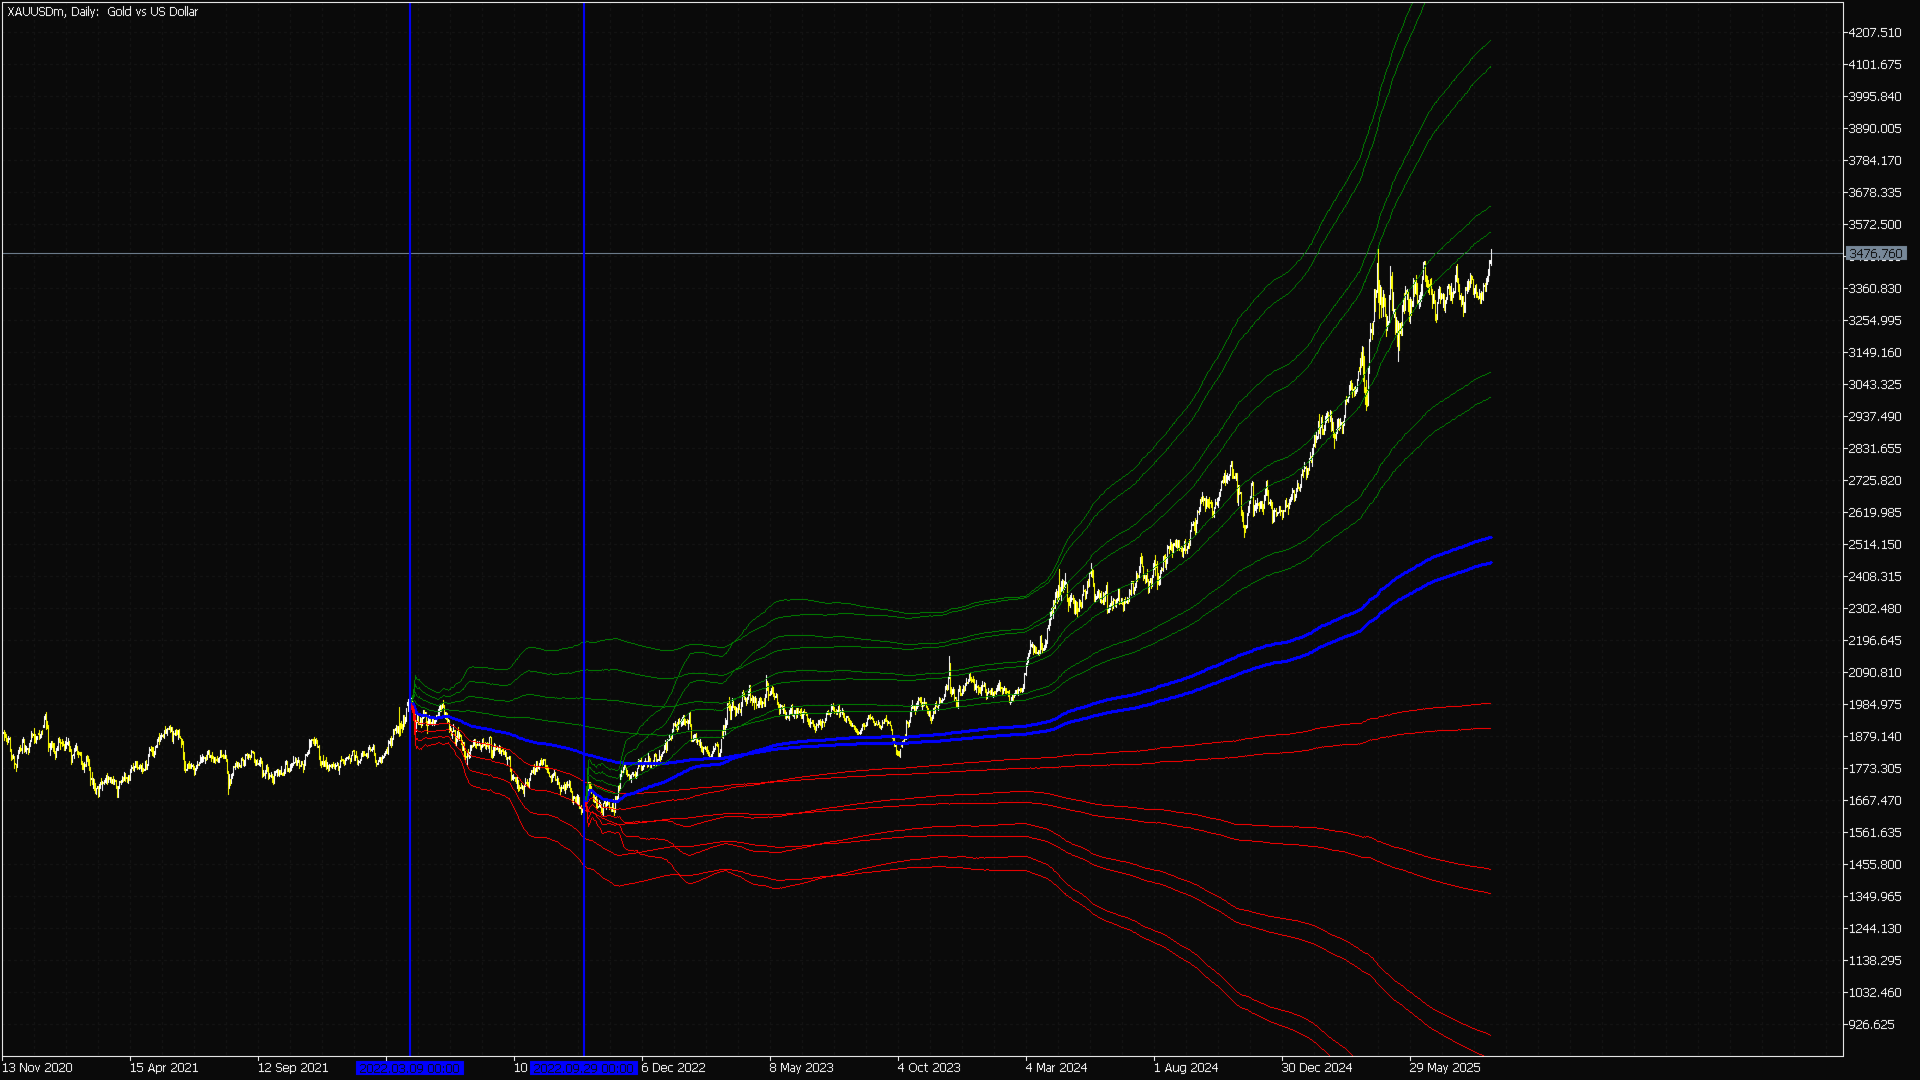
MetaTrader 5 için Anchored VWAP İndikatörü ile kurumsal düzeyde piyasa analizinin kapılarını açın. Standart VWAP indikatörleri her gün sert bir sıfırlamaya zorlarken, bu profesyonel araç size mutlak özgürlük sunar: Hacim Ağırlıklı Ortalama Fiyatı herhangi bir belirli muma, en yüksek/en düşük seviyeye, haber dalgalanmasına veya seans açılışına sabitleyebilirsiniz.
Büyük kurumsal hacmin seçtiğiniz başlangıç noktasından itibaren tam olarak nerede yoğunlaştığını takip ederek, gerçek piyasa değerini, dinamik destek/direnç seviyelerini ve likidite emir akışını en net haliyle görürsünüz.
Bu Anchored VWAP Neden Diğerlerinden Daha Üstün?
- Anlık Etkileşimli Sabitleme: Sıkıcı ayar değişikliklerini unutun. Grafik üzerindeki herhangi bir muma doğrudan Çift Tıklayarak VWAP çıpasını anında o noktaya yerleştirebilirsiniz.
- Akıllı Çıpa Kilitleme: Konumu belirledikten sonra, grafiği sürüklerken veya zaman dilimlerini değiştirirken yanlışlıkla kaymasını önlemek için sabitleme noktasını kilitleyin.
- Dinamik Standart Sapma Bantları: Aşırı alım/aşırı satım likidite bölgelerini ve oynaklık kanallarını haritalandırmak için yerleşik, tamamen özelleştirilebilir çarpan bantları (+1, +2, -1, -2 gibi).
- Çoklu Zaman Dilimi Senkronizasyonu: Scalping için M1'den, swing ticaret için Günlük/Haftalık grafiklere kadar tüm periyotlarda kusursuz performans.
- Hafif ve Yüksek Performanslı: Sıfır gecikme. Kaynak kodu, aynı anda birden fazla grafikte çalışırken bile akıcı veri işleme ve minimum CPU kullanımı sağlamak için optimize edilmiştir.
Profesyonel Ticari Uygulamalar
- Kurumsal Seviye Tespiti: Önemli swing zirve/dip seviyelerinden veya merkez bankası faiz kararlarından itibaren sabitleme yaparak işlemlerinizi büyük banka algoritmalarıyla hizalayın.
- Doğru Akümülasyon & Dağıtım Analizi: Fiyatın VWAP ana çizgisine nasıl tepki verdiğini izleyerek akıllı paranın nerede pozisyon topladığını tespit edin.
- Gerçek Adil Değer Keşfi: Gecikmeli matematiksel indikatörler yerine, hacim destekli dinamik destek ve direnç hatları olarak sapma bantlarını kullanın.
Geliştirici Özellikleri & Ayarlar
- Çıpa Seçim Modu: Etkileşimli grafik üzerinde çift tıklama veya manuel tarih/saat girişi.
- Hesaplama Kaynağı: Kapanış (Close), Tipik (Typical), Medyan (Median) veya Ağırlıklı (Weighted) fiyat seçenekleri.
- Bant Özelleştirme: Bağımsız renk, genişlik ve stil özelliklerine sahip 3 adede kadar özel standart sapma bandını etkinleştirin veya devre dışı bırakın.
- EA Uyumlu (Expert Advisor Ready): Çıkış tamponları (buffers) tamamen dışa aktarılmıştır; böylece algoritmik ticaret için indikatörü Uzman Danışmanlarınıza (EA) sorunsuz bir şekilde entegre edebilirsiniz.
Avantajınızı Artırın: Kör noktalarla işlem yapmayı bırakın. MetaTrader 5 terminalinizi nihai hacim profili çıpasıyla donatın ve büyük oyuncularla aynı yönde işlem yapın.
Ücretsiz ömür boyu güncellemeler ve kesintisiz geliştirici desteği dahildir.


I haven't needed support yet, so I haven't rated it for now!. The indicator has helped me clarify the market picture a lot.
Thanks for sharing! And one more thing: if the indicator sent a signal when the price returns to the blue line, I think it would be PERFECT! I'm sure you can do it (for a fee, of course). Thanks again!