Anchored VWAP indicator
- Indicateurs
- Version: 2.1
- Mise à jour: 22 juillet 2026

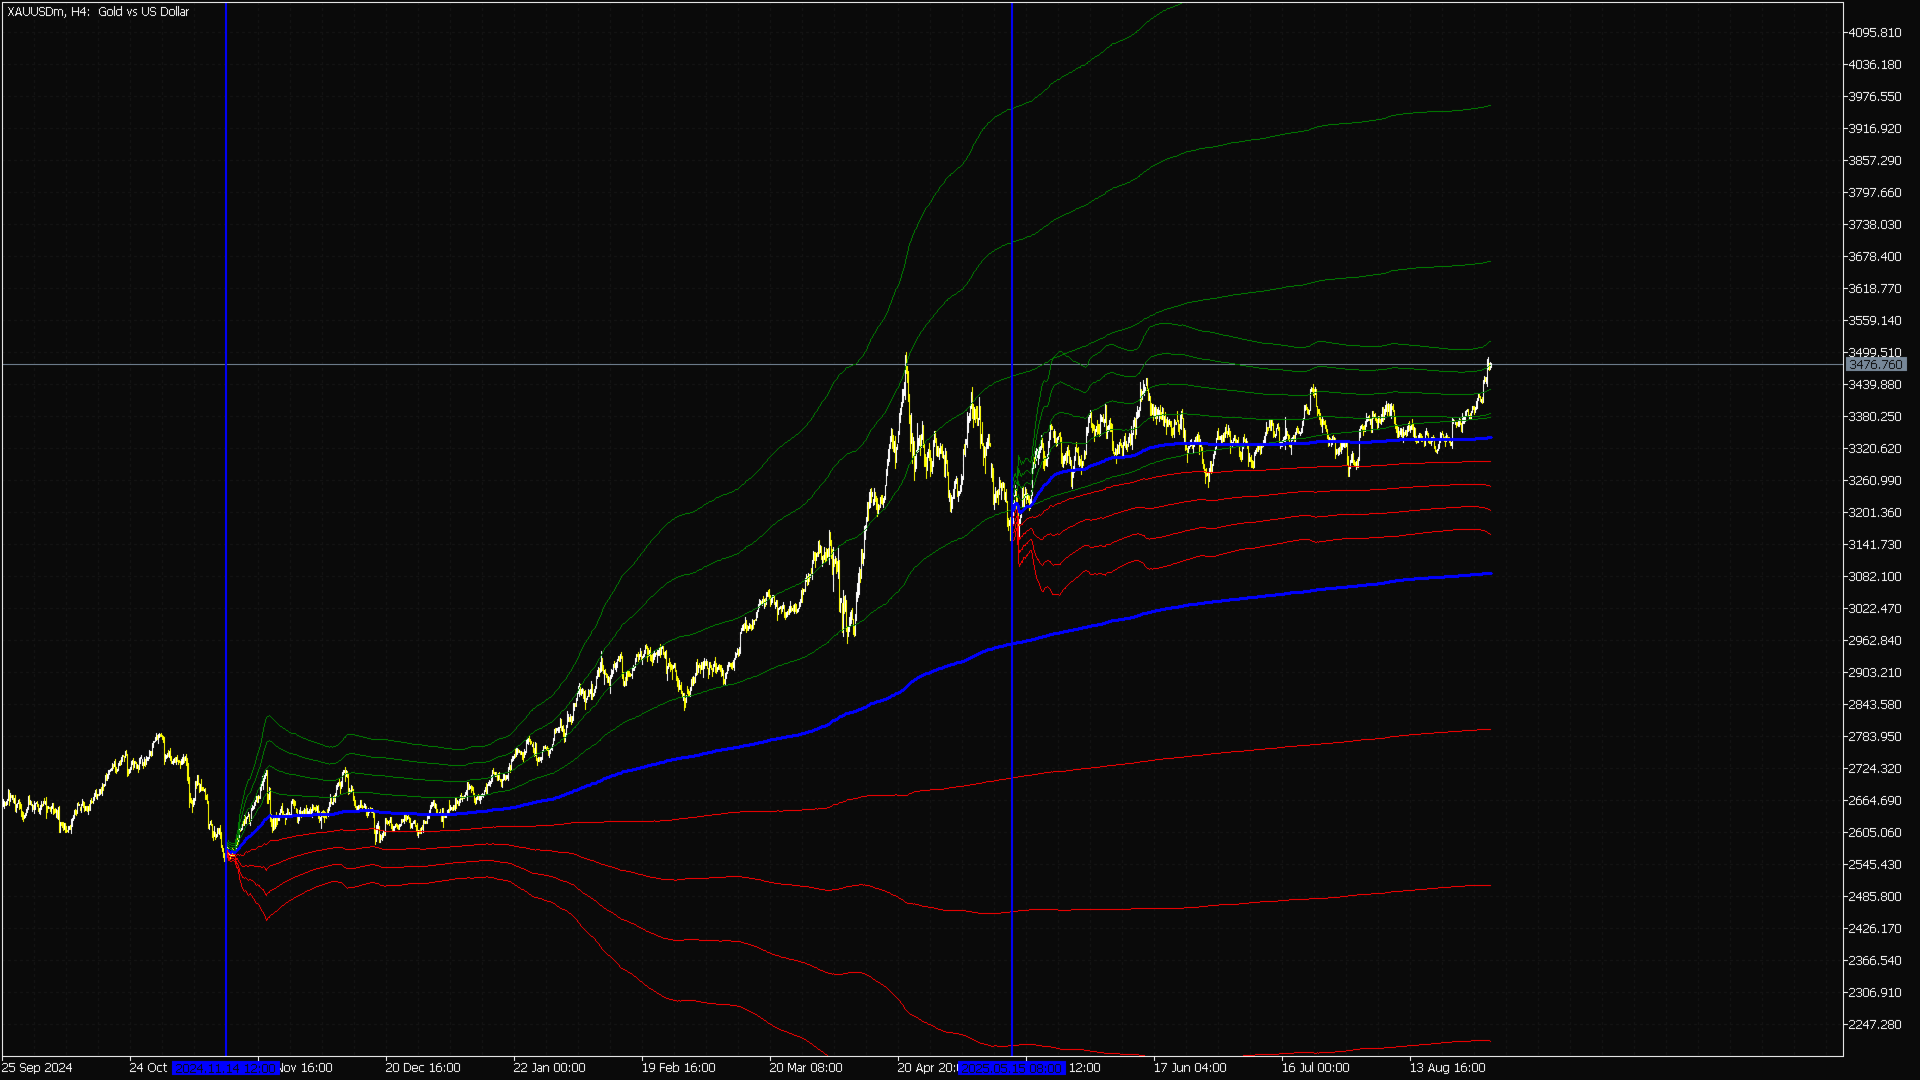
Indicateur Anchored VWAP MT5 — Prix Moyen Pondéré par le Volume Institutionnel
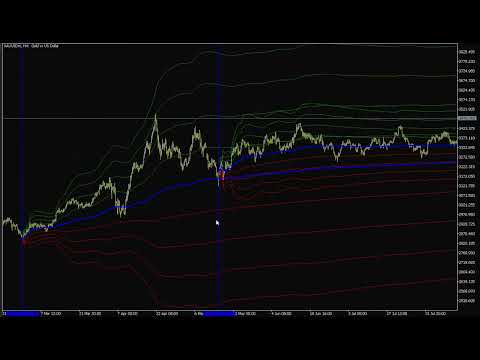
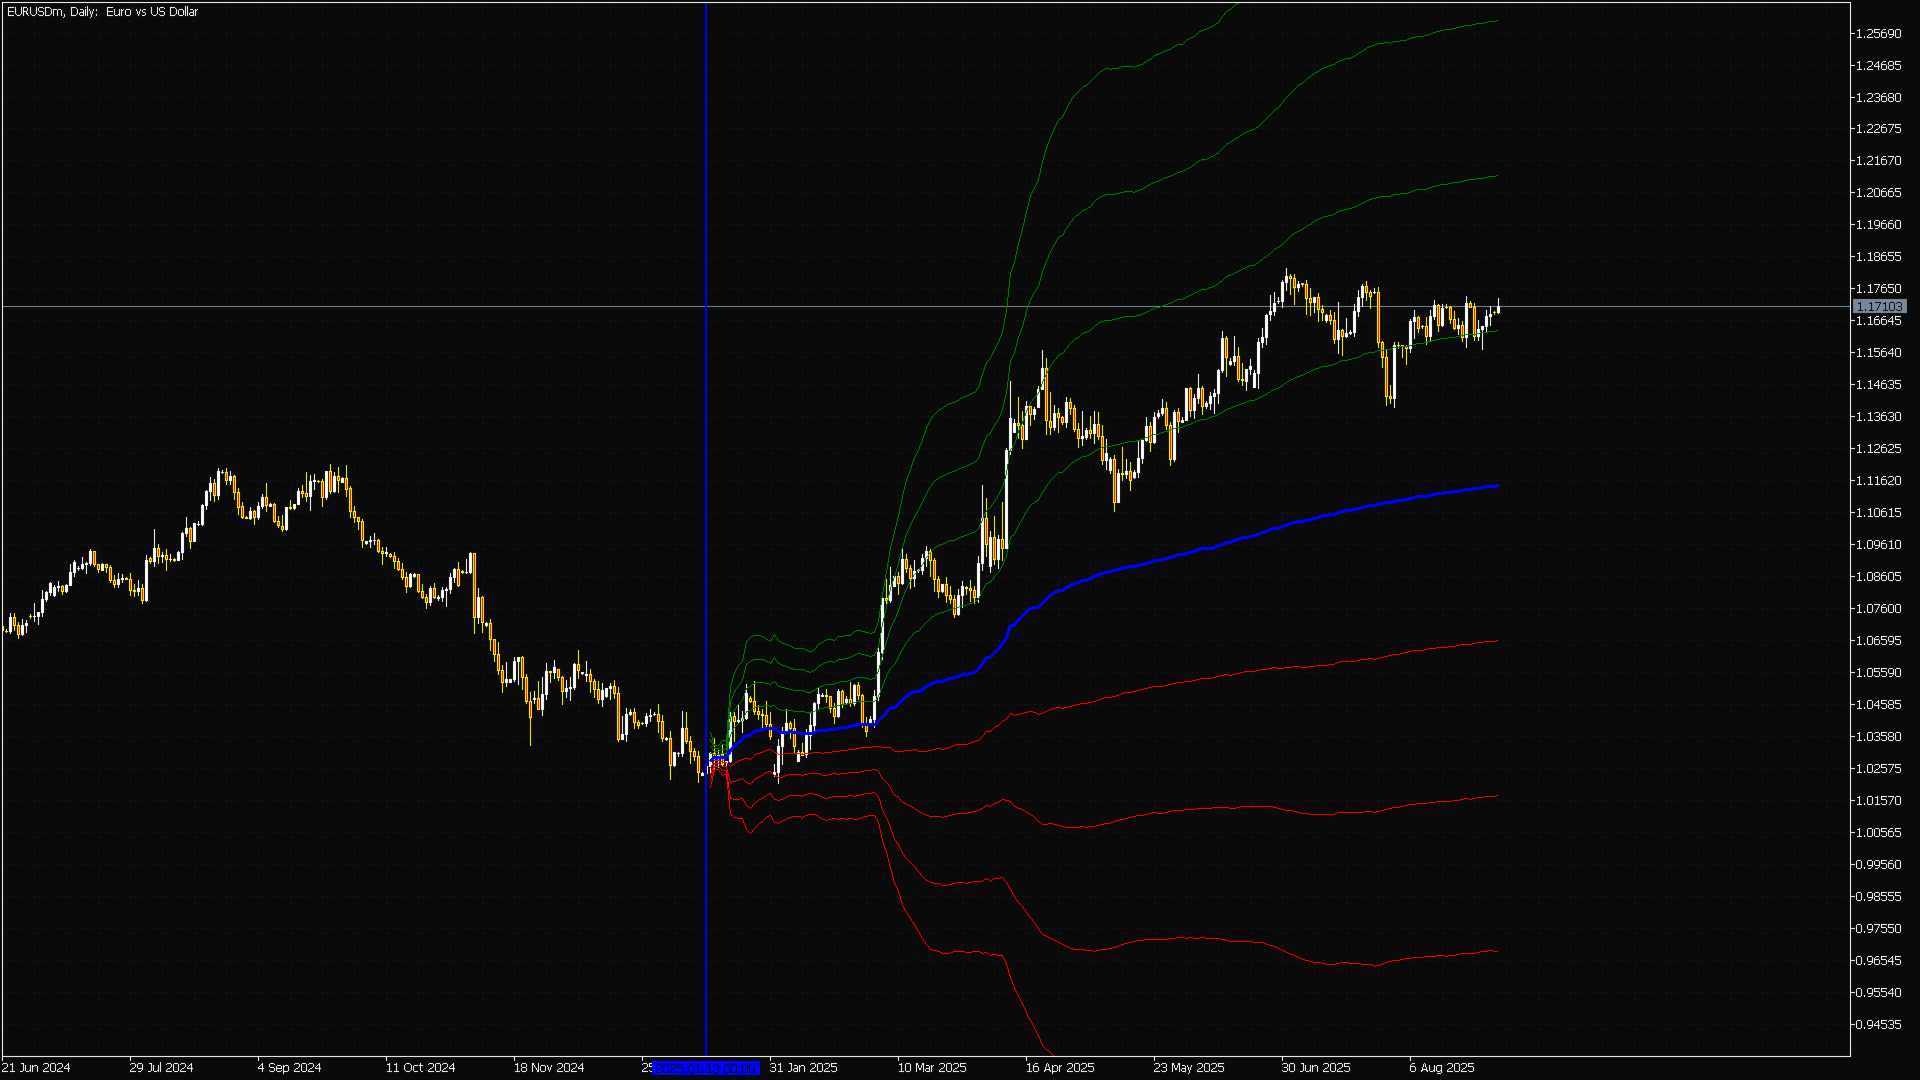
Accédez à une analyse de marché de niveau institutionnel grâce à l'Indicateur Anchored VWAP pour MetaTrader 5. Contrairement aux indicateurs VWAP standards qui imposent une réinitialisation quotidienne rigide, cet outil professionnel vous offre une liberté absolue : ancrez le Prix Moyen Pondéré par le Volume à n'importe quelle bougie spécifique, plus haut/plus bas, annonce économique ou début de session.
En suivant précisément les zones où se concentrent les volumes institutionnels massifs à partir du point de départ de votre choix, vous obtenez une vision claire de la valeur réelle du marché, des supports/résistances dynamiques et du carnet d'ordres liquides.
Pourquoi cet Anchored VWAP est supérieur aux autres
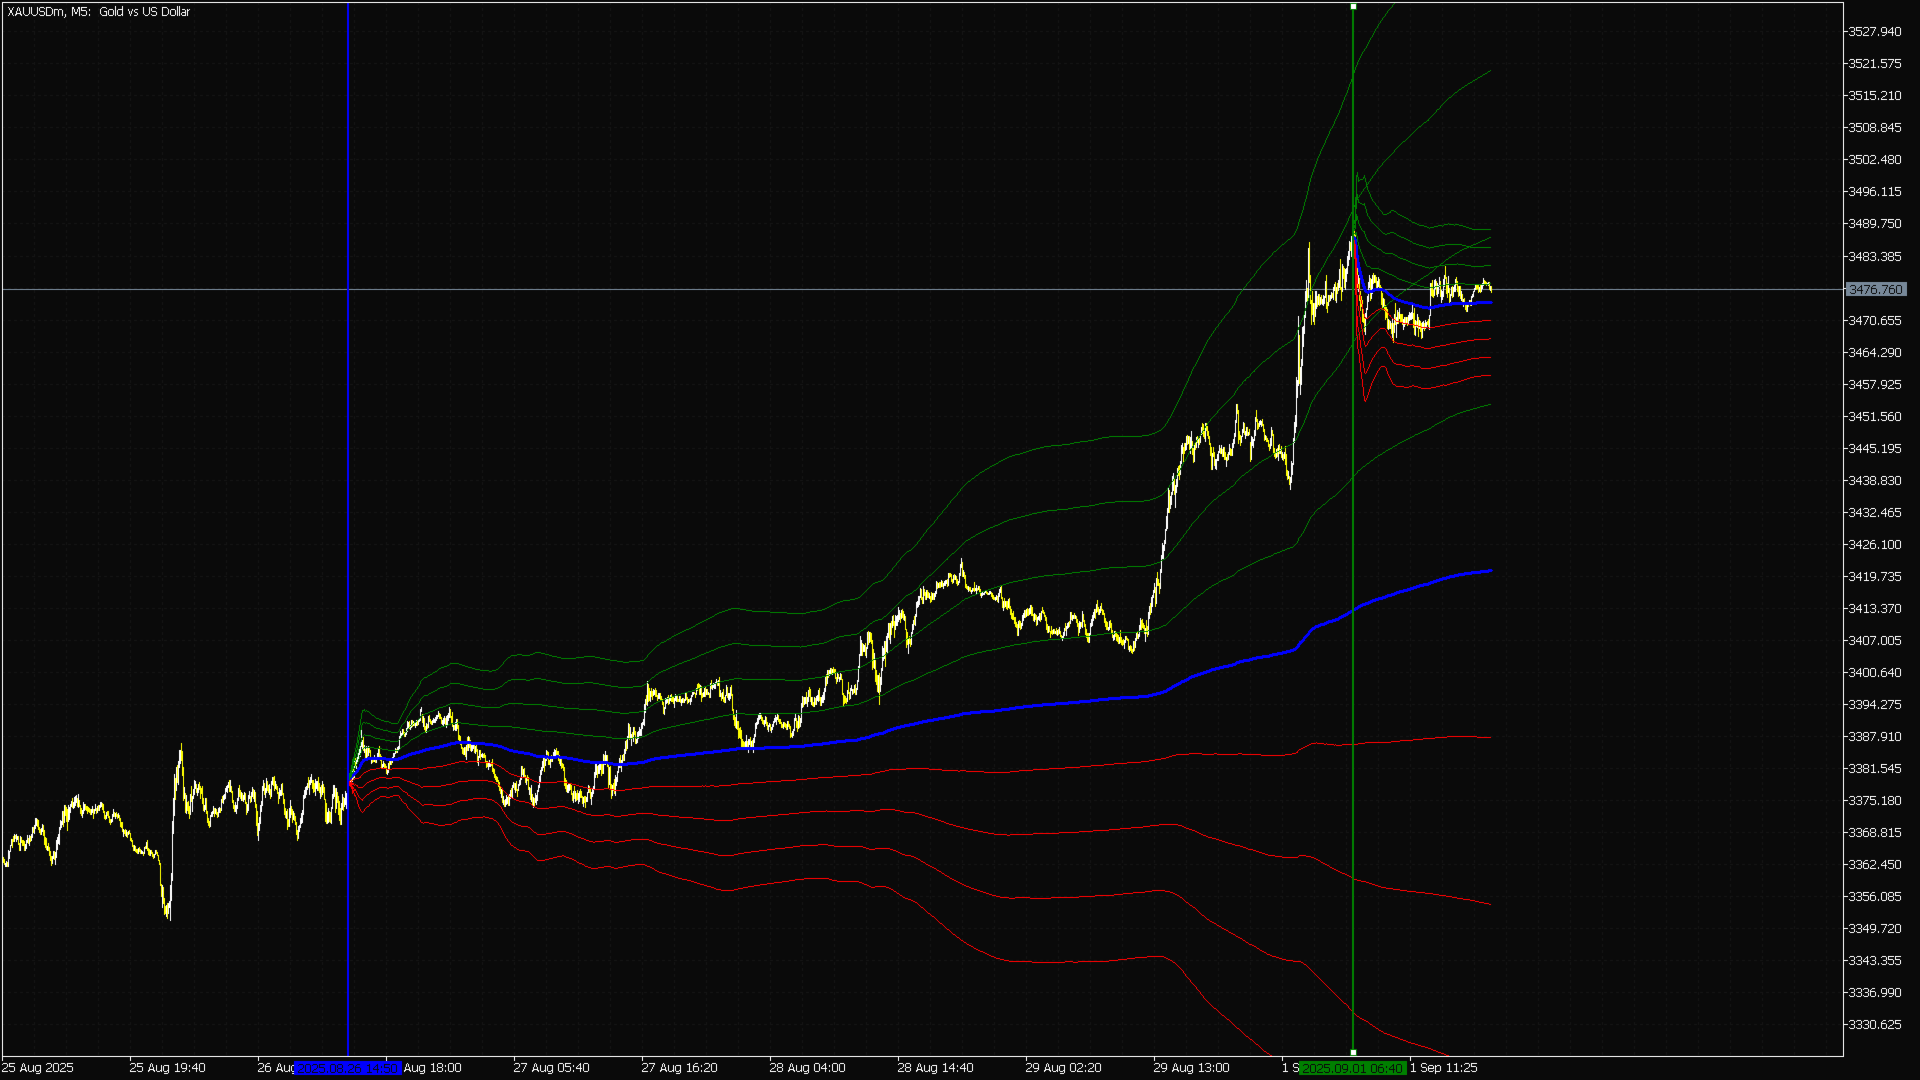
- Ancrage interactif instantané : Oubliez les configurations fastidieuses. Effectuez simplement un Double-Clic sur n'importe quelle bougie directement sur votre graphique pour y positionner instantanément l'ancrage du VWAP.
- Verrouillage intelligent de l'ancre : Une fois positionné, verrouillez le point d'ancrage pour éviter tout déplacement accidentel lorsque vous déplacez le graphique ou changez d'unité de temps.
- Bandes de déviation standard dynamiques : Bandes multiplicatrices intégrées et entièrement personnalisables (ex: +1, +2, -1, -2) pour cartographier les zones de surachat/survente et les canaux de volatilité.
- Synchronisation multi-temporalité : Performances irréprochables sur tous les graphiques, du M1 pour le scalping jusqu'au Daily/Weekly pour le swing trading.
- Léger & haute performance : Aucun ralentissement. Le code source est optimisé pour garantir un affichage fluide et une utilisation minimale du processeur (CPU), même sur plusieurs graphiques simultanés.
Applications de trading professionnel
- Ciblage des niveaux institutionnels : Alignez vos entrées sur les algorithmes des grandes banques en ancrant l'indicateur sur les sommets/creux majeurs ou lors des publications des taux d'intérêt.
- Analyse précise de l'accumulation & distribution : Repérez les zones où la "smart money" accumule ses positions en observant la réaction du prix sur la ligne centrale du VWAP.
- Découverte de la juste valeur : Utilisez les bandes de déviation comme des lignes de support et résistance dynamiques basées sur les volumes, plutôt que des indicateurs mathématiques en retard.
Spécifications techniques & Paramètres
- Mode de sélection de l'ancre : Double-clic interactif sur le graphique ou saisie manuelle de la date et de l'heure.
- Source de calcul : Choisissez entre le prix de Clôture (Close), Typique (Typical), Médian (Median) ou Pondéré (Weighted).
- Personnalisation des bandes : Activez/Désactivez jusqu'à 3 bandes de déviation standard personnalisées avec des propriétés de couleur, d'épaisseur et de style de ligne indépendantes.
- Compatible avec les EA (Expert Advisors) : Les buffers de sortie sont entièrement exposés, ce qui permet de l'intégrer facilement dans vos robots de trading (EAs) pour le trading algorithmique automatisé.
Prenez un avantage décisif : Arrêtez de trader à l'aveugle. Équipez votre terminal MetaTrader 5 de l'outil d'ancrage de volume ultime et tradez aux côtés des grands décideurs.
Comprend les mises à jour gratuites à vie et un support développeur dédié.
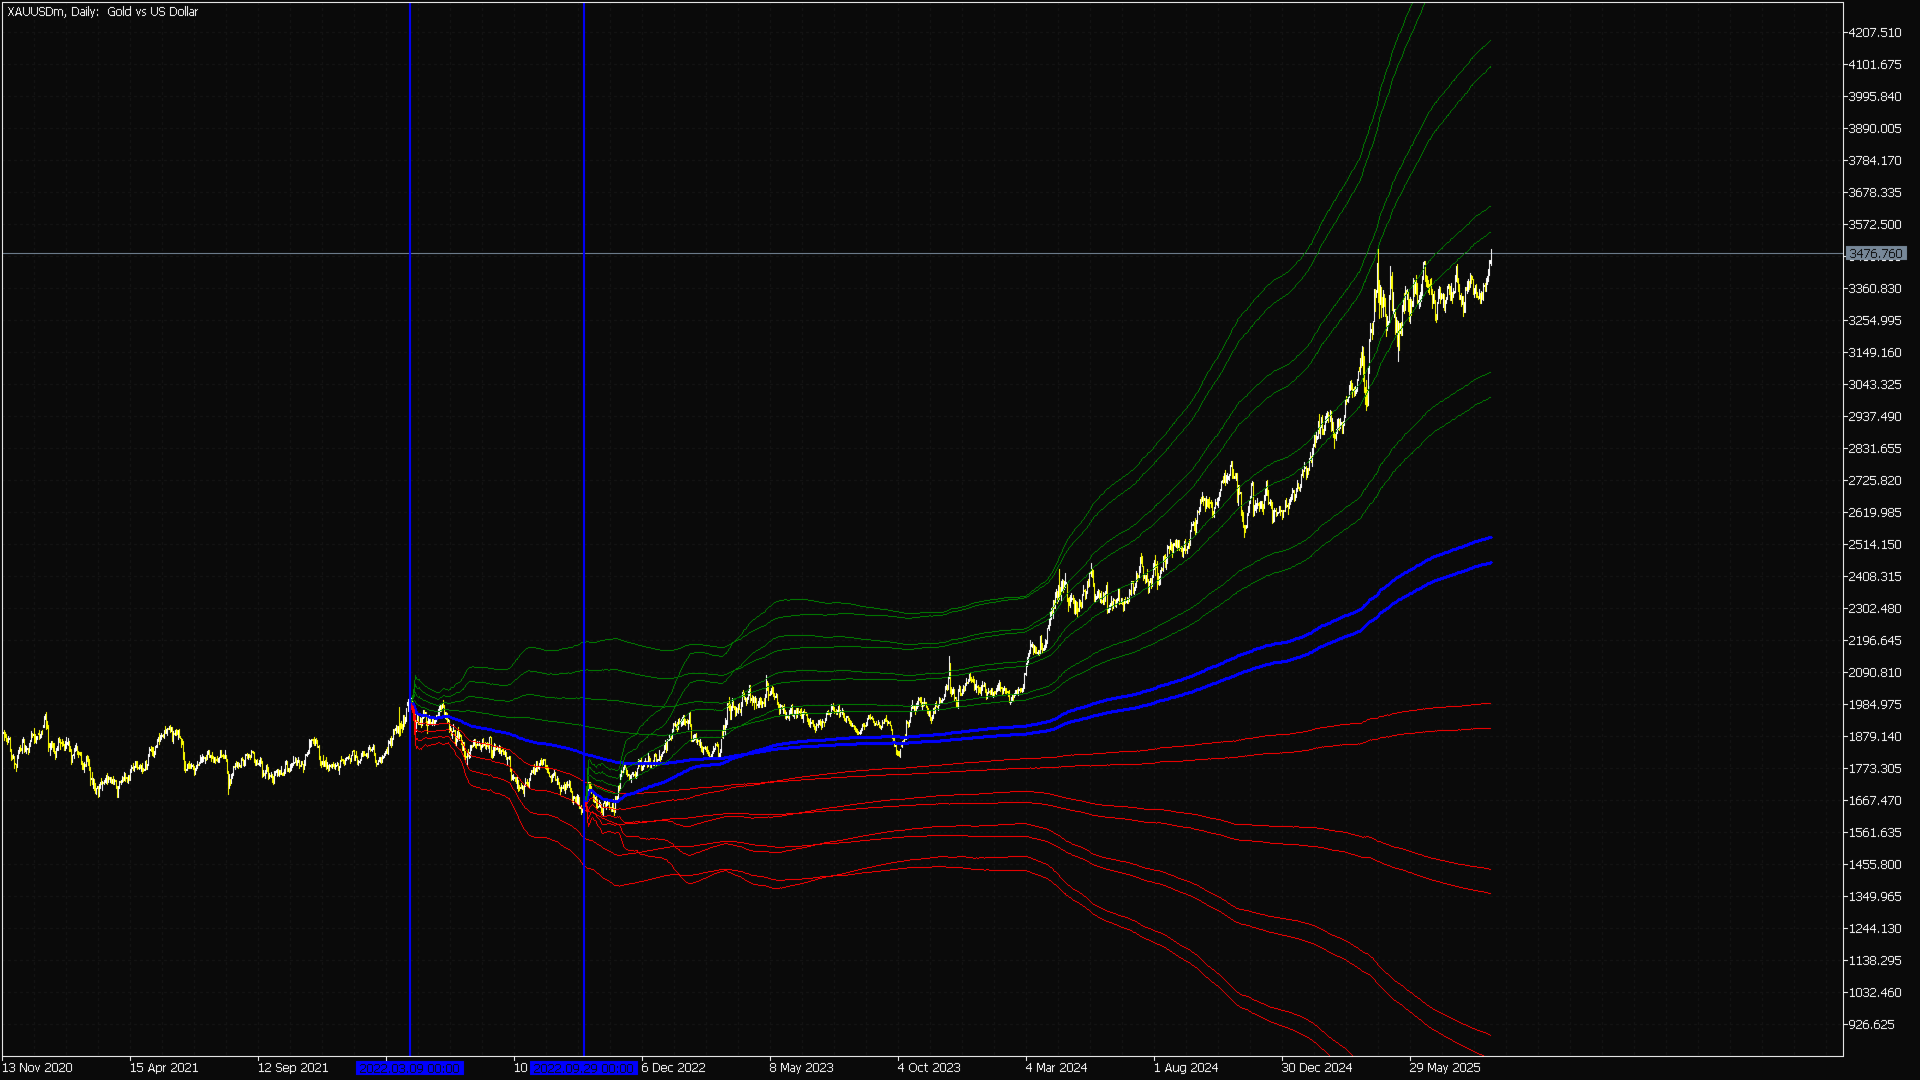


I haven't needed support yet, so I haven't rated it for now!. The indicator has helped me clarify the market picture a lot.
Thanks for sharing! And one more thing: if the indicator sent a signal when the price returns to the blue line, I think it would be PERFECT! I'm sure you can do it (for a fee, of course). Thanks again!