Watch the Market tutorial videos on YouTube
How to buy а trading robot or an indicator
Run your EA on
virtual hosting
virtual hosting
Test аn indicator/trading robot before buying
Want to earn in the Market?
How to present a product for a sell-through
Technical Indicators for MetaTrader 4 - 139
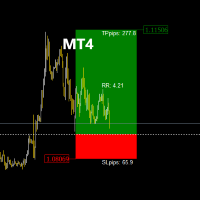
The RR_TradeManager Visualizer is a trade management indicator designed for traders who want to easily visualize their Take Profit (TP) and Stop Loss (SL) levels on a chart. This initial version provides a simple graphical representation that displays SL and TP zones as well as the entry price. Please note that this current version focuses solely on the graphical display of SL and TP zones as figures on the chart. Current Version Features: SL and TP Zones Display: Clear visualization of stop los
This is Multiple Timeframe of Malaysia SNR Levels and Storyline. The single timeframe version here Features: + Display level on multiple timeframe (higher or lower) + Turn on/off level on timeframe + Alert when price touch level 1. if high > resistance level but close of candle < resistance level , this level become unfresh - Name of level will have "(m)" meaning mitigated if close of candle > resistance level , this level become invalid and can be removed in chart (there is setting for keep
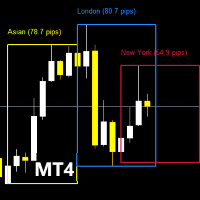
Before diving into the features of this indicator, please remember to rate this product, leave a comment to share your experience, and subscribe to my page to stay informed about the latest updates and new tools. Your support is invaluable and helps me constantly improve my creations! Description: TradingSessionPipsVisualizer - The Professional Tool for Mastering Trading Sessions Visualize Forex sessions at a glance and optimize your trading timing! The TradingSessionPipsVisualizer is a premium

Stochastic Multicurrency Scanner Dashboard MT4 is a powerful tool for monitoring multiple currency pairs and timeframes using the Stochastic oscillator. It organizes signals in a grid format, displaying each symbol’s status across timeframes from M1 to MN1. Traders can enable or disable specific timeframes to suit their strategies. You can find the MT5 version here: Stochastic Oscillator Multicurrency Scanner MT5 For detailed documentation click here: Documentation The tool displays signals bas
This indicator managge all kind of ICT FVG include: FVG, SIBI, BISI, Inverse FVG. The advantage point of this indicator is mangage FVG on all timeframe. FVG - Fair value gap ICT Fair value gap is found in a “three candles formation” in such a way that the middle candle is a big candlestick with most body range and the candles above & below that candle are short and don’t completely overlap the body of middle candle. * This indicator allow filter FVG by ATR. So you can just show valid FVG which

The Real Cloud indicator for MT4 is a popular and useful Forex indicator. This indicator provides traders with an easy way to identify potential trading opportunities in the Forex market. The Real Cloud indicator uses a unique algorithm to analyze price action and generate signals. It is designed to identify strong trends and provide traders with an edge in their trading. The Real Cloud indicator is easy to use and requires no additional setup. Simply attach the indicator to your chart and it wi
Индикатор Order blocks Mtf строит уровни на основе smart mony(умные деньги) Строит уровни как сразу получил излом тренда, индикатор очень удобен и практичен для использование на форекс и на бинарных опционов В него в шита система поиска сигналов на касании старших уровней таким же уровней излома тренда и ретеста к среднему значению При касании уровня очень хорошо отрабатывает на бинарных опционах,

The "Nostradamix" indicator is designed to analyze short-term market movements on lower timeframes (e.g., M1), while simultaneously considering trend direction on higher timeframes (e.g., M30). This tool identifies key trend reversal points, displays volatility levels, and generates buy/sell signals based on market dynamics. The indicator automatically plots: Current trend lines. Volatility bands to assess movement strength. Visual markers (arrows) for entry signals. Forecast Accuracy and Mathem

To access the TD sequential Scanner for MT5, please check https://www.mql5.com/en/market/product/123369?source=Site +Market+My+Products+Page. One of the MT5 versions includes additional timeframes such as M1, M2, M3,H2,H6,H8 and so on.( https://www.mql5.com/en/market/product/123367?source=Site +Market+My+Products+Page) TD Sequential Scanner: An Overview The TD Sequential scanner is a powerful technical analysis tool designed to identify potential price exhaustion points and trend reversals in fi
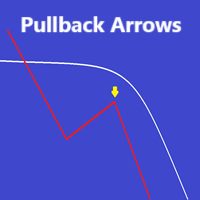
The indicator provides buy and sell arrows with a moving average and bar color based on EMA
Only buy arrows are shown above the moving average and only sell arrows are shown below the moving average
The arrows are based on a reversal algorithm and therefore trying to find the pullback points
Alerts can be activated as preferred
Suitable to any timeframe or instrument of choice
Please test in demo before purchase
Enjoy -----------------------
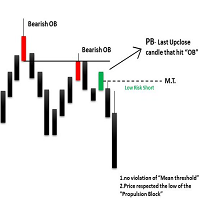
The ICT Propulsion Block indicator is meant to detect and highlight propulsion blocks, which are specific price structures introduced by the Inner Circle Trader (ICT). Note: THIS IS MTF version. Single Timeframe version avaiable at here
Propulsion Blocks are essentially blocks located where prices interact with preceding order blocks. Traders often utilize them when analyzing price movements to identify potential turning points and market behavior or areas of interest in the market.

Features:
Sharkfin Alerts Multi-timeframe Multi-currency SM TDI: To show TDI lines with sharkfin levels Zigzag MTF: To see Higher Timeframe trend Detailed blog post and extras: https://www.mql5.com/en/blogs/post/759138
Arrows works on a single timeframe and single currency. But it’s visually helps see that sharkfins. You can also get the simple arrows from mql5 site product: https://www.mql5.com/en/market/product/42405
About Scanner: It is an easy to use simplified scanner. It will show when

Filter out small price movements and focus on the larger trend . Renko chart indicator will help you to filter out a minor price movements so that you can focus on the overall trend. The price must move a specified amount to create a Renko brick. This makes it easy to spot the current trend direction in which the price is moving. Multifunctional utility : includes 66+ features | Contact me if you have any questions | MT5 version In the settings of the indicator, you can configure: Calcu
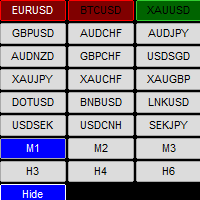
** NOTE: This indicator uses realtime data. Thus DO NOT download Demo version. If you still need demo version, please refer to free version . Version for MT5: https://www.mql5.com/en/market/product/115489
Symbol Chart Changer is an indicator/utility that offers you the option to switch between symbols and timeframes.
You can choose any symbol and timeframe on the same chart with just a few clicks. In addition, this indicator also shows the profit of the symbol through the color o

Detailed blog post with extras downloads: https://www.mql5.com/en/blogs/post/759154
About: Price ranges most of the time in forex… Like 70-80% of the time. And then it breaks out of the range to continue in a trend. Even in a trend, price makes smaller ranges all the time. Range Breaker Scalper is a tool to find the times when price breaks out of a range. A sudden break means that price will continue on for next few bars towards the breakout. So, these areas are best for scalping. Especially if
Nadaraya Watson Envelope Multicurrency Scanner MT4 provides a streamlined way to monitor crucial reversal signals across multiple currency pairs and timeframes. Built on the popular TradingView indicator known for its accurate reversal calls, this scanner adapts the same core logic into an MT4-friendly format. It focuses on short-term opportunities in lower timeframes and strong trend signals in higher ones, helping traders stay alert to market turns. You can find the MT5 version here: Nadaraya
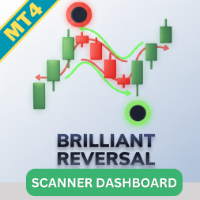
The Brilliant Reversal Multicurrency Scanner MT4 is a powerful tool designed to help traders monitor multiple currency pairs and timeframes using the Brilliant Reversal indicator. This scanner simplifies the identification of potential market reversals by providing real-time scanning and alerts directly from a centralized dashboard. Whether you trade major pairs, minor pairs, or exotics, this tool offers comprehensive market coverage and customizable settings to align with your trading strategy

The Keltner Channel Multicurrency Scanner MT4 is an advanced tool designed to enhance your trading strategy by detecting Keltner Channel breakouts across multiple currency pairs and timeframes. This powerful scanner helps traders identify significant price movements and breakout opportunities in real time, enabling faster decision-making and better market analysis. Key Features Effortless multicurrency scanning: Monitor multiple currency pairs in real-time and instantly detect Keltner Channel b

Statistical Trend Indicator is an advanced custom indicator designed to analyze market movements and provide traders with calculated probabilities of upward or downward trends. By analyzing historical price data over a specified lookback period, this indicator computes the likelihood of the market continuing in either direction, offering traders a statistical edge in decision-making.
Key Features: Probability Display: It calculates and displays the percentage probabilities of an upward or down

Heiken Ashi Multicurrency Scanner Dashboard for MT4 is a powerful tool designed to help traders efficiently monitor market trends using the Heiken Ashi indicator across multiple currency pairs and timeframes. This scanner simplifies trend identification and potential market reversals by offering real-time scanning and alerts directly from a centralized dashboard. Whether you trade major pairs, minor pairs, or exotics, the scanner provides extensive market coverage and customizable settings to s
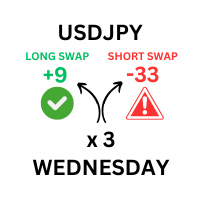
This tool designed to display detailed swap rates for all available currency pairs on your trading platform. It allows traders to quickly view both long and short swap values in a separate, visually enhanced window. This tool offers user-defined inputs for lot size, ensuring precise calculations based on the current swap rates and trading volume. Additionally, it provides the time when the swap fees will be applied, considering both the standard and weekend-adjusted rates.
Note: swap informatio

Binary Scalper 6 – A Powerful Binary Options Indicator for MT4 Binary Scalper 6 is an advanced trend analysis and binary options trading tool for MetaTrader 4 (MT4) . Designed for traders of all experience levels, this indicator offers precise signals and detailed statistics to maximize trading efficiency. Key Features: Trend Detection
Accurately identifies trending markets, providing traders with a clear direction for binary options trading. Support for Any Currency Pair
The indicator works

Trend StarteR is a multi RSI based indicator that gives up and downtrend signals in form of arrows, the indicator was made to predict possible trend and help traders to take part in trading those trends, this indicator doesnt repaint ore back paint , this indicator signal doesn't delay. ================= Recommendations : low spread broker, any time frame, but better stick to M5 and above to beat the spread. ================================== Parameters : first, second,and third RSI periods up

RSI Divergence Multicurrency Scanner Dashboard for MT4 is a powerful tool designed to help traders efficiently detect RSI (Relative Strength Index) divergence signals across multiple currency pairs and timeframes. This scanner simplifies the identification of potential market reversals by offering real-time scanning and alerts directly from a centralized dashboard. Whether you trade major pairs, minor pairs, or exotics, the scanner provides extensive market coverage and customizable settings to

Candlestick Pattern Scanner Dashboard for MT4 is a powerful tool for monitoring candlestick patterns across multiple currency pairs and timeframes. It organizes detected patterns in a grid format, displaying the pattern's short form and how many candles ago it appeared (e.g., BUEN(3) for a Bullish Engulfing pattern detected three candles ago). You can find the MT5 version here: CandleStick Patterns Multicurrency Scanner MT5
For detailed documentation click here: Documentation Link Key Features
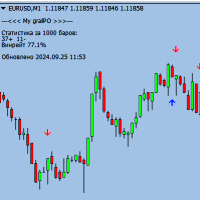
Attention, for the indicator to work correctly, you need to put the "MQL5" folder in your terminal folder, you can download it from the link below: https://disk.yandex.ru/d/DPyo0ntaevi_2A
Binary Scalper 7 is a powerful tool designed to identify and predict the next candle, allowing traders to make informed decisions when trading binary options. This indicator works on any time frame and with any expiration, making it a versatile and reliable tool for traders of all levels.
How it works:
The

The presented indicator is an original development based on the idea embedded in the classic technical analysis indicator - Fractals. The Fractals indicator allows you to determine a significant trough or peak for analysis on the price chart of the financial instrument in question. The fractal itself on the price chart consists of candles, the middle of which is either the highest (up fractal) or the lowest (down fractal) of all the candles taken for analysis. The original indicator uses five ca
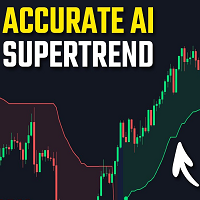
Machine Learning Adaptive SuperTrend - Take Your Trading to the Next Level!
Introducing the Machine Learning Adaptive SuperTrend , an advanced trading indicator designed to adapt to market volatility dynamically using machine learning techniques. This indicator employs k-means clustering to categorize market volatility into high, medium, and low levels, enhancing the traditional SuperTrend strategy. Perfect for traders who want an edge in identifying trend shifts and market conditio

Vondereich MTF Strength System – The Ultimate BBMA Dashboard for MT4 Overview Stop wasting time scanning dozens of charts manually!
The Vondereich MTF Strength System is a professional dashboard designed for traders who follow the BBMA (Bollinger Bands & Moving Averages) methodology. It automatically scans multiple pairs and timeframes, highlighting high-probability setups such as Re-entry, CSM, MHV, and Extreme . With a clean and responsive interface, you’ll instantly see market momentum
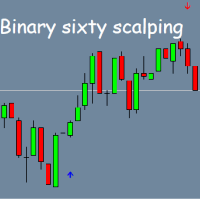
Binary Sixty Scalping – Indicator for Binary Options on MT4 Binary Sixty Scalping is an indicator for the MT4 platform, designed specifically for binary options trading. It can work on any timeframe, but for higher accuracy, it is recommended to use M5 or higher. The indicator is compatible with all currency pairs, making it adaptable to various markets. Key Features: Default expiration – 1 candle , adjustable in the settings; Trend-based trading : The indicator analyzes the trend direction, id

Scopri l'Indicatore Avanzato di Zone di Offerta e Domanda Sei pronto a portare il tuo trading al livello successivo? L'indicatore "Advanced Supply and Demand Zone" è lo strumento definitivo per identificare con precisione le zone chiave di supporto e resistenza sul mercato, permettendoti di prendere decisioni informate e tempestive. Come Funziona Questo indicatore innovativo analizza il mercato utilizzando frattali veloci e lenti per individuare i punti di inversione del prezzo. Si basa sui prin

ADX Shark Scalper – The Ultimate Hybrid Indicator for Precision Scalping Dive into the markets with the ADX Shark Scalper , a powerful and versatile tool designed for traders who seek precision in every trade. This cutting-edge indicator seamlessly combines multiple advanced technical signals into one streamlined system, allowing you to spot good buy and sell opportunities with ease. At its core, the ADX Shark Scalper leverages the power of trend and momentum detection through the integration of

Trend Oscillator - is an advanced custom Crypto_Forex indicator, efficient trading tool! Advanced new calculation method is used - 20 options for parameter "Price for calculation". Smoothest oscillator ever developed. Green color for upward trends, Red color for downward trends. Oversold values: below 5, O verbought values: over 95. There are plenty of opportunities to upgrade even standard strategies with this indicator. With PC and Mobile alerts. Click here to see high quality Trading Robot
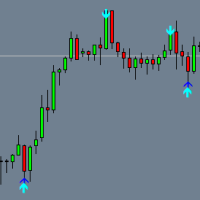
Binary DUNKS is a tool designed for binary options trading, optimized for timeframes of M5 and above . This indicator works with any currency pair and helps identify potential entry points in the market. Key Features Expiration:
Default setting for 1 candle , adjustable in the indicator settings. Signals:
The indicator generates arrows: Red arrow — Sell signal. Blue arrow — Buy signal.
Signals are most effective when there are two confirmations (two arrows above or below the candle). In
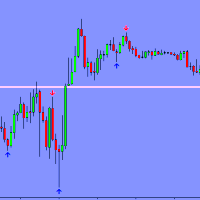
Binary Crater is a powerful and versatile MetaTrader 4 indicator designed specifically for binary options trading. It works effectively on any time frame and with any currency pair, making it an extremely flexible tool for traders.
Key Features:
Trend Analysis: The indicator automatically detects the current trend in the market, which helps traders enter trades in the direction of the trend, thereby increasing the likelihood of a successful trade.
Signal Output: The indicator outputs buffer

Unlock the Power of Multi-Market Insights with Our Cutting-Edge Dashboard Indicator
Are you tired of juggling multiple charts and indicators just to stay on top of the markets? Introducing the "RSI & EMA Cross Dashboard" - a revolutionary trading tool that consolidates critical signals across your favorite currency pairs and timeframes into a single, easy-to-read display.
Meticulously coded by our team of seasoned developers, this indicator harnesses the power of RSI and EMA crossover analysi

Advancing in NASDAQ 100 Trading with the Smart "Candle Color" Indicator The indicator we offer is one of the good tools for trading in the NASDAQ 100 market, especially in the 1-minute and 5-minute timeframes. This indicator is designed with precision and scientific rigor and can also be used in other timeframes. All you need to do is activate it and leverage its power. Unique Features: Optimized Performance in 1-Minute and 5-Minute Timeframes: This indicator is specifically designed for these

Magic Moving AI The Magic Moving AI indicator is one of the best tools for trading in the NASDAQ 100 market. This tool is specifically designed for the 1-minute and 5-minute timeframes and operates with high precision. You can easily activate this indicator and benefit from its advantages. Unique Features: Specialized Performance in 1-Minute and 5-Minute Timeframes: While this indicator is capable of working in other timeframes, its primary focus is on these two timeframes to deliver optimal re

Discover Advanced Trading Opportunities in the NASDAQ 100 Market with the NASDAQ Smart Indicator The NASDAQ Smart Indicator is one of the powerful and effective tools for trading in the NASDAQ 100 market. This indicator is specifically designed for the 1-minute and 5-minute timeframes and operates with high precision and expertise. You can easily activate it and benefit from its advantages. Key Features: Optimal Performance in 1-Minute and 5-Minute Timeframes: This indicator is specifically des

The indicator now available to you is one of the best tools for trading in the NASDAQ 100 market, particularly in the 1-minute and 5-minute timeframes. This tool is designed with precision and can also be used for other timeframes. All you need to do is activate it. Key Features: Specialized Performance in 1-Minute and 5-Minute Timeframes: While this indicator can work in other timeframes, it delivers optimal results in these two timeframes. Compatibility with the NASDAQ 100 Secret Strategy: Th
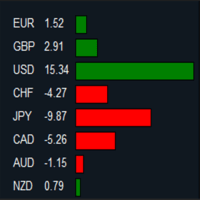
MT5 Version: https://www.mql5.com/en/market/product/124136 Imagine you’re at the helm of your trading terminal, scanning charts of various currency pairs, trying to figure out which ones are strong, which ones are weak, and where the real opportunities lie. It’s a lot to process—flipping between charts, calculating movements, and comparing performance. But what if all of that could be done for you, neatly displayed in one place? That’s where this Forex Strength Dashboard comes in. Picture thi
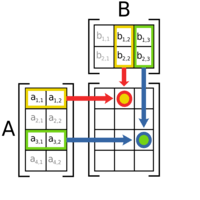
MT5 Version: https://www.mql5.com/en/market/product/124107 A Day in the Life of a Trader: Discovering the Forex Matrix Dashboard In the fast-paced world of forex trading, keeping track of multiple currency pairs can feel overwhelming. That’s where the Forex Matrix Dashboard comes in, making the life of a trader much easier. Imagine opening the dashboard and instantly seeing all your favorite currency pairs, like EUR/USD, GBP/USD, and USD/JPY, displayed clearly with their latest prices. No mo

MT5 Version: https://www.mql5.com/en/market/product/124150 You’re sitting in your trading room, sipping coffee as the markets start their day. The screen in front of you is alive with numbers, price movements, and endless charts. Each one demands your attention. But you don’t have time to dive into every single detail. You need a quick, reliable way to read the market’s mood. That’s when you glance at your Sentiment Dashboard—a custom-built tool designed to simplify your trading decisions. This
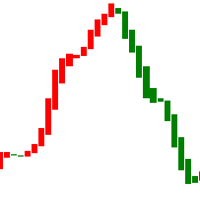
This is an indicator that tracks price trends and can alert traders when the market exhibits abnormalities. The indicator chart is marked with red and green colors. The background color of the chart is white and cannot be modified to other background colors. When the indicator color changes from red to green, it means that the market price has paused or even reversed. This is a reminder to traders of the possibility of short orders. When the indicator color changes from green to red, it means t
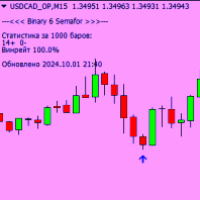
Binary 6 Semafor - universal binary options indicator for MetaTrader 4.
-Works on any timeframe and currency pair
-Accurate detection of the entry point
-The signal on the chart appears before the current candle closes
-Expiration 1 candle
-Buffer arrows for entry
-Display statistics for the current asset
Test results:
The indicator has passed tests with impressive returns, demonstrating its effectiveness in various market conditions. It is ideal for traders who want to maximize their p
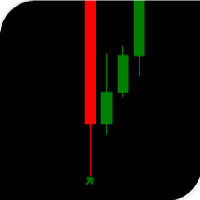
The arrow indicator without redrawing shows potential entry points into the market in the form of arrows of the appropriate color: the up arrows (usually green) suggest opening a purchase, the red down arrows suggest selling. The appearance of arrows may be accompanied by beeps. It is usually assumed to enter at the next bar after the pointer, but there may be non-standard recommendations. Arrow indicators visually "unload" the price chart and save time for analysis: no signal – no deal, if ther

CCI Divergence Multicurrency Scanner Dashboard for MT4 is a powerful tool designed to help traders efficiently detect CCI (Commodity Channel Index) divergence signals across multiple currency pairs and timeframes. This scanner streamlines the process of identifying potential market reversals by offering real-time scanning and alerts from a centralized dashboard. Whether you trade major pairs, minor pairs, or exotics, the scanner provides extensive market coverage and flexible customization opti
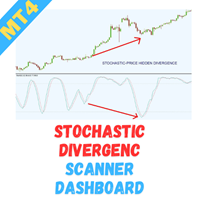
Stochastic Divergence Multicurrency Scanner Dashboard for MT4 is an advanced tool designed to help traders efficiently detect bullish and bearish Stochastic divergence signals across multiple currency pairs and timeframes. It simplifies the process of identifying potential market reversals by providing real-time scanning and alerts from a centralized dashboard. Whether you trade major pairs, minor pairs, or exotics, the scanner offers broad market coverage with flexible customization options. B
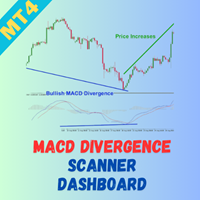
The MACD Divergence Multicurrency Scanner Dashboard for MT4 is a powerful tool designed to help traders identify bullish and bearish MACD divergence signals across multiple currency pairs and timeframes. It simplifies the process of spotting potential market reversals by providing real-time scanning and alerts directly from a centralized dashboard. Whether you are trading major pairs, minor pairs, or exotics, the scanner offers broad market coverage and flexible configuration options. By allowi
the indicator presents three supertrends that identify a possible trend for the day and places possible entry flags when they are aligned, audible and visual alarms available, usable on all timeframes, ability to customize trends, colors, and time filter.
each asset needs its own specific supertrends, indicator has standard trends that can be used on M5

Want to create an Expert Advisor (EA) using an indicator that doesn’t store the required data in a buffer (visible in the Data Window) and only draws objects on the chart? This solution captures chart objects and places them into buffers, allowing you to create an EA—whether you're using EA Builder Pro or writing code with iCustom—by selecting the correct values using those buffers (modes). It works with any object visible in the Object List that has a unique Name or Description, such as: Trend

The Support Resistance Whisperer is a powerful tool designed to help traders identify crucial support and resistance levels in the market. This indicator uses price action to dynamically draw red resistance lines and green support lines on your chart, offering a clear and visual representation of key price zones where potential market reversals or breakouts may occur. Unlike traditional methods that rely on fractals, this indicator avoids lag by calculating support and resistance based on the hi
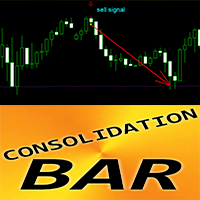
Crypto_Forex Indicator Consolidation Bar Pattern for MT4. Indicator "Consolidation Bar " is very powerful breakout-focused indicator for Price Action trading. Indicator detects price consolidation in narrow area during 1 bar and shows: Breakout direction, Pending order location and SL location. Bullish Consolidation Bar - Blue arrow signal on chart (see pictures). Bearish Consolidation Bar - Red arrow signal on chart (see pictures). No repaint; No delay; High R/R ratio (reward/ri
About:
Looks for price making a trend flip pattern. Importance of this pattern is that after it happens, price tends to range a bit and then breakout right after.
Features:
Looks for trend flip pattern Num of bars creating pattern Extend lines to right to wait for breakout Bull/Bear Strength for candles making the pattern Filter using Halftrend/NRTR
How it Works:
Use this technique for scalping. After a pattern happens, you will see a red/green rectangle. Red means a Bearish pattern and green
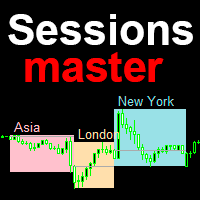
Session master - индикатор торговых сессий с расширенными возможностями. По умолчанию отображает Азиатскую, Лондонскую и Нью Йоркскую сессии, с возможностью самостоятельно настроить каждую сессию индикатора под свою торговлю. Описание Отображает прямоугольной областью заданный период в часах дня Максимум и минимум сессии соответствуют максимам и минимумам прямоугольных областей сессий Индивидуальная настройка для каждой сессии, имя, цвет, период в часах Автоматически переводит время сессий зада

Fxcycle Trend Indicator - Precision Trading for Consistent Profits Version: 1.00
Copyright: Fxcycle The Fxcycle Trend Indicator is a powerful trend-following tool designed to help traders identify market direction with ease. Built for traders of all experience levels, this indicator provides precise buy and sell signals based on advanced trend analysis, making it the perfect tool for anyone looking to maximize their profits in the Forex market. Key Features: Accurate Trend Detection: Based on ad
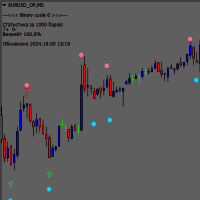
The Binary Cucle 6 indicator is a powerful oscillator for binary options trading on the MetaTrader 4 platform. It is designed to work on timeframes from M5 and higher, and can also be used on any currency pair.
The Binary Cucle 6 indicator provides accurate signals for entering a trade in the form of blue and red arrows that appear on the chart before the current candle closes. This allows traders to make quick and informed decisions about entering a trade.
It is important to note that signal
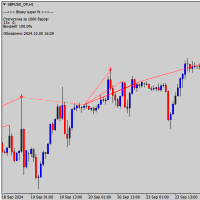
Binary Super FX для MetaTrader 4 - это мощный осциллятор для торговли бинарными опционами. Он может быть использован на любом таймфрейме и на любой валютной паре. Индикатор Binary Super FX выдает точные сигналы на вход в виде буферных стрелок перед закрытием свечи, с экспирацией 1 свеча. Это позволяет трейдерам принимать быстрые и информированные решения о входе в сделку. Важно отметить, что перед покупкой индикатора рекомендуется протестировать его на демо счете, чтобы убедиться в его эффективн

**FxCycle WaveSignal Indicator**
The **FxCycle WaveSignal Indicator** is the perfect solution for traders who want to identify strong and accurate trading opportunities using a **wave pattern** approach combined with **Exponential Moving Averages (EMA)**. This indicator is designed to provide clear **Buy** and **Sell** signals based on price movement around the **Upper** and **Lower Wave Line**, as well as presenting an attractive visual display directly on your charts.
#### **Main Features:*
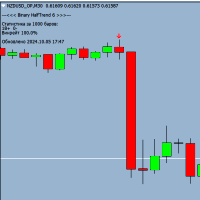
Binary HalfTrend 6 is a powerful trend indicator designed for binary options trading, providing accurate buy and sell signals. The expiration time is only 1 candle, you can trade on any timeframe. The Binary HalfTrend 6 indicator analyzes market trends and generates reliable signals in the form of arrows on the chart for profitable trades. Before using it in live trading, I recommend testing it on a demo account to choose the most profitable currency pairs for work.
Attention, for the indicato

Indicator description: The Ratel Strength indicator is mainly used to determine the strength of long and short trends and give reference signals for buying and selling points. It is suitable for gold, foreign exchange, digital currencies, etc. Indicator parameters: Proid:14 B/S signal reversal deviation value: 1.00
Display B/S signal: TRUE Up trend signal color: clrLightSeaGreen Down trend signal color: clrRed Indicator usage:
Above the 0 axis of the column, long position are relatively strong

Live Signal: Click One
Have you ever wondered why most systems are not effective in live trading? My answer is that it's all the fault of the so-called "Smart Money" or the institutional ones,, they constantly create spikes first up then down and vice versa to screw all the retail investors by tearing away their capital, confusing them and making the markets move randomly without any rules. But in all this there is a famous strategy, which in 2009 won the world championship, exploiting and r

MASTER MA is a moving average cross based indicator, using 3 moving averages with different periods cross to generate signals, the strategy is very simple, but the indicator has stats dashboard that shows useful instant back test results such as win rate/total profits won…etc., this indicator has TP and SL inputs in points so you can have your TP and SL wanted visible on the chart in form of green dot for TP and red x for SL, the indicator will use those values to calculate win/loss percentage.

L'indicatore QuantumBlocks è uno strumento avanzato progettato per i trader che desiderano identificare con precisione zone di accumulazione o distribuzione nel mercato, comunemente note come "Order Blocks". Questi livelli rappresentano aree chiave dove istituzioni finanziarie o trader di grande volume piazzano i loro ordini, influenzando pesantemente il movimento dei prezzi. Funzionalità principali: Identificazione automatica dei blocchi di ordini rialzisti e ribassisti : L'indicatore scansion

Alpha Trend sign has been a very popular trading tool in our company for a long time. It can verify our trading system and clearly indicate trading signals, and the signals will not drift.
Main functions:
Based on the market display of active areas, indicators can be used to intuitively determine whether the current market trend belongs to a trend market or a volatile market.
And enter the market according to the indicator arrows, with green arrows indicating buy and red arrows indicating se

Unveil Market Secrets with Sneaky Busters on MetaTrader 4! Delve deeper into the intricate world of trading with the Sneaky Busters indicator, specifically crafted to spotlight the sophisticated maneuvers of smart money and uncover hidden market trends. Comprehensive Features: 1. Smart Money Accumulation & Distribution Detection: Accurate Analysis: Identify key zones where smart money collects and disperses assets. These insights help you understand market sentiment and potential turning points.
The indicator is designed to display key price ranges on the graph and analysis of market dynamics within the established limits. It uses the parameter Period = 1200 , which means the calculation of data based on 1200 candles or bars to form and display the range. This period is suitable for long -term trends and allows you to identify important levels of support and resistance.
The Alert = True function activates a sound or visual notice when reached the price of the boundaries of the range o

This indicator is based on the strategy shared by TheMas7er on his youtube channel.
The IDR/DR range will help you identify the high and low of the day once a candle closes above or below the the DR levels.
The IDR/DR range is determined 1 hour after session open, 09:30 am est.
I have incorporated the fibonacci tool to help you mark the retracement for a good entry in the premium or discount zone.
Important
This indicator is designed for the indices and M5 timeframe, but you are welcome to

The indicator is based on the calculation of liquidity on the market and thus shows where the market can most likely turn.. It shows the places of liquidity where the price will reach sooner or later... The indicator can be set to several types of liquidity and therefore can display several levels on the graph.. It is a unique tool that can help you very well in your trading The indicator is suitable for currency pairs with the most liquidity (Forex,Crypto...)
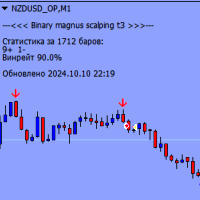
Binary Magnus Scalping T3 is a binary options indicator that works on any timeframe and with any currency pair. It uses cluster analysis to identify entry points and issues a pop-up notification and a buffer arrow on the chart in red or blue before the current candle closes.
The main features of the indicator:
Works on any timeframe (M1, M5, M15, M30, H1, H4, D1) Supports any currency pairs Expiration from 1 to 3 candles (default is 1 candle) Conducts cluster analysis to identify entry points
The MetaTrader Market is the best place to sell trading robots and technical indicators.
You only need to develop an application for the MetaTrader platform with an attractive design and a good description. We will explain you how to publish your product on the Market to offer it to millions of MetaTrader users.
You are missing trading opportunities:
- Free trading apps
- Over 8,000 signals for copying
- Economic news for exploring financial markets
Registration
Log in
If you do not have an account, please register
Allow the use of cookies to log in to the MQL5.com website.
Please enable the necessary setting in your browser, otherwise you will not be able to log in.