Watch the Market tutorial videos on YouTube
How to buy а trading robot or an indicator
Run your EA on
virtual hosting
virtual hosting
Test аn indicator/trading robot before buying
Want to earn in the Market?
How to present a product for a sell-through
Technical Indicators for MetaTrader 4 - 138

Moving pivot Average Fibonacci
The indicator compares the selected period with its counterpart from the previous period. The indicator determines the moving Fibonacci levels for the day or any time interval to assess the price movement range from the time average. The indicator helps predict the expected high or low for the day based on historical time data. The pivot line can be considered an average trend line and use it in a variety of trading strategies.
If you have any question about the

Try "Chart Patterns All in One" Demo and get Bonus. Send me message after trying demo to get Bonus.
Leave a Comment after purchase to get 8 high quality indicators as Bonus. The Chart Patterns All-in-One indicator helps traders visualize various chart patterns commonly used in technical analysis. It supports identifying potential market behaviors, but profitability is not guaranteed. Testing in demo mode is recommended before purchasing. Current Offer : 50% discount on the "Chart Patterns All

Dynamic Range Indicator for MQL4 Introducing our cutting-edge Dynamic Range Indicator , specifically designed for 5-minute charts, featuring a proven back-testing record to ensure reliable performance. Key Features: Blue and Red Lines: The indicator uses two dynamic lines to represent market volatility. Calculation Method: The lines are constructed using the last 14 days' average absolute movement of 5-minute closing prices, multiplied by today's session open price. Indicator Formula: Today's op
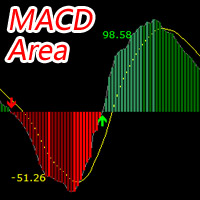
The MACD Area indicator is developed based on the system's built-in MACD indicator to enhance its functionality. The main enhancement is: average algorithm+four-color column+area value. By default, the Exponential Average Algorithm (EMA) is used, and any of the four algorithms can be selected. Algorithm 1: Fundamentals of Simple (SMA arithmetic moving average) SMA, The abbreviation for arithmetic moving average is calculated by adding the closing prices of the last N days, dividing by N, and as

The Smart Divergence Dashboard is your ultimate tool for identifying high-probability trading opportunities. This cutting-edge indicator is meticulously designed to detect Regular Divergences, offering traders a clear and actionable advantage. MT5 Version - https://www.mql5.com/en/market/product/120703/ Key Features: Real-time Divergence Detection: Instantly pinpoints Higher High/Lower Low and Oscillator Higher Low divergences across multiple currency pairs and timeframes using Awesome Oscill

First and foremost, the Insight Flow Indicator stands out as a Non-Repainting, Non-Redrawing, and Non-Lagging tool. This makes it a prime choice for both manual and algorithmic trading, ensuring reliable and consistent signals. User Manual: Settings, Inputs, and Strategy The Insight Flow Indicator leverages price action, strength, and momentum to provide a clear edge in the market. Equipped with advanced filters, it eliminates noise and false signals, enhancing trading potential. By using multip
Introducing Sterling Blaster V1.0: Specifically engineered for the unique nature of GBPUSD, delivering a remarkable around 99% success rate and an excellent way to achieve prop firm challenges. USE 5MIN TIMEFRAME Sterling Blaster Features: Optimal for GBPUSD : Tailored to deliver outstanding performance on GBPUSD. Exceptional Success Rate : Achieves a remarkable around 99% success rate based on extensive backtesting. Thoroughly Backtested : Verified through years of historical data. Risk Managem

Based on commonly used ZigZag indicators, in-depth mining was conducted on the indicators, with two main improvements: 1、 Annotate each ZZ price point; Annotate the distance points between adjacent ZZ points for a more convenient and intuitive view of price fluctuations. 2、 Draw a Fibonacci line for the current price direction of ZZ. The Fibonacci line includes two types: the Fibonacci retracement level and the Fibonacci expansion level. When the last four ZZ points comply with Dow's 123 rule,
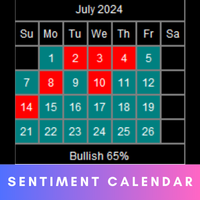
The Market Sentiment calendar provides a visual representation of market sentiment for each day or month. It will display daily and monthly BIAS . The calendar also highlights the percentage of bullish days or months within a given month or year. MT5 version - https://www.mql5.com/en/market/product/120768/ Inputs Frequency: Choose between "Daily" and "Monthly" calendar views. Sentiment Method: Select the method to determine daily or monthly sentiment: " L inear Regression ", " Accumulated Delta

Trend Divergence Indicator: Your Essential Tool for Market Analysis The Trend Divergence Indicator is a powerful tool designed to assist traders in identifying market trends and pinpointing entry points with precision. By leveraging price divergence, this indicator enhances your trading strategy, offering reliable insights and filtering unnecessary signals. Key Features and Benefits of the Trend Divergence Indicator Accurate Trend Analysis: The Trend Divergence Indicator uses price divergence t

This product is based on the methodologies of Gann, his follower Don E. Hall. The Indicator builds a working view grid, which is used to analyze graphics. The Pyrapoint tool, developed by Don Hall, is a grid based on the Pythagorean cube. In his calculations he uses the Gann Square 9 methodology and the relationship between Price and Time. This tool is used to predict changes in trend and overall market actions.
More information about the method HERE

The best indicator out there, try it yourself! Please leave your positive comments and reviews!
Settings: AlertConfirmation: truns on and off alerts CalculatedBars: how many bars will be calculated Distance : arrow distance
Buffers: Buffer0 (Arrow Buy) Buffer1 (Arrow Sell) Buffer2 (Empty) Buffer3 (Empty) Buffer4(Buy value == 1) Buffer5(Sell value ==1)
This is a Pinbar Arrows which will check for reversal pin bars. They are best when an ongoing trend ends and they signal a reversal.
Free Scanner and Detailed Post with Extra Downloads: https://www.mql5.com/en/blogs/post/758569
Features:
PinBar Body, Nose and Tail, Left Eye Options Engulfing Bar After Pin Bar Overbought/Oversold with CCI or Stochastic or RSI Distance of Pin bar body from nearest Quarter Point (Option to use Majors, halfpoints, quarters) Volatility Check

The ICT Immediate Rebalance Toolkit is a comprehensive suite of tools crafted to aid traders in pinpointing crucial trading zones and patterns within the market.
The ICT Immediate Rebalance, although frequently overlooked, emerges as one of ICT's most influential concepts, particularly when considered within a specific context. The toolkit integrates commonly used price action tools to be utilized in conjunction with the Immediate Rebalance patterns, enriching the capacity to discern conte

This is a dashboard indicator that can display daily volatility, making it convenient for traders to quickly view.
The following information can be displayed: Yesterday's high, low, and closing prices. Today's high point, low point, opening price. Dynamically display the number of points up and down from today's opening to the current level. Calculate and display the daily rise and fall points for today, yesterday, 5 days, 10 days, 20 days, 30 days, and 90 days. Current real-time spread. Curren

The Zigzag indicator can help traders identify and confirm the main trends and reversal points in price movements. By connecting significant high and low points, the Zigzag indicator can clearly display the overall trend of the market, helping traders make wiser decisions when analyzing price behavior. Supports any time period. I have added a quick control panel in the bottom left corner for it. When multiple different Bank series indicators are enabled at the same time, the control panel can qu

PinBar is a common candlestick chart form, often used as a reversal signal.
This indicator will be marked with an arrow at the PinBar position after its formation. Supports any time period. At present, this indicator is only calculated and judged based on the upper and lower shadows of the K-line and the values of the entity. In the future, intelligent judgment based on other factors of the market will be added.
I have added a quick control panel in the bottom left corner for it. When multiple

EngulfingPattern is a common candlestick chart form, often used as a reversal signal.
This indicator will be marked with double arrow at the EngulfingPattern position after its formation. Supports any time period. At present, this indicator is only calculated and judged based on the upper and lower shadows of the K-line and the values of the entity. In the future, intelligent judgment based on other factors of the market will be added.
I have added a quick control panel in the bottom left corn

The only indicator i use with MA. Best indicator for me it shows everything you need to know for trading. Many updates will be in the future. If you have any idea what to add to it then comment or write me or if you have any issues please comment or write me , but i didnt found any error in it , everything works perfectly fine. --------------------------------------------------------------------------------------------------------------------------------------------------------------------------
A simple indicator for plotting a tick chart.
This indicator will allow you to track the spread dynamics and the price behavior in general.
In the settings, you can select the price to display on the chart - Bid, Ask or both prices at the same time.
Tick Chart Indicator will definitely be useful when using scalping strategies. The MT5 version is available here . Good luck to everyone and successful trading!
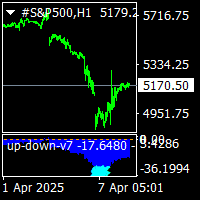
up down v7 indicator is a no repaint trend indicator.this is different version of up down v9.use different algoritm. it works all pairs and and all timeframes. dont use processed value lower than 500 bars.you can increase it acording to chart bar counts.2000-3000 there is blue histogram gives divergencies and extreme points. when gold points on histogram it gives extreme overbought. when aqua points below histogram it gives extreme oversell. for to see extreme signals switch timefremes 1m to

El indicador "MR BEAST ALERTAS DE LIQUIDEZ" es una herramienta avanzada diseñada para proporcionar señales y alertas sobre la liquidez del mercado basándose en una serie de indicadores técnicos y análisis de tendencias. Ideal para traders que buscan oportunidades de trading en función de la dinámica de precios y los niveles de volatilidad, este indicador ofrece una visualización clara y detallada en la ventana del gráfico de MetaTrader. Características Principales: Canal ATR Adaptativo: Calcula

A complex of indicators of recognizing reversal moments. Detects the peaks and hollows according to the combinations of candles after they deduct from two MA. Applicable for trading systems when using early inputs. You can use a trend for scalping and intraday trade, and for detecting a trend in the early stages.
Possibilities
The parameters provide flexible settings for any time floms and trading tools. There are several types of warning for signals. Yellow arrow - Sell signal , pink arrow -

Order block hunter indicator is the best indicator for hunt the order blocks that area where there has been a large concentration of limit orders waiting to be executed Order blocks are identified on a chart by observing previous price action and looking for areas where the price experienced significant movement or sudden changes in direction .This indicator does that for you by using very complicated codes and helps you to take the best areas To buy and sell because it make marks at the best a
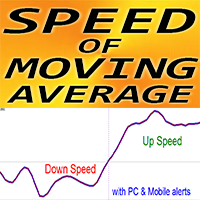
Crypto_Forex Indicator "MA Speed" for MT4, No Repaint. SPEED of Moving Average - is unique trend indicator. The calculation of this indicator is based on equations from physics . Speed is the 1st derivative of Moving average. MA Speed indicator shows how fast MA itself changes its direction. There are plenty of opportunities to upgrade even standard strategies with MA Speed . Suitable for SMA, EMA, SMMA and LWMA. It is recommended to use MA Speed in trend strategie

Simple but great indicator to improve your trading. ----------------------------------------------------- Test it as it proves its value with its results.
Settings: AlertConfirmation: turns on and off alerts CalculatedBars: how many bars will be calculated Distance : arrow distance
Buffers: Buffer0 (Arrow Buy) Buffer1 (Arrow Sell) Buffer2 (Buy value 1) Buffer3 (Sell value 1)
Hello
Alright. This indicator works on MT4 and is very easy to use. When you receive a signal from it, you wait for that candle with the signal to close and you enter your trade at the beginning of the next new candle. A red arrow means sell and a green arrow means buy. All arrows comes with a long dotted like for easy identification of trade signal. Are you okay with that? 100% non repaint Work All Major currency Pair, 1 minute time frame 1 minute expire, 5 minute timeframe 5 minute expire
Supply and Demand Professional is a powerful tool suited for advanced traders! Easily see levels of supply and demand (or support and resistance) as they develop. *This is a NON-repainting indicator* How this can help you?
Levels can be used for stop loss and take profit targets Automatically identifying key levels in the market Spotting market imbalances Better entry levels and timing of trades Volume analysis Understanding market sentiment Predicting price movements Risk management Trend co
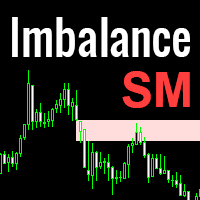
Imbalance is one of the important zones on the chart, to which the price will always strive to cover it. It is from the imbalance zone that the market most often makes significant reversals, rollbacks and gives entry points that you can successfully trade. In the Smart Money concept, the imbalance zone is used to find an entry point, as well as a place for take profit at the level of imbalance overlap by the price. Until the imbalance is overlapped, it is the closest target for the price. Ho
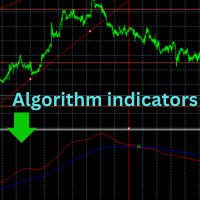
Welcome, thank you for choosing us Read carefully before starting When you turn on the indicator, leave it for about an hour or two. It will automatically collect the data, and then its shape will be complete and it will start balancing the new data. We offer you the latest indicators that will help you make decisions after creating your own technical analysis
You will see the entry point that you will use to get a good deal
At each intersection there is an opportunity for a deal that the ind
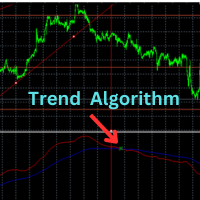
Welcome, thank you for choosing us
Read carefully before starting
If you want to trade on a demo account, put the indicator there. If you want to trade on a real account, put the indicator there and wait about two hours for the data to be collected again. The data differs between the demo and real accounts in several factors. We offer you the latest indicators that will help you make decisions after creating your own technical analysis
You will see the entry point that you will use to get a

Master GANN’s precise targets are calculated based on his time-tested methods and presented right in front of you. This tool is designed to make trading smoother and more intuitive. By adjusting the white line upwards or the green line downwards, you’ll immediately see the reason GANN's techniques remain influential in the world of trading. ( This is a manual indicator and contains features that may not supported by the MetaTrader current testing environment )
GANN’s strategies revolve around p

This indicator works on MT4 and is very easy to use. When you receive a signal from it, you wait for that candle with the signal to close and you enter your trade at the beginning of the next new candle . A red arrow means sell and a green arrow means buy. All arrows comes with Alert like for easy identification of trade signal. Are you okay with that?
1 minute candle
1 minute expire

Bomb Bank Signal: Your Trusted Indicator for MetaTrader 4
The Bomb Bank Signal is a powerful indicator for MetaTrader 4, designed to identify the most relevant trends in the financial market. If you are looking for a tool that accurately anticipates movements, Bomb Bank is the ally you need.
How it Works:
This indicator combines three distinct methods – volume analysis, candle closes and symmetrical trend – to detect and signal buying and selling opportunities. Bomb Bank is like a "bomb" whe
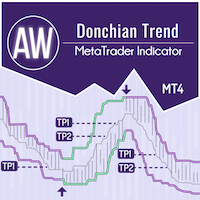
AW Donchian Trend is a trend indicator based on the Donchian channel. The indicator can calculate TakeProfit and StopLoss levels, has advanced statistics on the success of signals, as well as three types of notifications about the received signal. Setup Guide and Instructions - Here / MT5 Version - Here How to trade with the indicator: Trading with AW Donchian Trend is just three easy steps: Step 1 - Opening a position A buy signal is received with a success rate of more than 70% on the M15
This versatile tool lets you create various Renko-style charts, including Median Renko, Mean Renko, and Traditional Renko with wicks . It offers a wide range of chart options to suit the needs of day traders, scalpers, and long-term investors.
Indicator Settings Starting Price. Box Size (in pips). Shift Percent. Timeframe Name. Show Wicks (On or Off). Amount of Bars.

The "Candle Info" indicator for MetaTrader 4 (MT4) helps traders analyze and visualize key candle formations directly on the chart. By detecting formations such as Higher Highs (HH), Lower Lows (LL), Higher Lows (HL), and Lower Highs (LH), it provides insights into market trends and potential price movements. Key Features: Candle Formations: Identifies and labels HH, LL, HL, LH, along with combinations like HH & HL (bullish) and LL & LH (bearish). Session Filters: Allows filtering of formations

Unlock the Power of Trend Trading with Ease Designed for traders of all levels—beginners, intermediates, and professionals—this indicator simplifies the trading process by accurately detecting real trends across any currency pair. Why Choose This Indicator? No Repaint: All signals are static and non repaint Effortless Trading: Say goodbye to complex analysis. Simply load the indicator on your chart and wait for a buy or sell signal—no need to monitor the market all day. Clear Entry Signals: Th

Adjustable Consecutive Fractals looks for 2 or more fractals in one direction and sends out a on screen alert, sound alert and push notification, for strong reversal points .
Adjustable Consecutive Fractals, shows the fractals on chart along with a color changing text for buy and sell signals when one or more fractals appear on one side of price.
Adjustable Consecutive Fractals is based Bill Williams Fractals . The standard Bill Williams fractals are set at a non adjustable 5 bars, BUT withe th
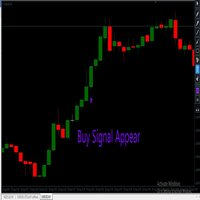
The Binary Profit Maker,
This indicator works on MT4 and is very easy to use. When you receive a signal from it, you wait for that candle with the signal to close and you enter your trade at the beginning of the next new candle . A Up Purple arrow means Buy and a Down Purple arrow means Sell. All arrows comes with Alert like for easy identification of trade signal. Are you okay with that?
How To Enter Trade?
1 minute candle
1 minute expire
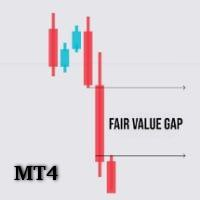
FVG Analyzer – The Ultimate Tool for Precise Fair Value Gap (FVG) Detection FVG Analyzer is a powerful and fully customizable indicator built for serious traders who leverage Fair Value Gaps (FVG) in their strategies. With smart detection and clean visuals, this tool allows you to quickly identify market inefficiencies—areas where price is likely to return before continuing in its trend. Key Features: Automatic Detection of Fair Value Gaps (bullish and bearish) based on candlestick patterns. Sel

This indicator/dashboard , is place on a single symbol. It shows the percentage of movement withing all time frames from M1 to W1.The text will change green if all % are in the positive for a buy signal.The text will change red if all % are below zero and in negative for a sell signal. There are audible notifications, as well as on screen notifications along with push notifications that can be turned on and ON/OFF in the settings.
This is a sure way to Find trends quickly and efficiently, with

Volume Break Oscillator is an indicator that matches price movement with volume trends in the form of an oscillator.
I wanted to integrate volume analysis into my strategies but I have always been disappointed by most volume indicators, such as OBV, Money Flow Index, A/D but also as Volume Weighted Macd and many others. I therefore wrote this indicator for myself, I am satisfied with how useful it is, and therefore I decided to publish it on the market.
Main features:
It highlights the phase
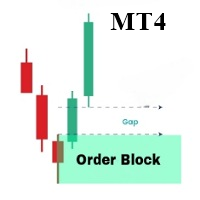
The OrderBlock Analyzer is a powerful custom MetaTrader 4 (MT4) indicator designed to detect and highlight critical Order Blocks on your price charts, helping you identify potential reversal points and key areas of market interest. Key Features: Order Block Detection: Automatically identifies bullish and bearish Order Blocks, marking areas where institutional traders are likely to enter or exit positions. Customizable Display: Choose your preferred colors and styles for bullish and bearish Order
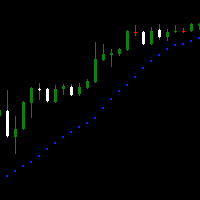
Доброго времени суток.
Вашему вниманию простой, но крайне удобный продукт для любителей индикатора Parabolic SAR . Он представляет собой окно осциллятора, на который выводится несколько тайм-фреймов в режими реального времени вместе с индикатором.
Настройки интуитивно понятные, что бы включать и отключать количество выбранных таймов - необходимо применять PERIOD_CURRENT, в таком случае дополнительный тайм не откроется.
Пишите в комментариях к продукту, что бы вы хотели увидеть в новых версия

he "Super Trampoline" is an innovative trading indicator designed to simplify decision-making in financial markets. It analyzes chart data and provides clear and timely signals on when to buy or sell an asset, based on a proven strategy of candlestick pattern analysis. Product Advantages: Intuitive Interface : "Super Trampoline" integrates directly into your trading terminal, displaying signals as simple arrows on the chart. This means you don't need deep technical analysis knowledge to start us

Introducing "Super Transplant with Filter" — a game-changing tool for traders who value precision, reliability, and simplicity. This indicator combines advanced trend analysis techniques with intelligent signal filtering, allowing you to make decisions based on the most relevant data. Benefits of "Super Transplant with Filter": Accuracy in Every Trade : The indicator meticulously analyzes market data, identifying key trends while filtering out false signals. This enables you to make more informe

TitanVision indicator is a versatile technical analysis tool that helps traders identify market trends and potential entry and exit points. It features a dynamic Trend Catcher Strategy, adapting to market conditions for a clear visual representation of trend direction and various trend reversal points. Traders can customize the parameters according to their preferences. The indicator helps in identifying trends, signals possible reversals, acts as a trailing stop mechanism and provides real-tim
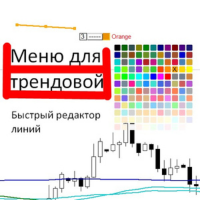
Выпадающее меню для трендовых линий и прямоугольника. Позволяет редактировать цвет, стиль и толщину. При выделении линии появляется меню, каждая функция разделена. Можно сразу нажать и поменять на нужное. Толщина меняется по другому, нужно нажать на цифру, она станет в синем цвете, нажать нужную цифру от 1 до 4, в зависимости от нужной толщины, нажать интер.

The Multi Pairs Forex Indicator is an advanced trading too l that allows traders to track and analyze the performance of multiple currency pairs in real-time on a single chart. It consolidates data from various Forex pairs, providing an at-a-glance overview of market conditions across different currencies and helps you save time. Useful for various trading styles, including scalping, day trading, and swing trading. Whether you're monitoring major pairs like EUR/USD, GBP/USD, or more exotic pair

MT4 is a Histogram version of MT5: https://www.mql5.com/en/market/product/122151 Introducing Trade Sniper: Your Edge in the Markets. Tired of missing profitable trades or getting caught on the wrong side of the market? Meet Trade Sniper, the cutting-edge indicator that harnesses the power of trends to give you a razor-sharp advantage in your trading. Trend Sniper is not just another run-of-the-mill indicator. It's a sophisticated tool that combines advanced algorithms with time-tested trading

The Escobar Reversal Indicator focuses on giving unique smart buy and sell signals, along the side you will get stop loss target and various take profit targets to choose from!
Comes with a built in trend analyzer sitting in the middle under the name, this trend analyzer can help us confirm entries and increase the accuracy.
Now remember this might be a good indicator with easy functions for beginners but that won’t mean you shouldn’t add some extra indicators to help you confirm and get you

Super Reversal Pattern Indicator
Unlock the power of advanced pattern recognition with our Super Reversal Pattern Indicator. Designed for traders seeking precision and reliability, this indicator identifies one of the most effective reversal patterns in technical analysis, offering a significant edge in your trading strategy. Key Features: Non-Repainting Accuracy: Enjoy the confidence of non-repainting technology. Once a Super Reversal Pattern is detected, it remains static, providing consiste
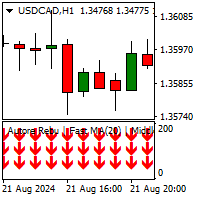
The MovingAverageTrends Indicator is a technical analysis tool designed to identify the overall market direction and provide buy or sell signals. The indicator uses three moving averages, where different periods can be set. How It Works Bullish Conditions: The indicator shows three green upward arrows when all three moving averages are trending upwards. This signal suggests that the market is in a bullish phase, and it could be a good time to enter a long position. Bearish Conditions: The indica

Volume PRO is an innovative and modernized indicator for analyzing trading volumes, which is an advanced version of traditional analysis tools. This high-tech indicator allows traders to effectively monitor trading activity without the need for complex calculations. It displays ticks for the selected time interval corresponding to the selected time frame in the form of a dynamic cumulative histogram, which is updated in real time as new trades are received. Key features: Innovative volume analys

This indicator is a certain algorithm and acts as a market scanner. All you need to do is fill in the selected currency pairs in the settings and that’s it. Next, the indicator itself will view all these currency pairs and time frames from M5 to D1 simultaneously. When a new signal appears, the indicator will give you an Alert and also draw the letter N where this new signal will be.

This indicator ( dashboard) provides trend for multi currency on multi timeframe Charts. It gives entries and Stoploss on the chart itself if the currency pair is uptrend then the cell color is displayed as Green and if its downtrend the cell displays the color as Red.If the cell colour displayed on particular currency is green it represents strong uptrend and vice versa if the cell colour is Red.If the cell has just an arrow it means the currency is ready for the trend.If the cell has neither
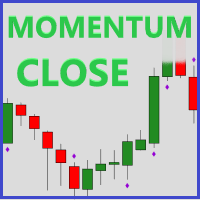
Momentum Close is a useful tool to identify volume based on the strength of a candle close. A strong candle close is when there is a small wick in comparison to the candle body and is a sign that the market will continue in that direction. *This is a NON-repainting indicator*
How this can help you? Identify trend strength Trend confirmation Seeing potential reversals (strong rejection candle) Developing entry and exit strategies Strong confluence to add to your strategy Volume analysis
Featur
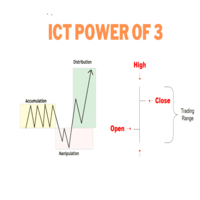
ONLY LOOK TO TRADE DURING TIMES AS SEEN IN SCREENSHOT. START TO LOAD THE INDICATOR BEFORE TO CALCULATE THE BARS SO IT SHOWS THE PHASES ACCORDING TO ICT. 1. London Silver Bullet (3:00 AM - 4:00 AM NY Time) Before 3:00 AM : The market is typically in the Accumulation Phase before the London open, where price consolidates, and large market players accumulate positions. You watch for this quiet consolidation leading up to the manipulation. 3:00 AM - 4:00 AM : Manipulation Phase occurs. During this

In the context of trading, Malaysia SNR (Support and Resistance) refers to the technical analysis of support and resistance levels in financial markets, particularly for stocks, indices, or other assets traded. There are three type of Malaysia SNR level Classic , GAP and Flipped 1. Classic Support is the price level at which an asset tends to stop falling and may start to rebound. It acts as a "floor" where demand is strong enough to prevent the price from dropping further. Resistance

Advanced UT Bot & HTS Indicator This indicator is an advanced technical analysis tool that combines two methods: UT Bot and HTS (Higher Timeframe Smoothing) , to generate accurate buy and sell signals. 1. Indicator Structure Works within the main chart window and utilizes 11 buffers to store various data points, including arrows (buy/sell signals) and bands from both UT Bot and HTS systems. Uses colored arrows to represent different trading conditions: Blue arrows : Normal buy signals. Red arro

Advanced ATR Trailing Stop with EMA Filter Indicator Introducing the ATR Trailing Stop with EMA Filter Indicator , a powerful tool designed to enhance your trading strategy with advanced signal filtering. This indicator combines the precision of ATR (Average True Range) trailing stop calculations with the flexibility of an EMA (Exponential Moving Average) filter, ensuring you capture the best opportunities in the market. Key Features: Dual Signal Arrows: The indicator provides two types of arrow
Welcome to enhanced pattern detection with the Double Top and Bottom Pattern Scanner ! Transform your trading approach with this powerful MT4 indicator designed for efficient pattern scanning and actionable alerts. Key Features: Advanced Zig Zag Pattern Detection : The Double Top and Bottom Pattern Scanner uses the zig zag pattern to detect tops and bottoms. It identifies points where the price bounces back twice from the same level after a long trend, signaling potential market reversals. Real

Zen Market Flow - MTF SuperTrend
The Multi-Timeframe SuperTrend is a system that can be used on any timeframe, this multi-timeframe indicator displaying signals from 1 to 3 timeframes simultaneously and indicating their alignment. If you enjoy the SuperTrend indicator, you will love this version of it.
You can also test the indicator's signals and drawing on the backtest , where you can display multi-timeframe signals . The indicator shows you the trade results for the selected time period an

This is a comprehensive multi-timeframe , multi-indicator dashboard designed to simplify and enhance your trading experience. The dashboard provides real-time insights across multiple currency pairs and timeframes, helping traders quickly assess market conditions and make informed decisions. With a user-friendly interface, customizable settings, and a robust selection of indicators, this tool is an essential addition to any trader's arsenal.
Key Features: Multi-Timeframe Analysis: Monitor key

The Fast flat indicator can recognize and notify you of short flats after the price rises or falls. Where the price can rush further or reverse. ++ The indicator is open to arbitrary flat settings. You will probably have to conduct quite a few tests, approaching the best results. I will be very grateful if you share in the comments your tests, parameters and advice to other users, who may also be able to improve your results. Should I use it for entry signals, order stops, hedging...? - The indi
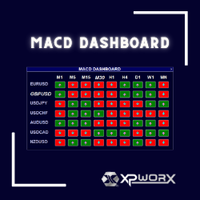
Simplify Your Trading with the MACD Dashboard
Are you tired of juggling multiple MetaTrader charts to monitor MACD across different timeframes and symbols? The MACD Dashboard is the solution you've been waiting for. This innovative MetaTrader indicator provides a centralized view of MACD signals on multiple charts, making it easier than ever to identify trading opportunities and manage your risk.
Key Features: Multi-Timeframe Monitoring: Track MACD signals on multiple timeframes simultaneousl

CVB Cumulative Volume Bands: Maximize Your Trades with Accumulated Volume! The CVB Cumulative Volume Bands is an advanced indicator designed for traders seeking precise insights based on accumulated volume. By using cumulative volume bands, this indicator offers clear readings of market buying and selling pressures, helping to identify reversals and strong price movements. Cumulative Volume Bands for MT5 ! Key Features: Accumulated Volume Analysis : Detect pressure points based
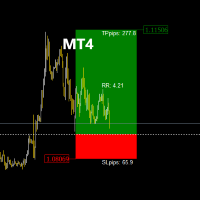
The RR_TradeManager Visualizer is a trade management indicator designed for traders who want to easily visualize their Take Profit (TP) and Stop Loss (SL) levels on a chart. This initial version provides a simple graphical representation that displays SL and TP zones as well as the entry price. Please note that this current version focuses solely on the graphical display of SL and TP zones as figures on the chart. Current Version Features: SL and TP Zones Display: Clear visualization of stop los
This is Multiple Timeframe of Malaysia SNR Levels and Storyline. The single timeframe version here Features: + Display level on multiple timeframe (higher or lower) + Turn on/off level on timeframe + Alert when price touch level 1. if high > resistance level but close of candle < resistance level , this level become unfresh - Name of level will have "(m)" meaning mitigated if close of candle > resistance level , this level become invalid and can be removed in chart (there is setting for keep
The MetaTrader Market offers a convenient and secure venue to buy applications for the MetaTrader platform. Download free demo versions of Expert Advisors and indicators right from your terminal for testing in the Strategy Tester.
Test applications in different modes to monitor the performance and make a payment for the product you want using the MQL5.community Payment System.
You are missing trading opportunities:
- Free trading apps
- Over 8,000 signals for copying
- Economic news for exploring financial markets
Registration
Log in
If you do not have an account, please register
Allow the use of cookies to log in to the MQL5.com website.
Please enable the necessary setting in your browser, otherwise you will not be able to log in.