Swap Information Hunter Indicator

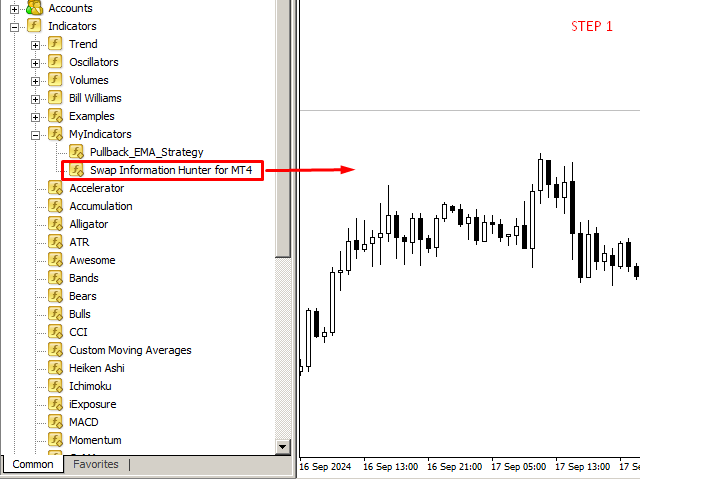
This tool designed to display detailed swap rates for all available currency pairs on your trading platform.

It allows traders to quickly view both long and short swap values in a separate, visually enhanced window.

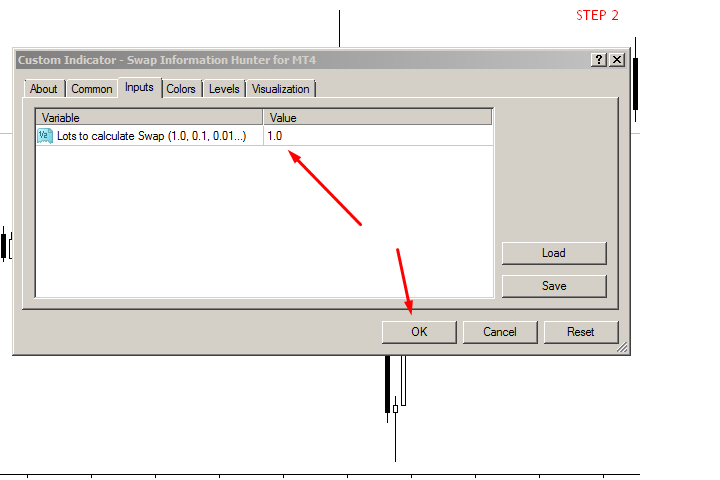
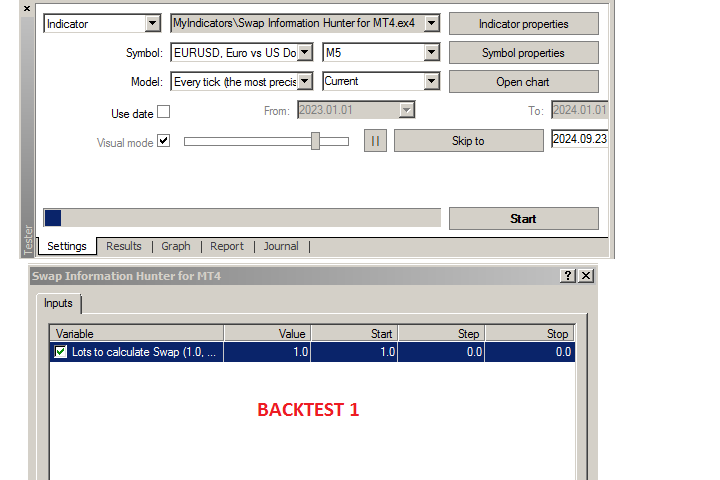
This tool offers user-defined inputs for lot size, ensuring precise calculations based on the current swap rates and trading volume.

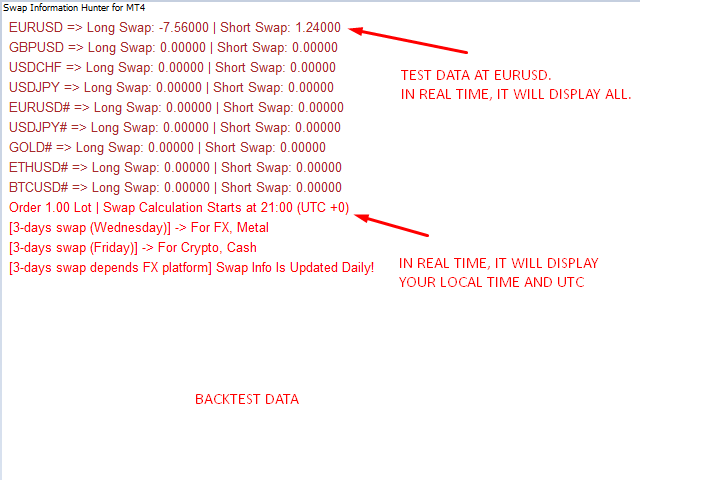
Additionally, it provides the time when the swap fees will be applied, considering both the standard and weekend-adjusted rates.


Note: swap information changes every day depending on your trading platform.


Recommended products
Currency Correlation pro Currency correlation happens when the price of two or more currency pairs moves in conjunction with one another. There can be both positive correlation, where the price of the currency pairs moves in the same direction and negative correlation, where the price of the currency pairs moves in opposite directions. this indicator put the price of 5 pairs on sub-windows so you see what happens in one chart. How to use Correlation Indicator? You can simply choose currency p
Description Keltner's colored multicurrency/multisymbol channel indicator, also called STARC band, drawn in a separate window below the chart of the main financial symbol. The indicator uses the calculation technique of the three drawing options:  basic, improved and modified . The first two were proposed by Keltner, the third one - by a successful trader L. Rakshe. You can also search for your own best parameters of the indicator. The upper, middle and lower bands can be colored. The indicator
This powerful indicator intercepts 21 patterns simultaneously on 28 Pairs and on all timeframes. Just put the indicator on a single chart to see all patterns that appear on all pairs in all timeframes The patterns found are: For Bearish: Bearish Abandoned Baby; Bearish Engulfing; Bearish Harami; Bear Kicker; Dark Cloud Cover; Evening Doji Star; Evening Star; Shooting Star; Three Black Crows; Three Inside Down; Three Outside Down; For Bullish: Bullish Abandoned Baby; Bullish Engulfing; Bullish Ha
Inside Bar
Igor Semyonov
Description The indicator determines the appearance of internal bars on the chart, and paints them in accordance with the bullish and/or bearish mood. The indicator can notify of the appearance of a formed internal bar by playing a beep, as well as display the time remaining until the end of the formation of the current bar in the format of <d:h:m:s, where: < means the current bar. d - days. h - hours. m - minutes. s - seconds. The bullish and bearish mood can be colored. Inputs Sound_Play - a
Hello This EA for send Orders Signals when you open or close order and send statics to your channel in Telegram with sum of profit or Loss Pips you can share your orders with your clients in your telegram please watch our video  to see how it is fast. https://www.youtube.com/watch?v=u_7twtYZhyI you must have Telegram channel then make bot and give it Permission and get token (watch this video to know how do it) https://www.youtube.com/watch?v=x1bKWFOjSBE and you must download this files https
MarketSessions Indicator The Essential Tool for Global Market Session Visualization The MarketSessions indicator is a powerful MT4 tool designed to help traders visualize major forex market sessions directly on their charts. By clearly displaying the active trading hours of Sydney, Tokyo, London, and New York markets, this indicator helps you identify optimal trading periods and understand market volatility patterns. Key Features: Clear visualization of all four major trading sessions (Sydney, T
FREE
Market Heart
Innovicient Limited
The Market Heart indicator scans market entries after high volatility is noticed. Most big moves occur a short time after market volatility.  Most big moves occur a short time after market volatility. The idea is to look for entries after the rectangles form and not necessarily as trade entry signals. . For example, you could use the  Retracement Feeder   indicator that generates arrow signals. Market Heart MT5  Version How to use:  1.  Primary use The White Box is the first to be formed and
Keltner Channel
Igor Semyonov
5 (1)
Description Keltner's colored channel indicator,also called STARC band, drawn in the main chart window. The indicator uses the calculation technique of the three drawing options: basic, improved and modified . The first two were proposed by Keltner, the third one - by a successful trader L. Rakshe. You can also search for your own best parameters of the indicator. The upper, middle and lower bands can be colored. The indicator includes the basic analytical tool of the market moods by Keltner. Th
Description A universal colored multicurrency/multi-symbol indicator RAVI. Was proposed by T. Chand as a trend indicator. RAVI means Range Action Verification Index. The indicator may be used with any broker, irrespective of the name of the financial instrument since it is necessary to manually enter the name as an input parameter. If you enter a non-existent or incorrect name of a financial instrument, you will receive an error message that this financial instrument is unknown (does not exist).
Great Indicator
Ruben David Santana Rodriguez
Les presento un indicador que funciona como estrategia por si solo , trabaja muy bien en periodos de 4 horas pero puedes aplicarlo a cualquier timeframe , las señales son muy faciles de interpretar , en momento en que la linea naranja pasa hacia arriba las media azul y roja , se entra en largos , la operativa se mantiene abierta hasta que la linea naranja cruce la media mas cercana ya sea la azul o la roja , si la operacion era long y la linea azul cruza hacia arriba la linea roja y la naranja c
Candle Timer Countdown (CTC) – Minimalist & Precise Candle Timer Candle Timer Countdown (CTC) is a lightweight and non-intrusive MetaTrader indicator that displays the remaining time of the current candlestick on your chart. Designed with simplicity and clarity in mind, this tool helps traders stay aware of candle closures without cluttering the chart. Key Features: Real-Time Candle Countdown Always know how many seconds are left before the current candle closes – works on all timeframes. Minima
FREE
Currency Spread Calculator
Opengates Success International
Currency Spread Calculator This indicator is created with the aim of letting the Traders know the exact points of the spread on the currency pair they are about to buy or sell. This will safe them of paying exorbitant spread over a single currency pair procurement. Imagine a normal spread become wider from 2 or 3 pips to 15pips or more when there is volatility in the market. It is absolutely outrageous looking for just 20 pips and paying another 20 pips as spread over a currency pair! Actuall
Block Master Pro
Stanislav Konin
5 (3)
The Block Master Pro indicator is designed to visually identify areas on the chart where significant volumes from major market participants are likely concentrated. These areas, known as order blocks, represent price ranges where large players place their orders, potentially signaling a price reversal and movement in the opposite direction. Key Features: Order Block Identification: Block Master Pro effectively identifies order blocks by pinpointing price ranges where large orders are placed. Th
Pips Average Range
Francesco Petralla
This indicator compares the pips of the current day with the average of pips made in the previous three days. The "Percentage today range" is red if today's figure is less than the range of the previous three days, but turns green when the percentage exceeds 100%. When the range exceeds 100% there are good trading opportunities because we are in the presence of increased volatility of the past three days. Best use with Banks Day Levels indicator. Parameters settings corner (indicator display po
The "Dagangduit Spread Indicator" is a versatile tool designed to provide traders with essential information about the current spread in the chart window. This indicator offers customizable features, including font parameters, display location on the chart, spread normalization, and alerts to enhance your trading experience. Key Features: Real-time Spread Display : The indicator displays the current spread in real-time on your trading chart, allowing you to stay informed about the cost of execut
API Tz Strength
Idowu Peter Afuye
API Tz Strength Indicator MT4 – All-in-One Strength Dashboard for 28 Symbols and 9 Timeframes Take your Strength analysis to the next level with one powerful dashboard. The API Tz Strength Indicator MT4 is designed for traders who want to track market strength and reversals across multiple symbols and timeframes – all from a single chart. With advanced clickable controls, customizable watchlists, and smart alerts, this tool simplifies multi-symbol, multi-timeframe analysis like never before. ___
The HedgingScript utility is a trading tool, allowing to exit a floating loss that results from erroneous trades by using hedging of trade results. This tool also allows you to solve the problem of negative locking. Hedging of trade results means their simultaneous closing TakeProfit and Stop Loss calculated by the script. The script takes into account the volume of opened positions! However, if the number or volume of trades is increased, the script should be relaunched on the chart! The TakePr
Correlation Dashboard
Christopher Cyril Abu Aita
This indicator calculates Correlation among currency pairs (Selected by user) to find the least and/or most correlated symbols in real time. Correlation ranges from -100% to +100%, where -100% represents currencies moving in opposite directions (negative correlation) and +100% represents currencies moving in the same direction. Note The Correlation more than 80 (Adjustable) between two currency pairs, Shows that they are quite similar in the kind of movement and side. The Correlation less than
This is the linear regression indicator for basic indicators included in the standard package of the MetaTrader 4 terminal. It is used for the analysis of price movements and market mood. The market mood is judged by the slope of the linear regression and price being below or above this line. Regression line breakthrough by the indicator line may serve as a market entry signal. There is possibility of setting the color for bullish and bearish sentiments of the basic indicators as well as plottin
The script clears the chart window from labels of order tracing. It removes labels of only closed orders. It clears charts in all windows opened in the terminal. Parameters: Symbol: clear charts of the specified symbol. If not said, clear charts in all windows. Last Data : orders with a date of closure which goes after the specified one will not be deleted. If not said, tracing of all closed orders will be deleted. Confirmation : True - confirmation of chart clearance for each window, False - n
It is the main indicator of Turtle Trading Strategy. It provides an excellent advantage for following the trend. It gives a signal to enter the transaction in channel breaks.  A sell position is opened when the 20-period lower channel breaks, and a buy position is opened when the upper channel breaks. 2 ATR should be used as the stoploss level. The R-R ratio should be at least 1/2. You can reach the maximum profit opportunity by following the 10-period middle level. Recommended INPUT: 20 Period
FREE
Description Strongest Levels Global  is a colored multicurrency/multisymbols indicator that automatically plots a system of the nearest levels of strongest resistance and support in the separate window on one of nine different indicators of the current timeframe in accordance with user's choice. Repeated usage of the indicator with various number of bars creates an extended and confirmed system of support and resistance! The indicator calculates and plots levels based on the number of bars set b
The NASDAQ Stock Exchange Session's Hours This indicator facilitates observing the currency pair's quotations during subsequent parts of the stock exchange session live. Before the session starts, a rectangle is drawn on the chart but not filled in with color. It means the extent of the session duration. Before the first bar enters the rectangle of the session, a sound signal or pop-up window will notify us that the session will just start. When the price graph crosses the edge of the session
The Smart Strategy Indicator is a trading system that allows you to analyze the market in terms of several aspects of technical analysis. The first of them is a price channel, which is built automatically and allows the trader to see the main direction of price movement. It also makes it possible to analyze the market using a channel strategy (breakout and rebound from channel lines). Block 2 is the SAR system, which gives general information about the micro-movements in the market and this is
Abbeyfx Swap Dashboard displays your broker swap/interest rate. The implied swap/interest rate differential is for all currency pairs you have in your market watch. Interest rate differential: The key factor traders consider is the difference in interest rates between two currencies involved in a pair, known as the "interest rate differential Impact on currency value: A higher interest rate typically makes a currency more attractive, causing its value to rise relative to other currencies with
The List swap is an indicator for the MetaTrader 4 platform, which allows to display swaps for all symbols (available in the Market Watch). When using the free demo version, you need to remember that the Strategy Tester of the MetaTrader 4 does not provide the ability to obtain data on other symbols. In the Strategy Tester, the swap information will be displayed only for the symbol the indicator is attached to. The indicator can be useful for traders utilizing the "Carry trade" strategy, as well
The utility is designed for placing pending orders Buy Stop, Sell Stop, Buy Limit, Sell Limit with predefined values for each type of orders, number 0 ... 15, distance from current price, Lot, Take Profit, Stop Loss, Magic. Expose and delete by pressing the hot key. How to place and delete orders by voice using the utilities of this type, see the video below the description.  https://www.youtube.com/channel/UCTpVWJkEic6TzoXr0qc9RIw/featured Key "A" sends a request for placing orders Buy Stop. Ke
FREE
The New York Stock Exchange Session's Hours This indicator facilitates observing the currency pair's quotations during subsequent parts of the stock exchange session live. Before the session starts, a rectangle is drawn on the chart but not filled in with color. It means the extent of the session duration. Before the first bar enters the rectangle of the session, a sound signal or pop-up window will notify us that the session will just start. When the price graph crosses the edge of the sessio
PABT Pattern Indicator - it's classical system one of the signal patterns. Indicator logic - the Hi & Lo of the bar is fully within the range of the preceding bar, look to trade them as pullback in trend. In the way if indicator found PABT pattern it's drawing two lines and arrow what showing trend way.  - First line - it's entry point and drawing at: 1. On the high of signal bar or on middle of the signal bar (depending from indicator mode) for buy; 2. On the low of signal bar or on middle of t
Price Statistics
Miguel Antonio Rojas Martinez
This indicator works only 5 digits Brokers. It is impossible to talk about the study of the Forex market or any market without considering of that market statistics. In this case, our indicator "price statistics" we have a new way to study our chart, giving information of the price in a range of pips you want to study for example, can we know how many times the price closes or opens into spaces 10, 20, 30, 50, 100 pips or more; and know them not only in numbers but also draws this relationship a
Buyers of this product also purchase
Miraculous Indicator – 100% Non-Repaint Forex and Binary Tool Based on Gann Square of Nine This video introduces the Miraculous Indicator , a highly accurate and powerful trading tool specifically developed for Forex and Binary Options traders. What makes this indicator unique is its foundation on the legendary Gann Square of Nine and Gann's Law of Vibration , making it one of the most precise forecasting tools available in modern trading. The Miraculous Indicator is fully non-repaint, meaning t
Gann Made Easy
Oleg Rodin
4.81 (156)
Gann Made Easy is a professional and easy to use Forex trading system which is based on the best principles of trading using the theory of W.D. Gann. The indicator provides accurate BUY and SELL signals including Stop Loss and Take Profit levels. You can trade even on the go using PUSH notifications. PLEASE CONTACT ME AFTER PURCHASE TO GET TRADING TIPS, BONUSES  AND GANN MADE EASY EA ASSISTANT  FOR FREE! Probably you already heard about the Gann trading methods before. Usually the Gann theory is
M1 Sniper
Oleg Rodin
5 (17)
M1 SNIPER is an easy to use trading indicator system. It is an arrow indicator which is designed for M1 time frame. The indicator can be used as a standalone system for scalping on M1 time frame and it can be used as a part of your existing trading system. Though this trading system was designed specifically for trading on M1, it still can be used with other time frames too. Originally I designed this method for trading XAUUSD and BTCUSD. But I find this method helpful in trading other markets a
RFI levels PRO
Roman Podpora
5 (1)
Indicator in advance   determines market reversal levels and zones , allows you to wait for the price to return to the level and enter at the beginning of a new trend, and not at its end. He shows   reversal levels   where the market confirms a change in direction and forms further movement. The indicator works without redrawing, is optimized for any instruments, and reveals its maximum potential when paired with the   TREND LINES PRO  indicator. Reversible structure scanner for all instruments
TPSpro RFI Levels
Roman Podpora
4.85 (27)
INSTRUCTIONS RUS   /   INSTRUCTIONS   ENG   -   VERSION  MT5 Main functions: Displays active zones of sellers and buyers! The indicator displays all the correct first impulse levels/zones for purchases and sales. When these levels/zones are activated, where the search for entry points begins, the levels change color and are filled with certain colors. Arrows also appear for a more intuitive perception of the situation. LOGIC AI - Display of zones (circles) for searching entry points when activa
Volatility Trend System - a trading system that gives signals for entries. The volatility system gives linear and point signals in the direction of the trend, as well as signals to exit it, without redrawing and delays. The trend indicator monitors the direction of the medium-term trend, shows the direction and its change. The signal indicator is based on changes in volatility and shows market entries. The indicator is equipped with several types of alerts. Can be applied to various trading ins
First 25 copies at $80, after that price becomes $149 (3 copies left) Gold Signal Pro is a powerful MT4 indicator designed to help traders spot strong price reactions in the market. It focuses on clear wick rejections , showing when price strongly rejects a level and often continues in the same direction. Gold Signal Pro is mainly built for scalping gold (XAUUSD) and works best on lower timeframes like M5 and M15 , where timing matters most. That said, it can also be used on any forex pair, a
PRO Renko System
Oleg Rodin
5 (30)
PRO Renko System is a highly accurate trading system specially designed for trading RENKO charts. The ARROWS and Trend Indicators DO NOT REPAINT! The system effectively neutralizes so called market noise giving you access to accurate reversal signals. The indicator is very easy to use and has only one parameter responsible for signal generation. You can easily adapt the tool to any trading instrument of your choice and the size of the renko bar. I am always ready to provide extra support to help
GoldRush Trend Arrow Signal V1.6 The GoldRush Trend Arrow Signal indicator V1.6 continues to provide precise, real-time trend analysis tailored for high-speed, short-term scalpers in XAU/USD , but it now has additional features and improved efficiency and reliability. Built specifically for the 1-minute time frame, this tool displays directional arrows for clear entry points, allowing scalpers to navigate volatile market conditions with confidence. The indicator consists of PRIMARY and SECONDARY
Scalper Inside PRO
Alexey Minkov
4.74 (69)
An exclusive indicator that utilizes an innovative algorithm to swiftly and accurately determine the market trend. The indicator automatically calculates opening, closing, and profit levels, providing detailed trading statistics. With these features, you can choose the most appropriate trading instrument for the current market conditions. Additionally, you can easily integrate your own arrow indicators into Scalper Inside Pro to quickly evaluate their statistics and profitability. Scalper Inside
Trend indicator AI
Ramil Minniakhmetov
4.65 (80)
Trend Ai indicator is great tool that will enhance a trader’s market analysis by combining trend identification with actionable entry points and reversal alerts.  This indicator empowers users to navigate the complexities of the forex market with confidence and precision Beyond the primary signals, Trend Ai indicator identifies secondary entry points that arise during pullbacks or retracements, enabling traders to capitalize on price corrections within the established trend. Important Advantage
Trend Screener
STE S.S.COMPANY
4.79 (95)
Trend Screener Indicator --Professional Trend Trading & Market Scanning System for MetaTrader Unlock the true power of trend trading with Trend Screener Indicator — a complete multi-currency, multi-timeframe trend analysis solution   powered by Fuzzy Logic,Trend Pulse Technology  and advanced market structure algorithms.   Trend Screener transforms your MetaTrader platform into a professional-grade Trend Analyzer and Market Scanner, helping you identify high-probability trend opportunities, ear
Trend Lines PRO
Roman Podpora
5 (1)
TREND LINES PRO    helps understand where the market is truly changing direction. The indicator shows real trend reversals and points where major players re-enter. You see   BOS lines   Trend changes and key levels on higher timeframes — without complex settings or unnecessary noise. Signals don't repaint and remain on the chart after the bar closes. VERSION MT 5     -     Reveals its maximum potential when paired with the   RFI LEVELS PRO  indicator What the indicator shows: Real shifts   tren
System Trend Pro
Aleksandr Makarov
5 (2)
System Trend Pro - This is the best trend trading indicator!!! The indicator no repaint!!!  The indicator has   MTF   mode, which adds confidence to trading on the trend (   no repaint   ). How to trade? Everything is very simple, we wait for the first signal (big arrow), then wait for the second signal (small arrow) and enter the market in the direction of the arrow. (See screens 1 and 2.) Exit on the opposite signal or take 20-30 pips, close half of it, and keep the rest until the opposite
Smc Blast Signal
Mohit Dhariwal
5 (3)
Full Fledged EA and Alert plus for alerts will also be provided in this offer along with the purchase of Indicator. Limited copies only at this price and Ea too. Grab your copy soon Alert plus for indicator with set file is kept in comment section with the image  SMC Blast Signal with FVG, BOS and trend Breakout The SMC Blast Signal is a Precise trading system for Meta Trader 4 that uses Smart Money Concepts (SMC), including Fair Value Gaps (FVG) and Break of Structure (BOS), to identify high-pr
Currency Strength Wizard is a very powerful indicator that provides you with all-in-one solution for successful trading. The indicator calculates the power of this or that forex pair using the data of all currencies on multiple time frames. This data is represented in a form of easy to use currency index and currency power lines which you can use to see the power of this or that currency. All you need is attach the indicator to the chart you want to trade and the indicator will show you real str
Gold Scalper Super
Aleksandr Makarov
5 (2)
Gold Scalper Super is an easy-to-use trading system. The indicator can be used as a standalone scalping system on the M1 time frame, as well as part of your existing trading system. Bonus: when purchasing an indicator, Trend Arrow Super is provided free of charge, write to us after purchase. The indicator 100% does not repaint!!! If a signal appears, it does not disappear! Unlike indicators with redrawing, which lead to the loss of a deposit, because they can show a signal and then remove it.
Presenting one-of-a-kind Gann Indicator for XAUUSD IQ Gold Gann Levels is a non-repainting, precision tool designed exclusively for XAUUSD/Gold intraday trading. It uses W.D. Gann’s square root method to plot real-time support and resistance levels, helping traders spot high-probability entries with confidence and clarity. William Delbert Gann (W.D. Gann) was an exceptional market analyst whose trading technique was based on a complex blend of mathematics, geometry, astrology, and ancient calcul
Pulse Scalping Line - an indicator for identifying potential pivot points. Based on this indicator, you can build an effective Martingale system. According to our statistics, the indicator gives a maximum of 4 erroneous pivot points in a series. On average, these are 2 pivot points. That is, the indicator shows a reversal, it is erroneous. This means that the second signal of the indicator will be highly accurate. Based on this information, you can build a trading system based on the Martingale
Pip Storm Signal
Camila Bernardez Camero
PIP STORM Signal PIP STORM is an advanced arrow-based system designed for ultra-frequent execution across volatile market phases. Its primary goal is to maintain a steady flow of actionable scalping signals without relying on lagging or overused indicators. It doesn’t predict — it reacts precisely to transitional price zones, catching micro-breakouts and liquidity imbalances with a minimalist, real-time confirmation engine. Stay Updated Join the official channel to stay informed about future
Apollo SR Master is a Support/Resistance indicator with special features which make trading with Support/Resistance zones easier and more reliable. The indicator calculates Support/Resistance zones in real-time without any time lag by detecting local price tops and bottoms. Then to confirm the newly formed SR area, the indicator shows special signal which signalizes that the SR zone can be taken into consideration and used as an actual SELL or BUY signal. In this case the strength of the SR zone
This dashboard shows the latest available harmonic patterns for the selected symbols, so you will save time and be more efficient / MT5 version . Free Indicator:   Basic Harmonic Pattern Comparison of "Basic Harmonic Pattern" vs. "Basic Harmonic Patterns Dashboard" Indicators Feature Basic Harmonic Pattern Basic Harmonic Patterns Dashboard Functionality Detects and displays harmonic patterns on a single chart Searches multiple symbols and timeframes for harmonic patterns, displays results on
Trading Special – 40% OFF Best Solution for any Newbie or Expert Trader! This dashboard software is working on 28 currency pairs plus one. It is based on 2 of our main indicators (Advanced Currency Strength 28 and Advanced Currency Impulse). It gives a great overview of the entire Forex market plus Gold or 1 indices. It shows Advanced Currency Strength values, currency speed of movement and signals for 28 Forex pairs in all (9) timeframes. Imagine how your trading will improve when you can watch
Advanced Arrow
Alfred Kamal
3.9 (39)
This indicator depends on some secrets equations to draw Signals with Stop loss and maximum 4 Take profits. There is a free EA depends on this indicator as a gift when you purchase/rent it. Features Simply it gives you entry point as Ready sign (Buy / Sell) and arrow (Buy / Sell) after candle closed, also SL line and 4 TP lines or less. Once SL-TP lines are shown with the arrow, they remains as they are until signal change. It is historical indicator. No Repaint. user manual for V5 please click
Slayer Scalping
Abdulkarim Karazon
5 (2)
This indicator focuses on two take profit levels and very tight stoploss, the whole idea is to scalp the market on higher time frames starting from m15 and higher as these timeframes doesnt get effected alot by spread and broker commision, the indicator give buy/sell signals based on price divergeance strategy where it plots a buy arrow with tp/sl levels when a bullish divergence conditions are fully met,same goes for sell arrows, the arrow prints on candle close and doesnt repaint live, some si
MetaForecast M4
Vahidreza Heidar Gholami
5 (2)
MetaForecast predicts and visualizes the future of any market based on the harmonics in price data. While the market is not always predictable, if there is a pattern in the price, MetaForecast can predict the future as accurately as possible. Compared to other similar products, Metaforecast can generate more accurate results by analyzing market trends. Input Parameters Past size Specifies the number of bars that MetaForecast uses to create a model for generating future predictions. The model is
ICT, SMC, Smart Money Concept, Support and Resistance, Trend Analysis, Price Action, Market Structure, Order Blocks, Breaker Blocks, Momentum Shift, Strong Imbalance, HH/LL/HL/LH,  Fair Value Gap, FVG, Premium & Discount Zones, Fibonacci Retracement, OTE, Buyside Liquidity, Sellside Liquidity,  Liquidity Voids, Market Sessions ,Market Time, , NDOG, NWOG,Silver Bullet,ict template  In the financial market, accurate market analysis is crucial for investors. To help investors better understand mark
New Update of Smart Trend Trading System MT5 For  2026 Market: If You Buy this Indicator you will Get my Professional   Trade Manager + EA  for   FREE . First of all Its worth emphasizing here that this Trading System is   Non-Repainting   , Non Redrawing and Non Lagging Indicator   Which makes it ideal from both manual and robot trading .  [Online course] ,   [manual]   and   [download presets] . The Smart Trend Trading System MT5 is a comprehensive trading solution tailored for   new   and   e
Trading Special –40% OFF Best Solution for any Newbie or Expert Trader! This Indicator is a unique, high quality and affordable trading tool because we have incorporated a number of proprietary features and a new formula. With only ONE chart you can read Currency Strength for 28 Forex pairs! Imagine how your trading will improve because you are able to pinpoint the exact trigger point of a new trend or scalping opportunity? User manual: click here That's the first one, the original! Don't buy a
Special offer : ALL TOOLS , just $35 each! New tools   will be   $30   for the   first week   or the   first 3 purchases !  Trading Tools Channel on MQL5 : Join my MQL5 channel to update the latest news from me The Volumetric Order Blocks Multi Timeframe indicator is a powerful tool designed for traders who seek deeper insights into market behavior by identifying key price areas where significant market participants accumulate orders. These areas, known as Volumetric Order Blocks, can serve as
Filter:
No reviews
Reply to review