
MQL5 Wizard Techniques you should know (Part 78): Gator and AD Oscillator Strategies for Market Resilience
Introduction
In our last article we introduced 5 signal patterns from the pairing of the Gator and the Accumulation/Distribution oscillators, in this article we consider the final 5 of this set of 10. We have been looking at 10 signal patterns for each indicator pairing, and we will be maintaining this format. From the testing in the last article which was done on the pair GBP JPY on the 30-minute timeframe, our results indicated that the patterns 0, 3, and 4 struggled to forward walk, however before we can choose what to improve with supervised learning, let's complete examining and testing of patterns 5 to 9.
False Breakout / Trend Trap (Gator Signal Without Volume Confirmation)
Pattern-5 is based on a trend trap or a breakout that does not materialize. In the bullish scenario, we have a bull trap, where not every ‘awakening’ of the gator leads to a bullish trend - the case for head fakes. A common bull-trap can occur when the gator oscillator starts to indicate a trend signal, such as when one of the histograms flips green after a multi-bar period of red suggesting an upward trend, however the AD line fails to rise accordingly. In this bull-trap, price could poke above a resistance, with the gator oscillator reflecting that initial move as the jaws/teeth/lips slightly part ways. Nonetheless, the AD would remain flat or even decline, bespeaking a lack of real accumulation.
If following this, price doesn’t break down after the ‘trap’ and instead quickly reclaims the breakout zone with the gator oscillator mouth still open and the AD on ascendancy, this can imply the trap was a shakeout. If price resumes upward with double confirmation of the oscillators, this can be your bullish trigger. This can be thought of when the ‘bull-trap’ traps the shorts and provides rocket fuel for a genuine breakout. We implement this in MQL5 as follows:
//+------------------------------------------------------------------+
//| Check for Pattern 5.                                             |
//+------------------------------------------------------------------+
bool CSignalGator_AD::IsPattern_5(ENUM_POSITION_TYPE T)
{  if
   (
      clrRed == Color_UP(m_gator, X() + 1) &&
      clrGreen == Color_LO(m_gator, X() + 1) &&
      clrRed == Color_UP(m_gator, X()) &&
      clrGreen == Color_LO(m_gator, X())
   )
   {  if
      (
         T == POSITION_TYPE_BUY &&
         Close(X()) > High(X() + 1) &&
         Close(X()) > High(X() + 2) &&
         AD(X()) >= AD_Max(X() + 1, 2)
      )
      {  return(true);
      }
      else if
      (
         T == POSITION_TYPE_SELL &&
         Close(X()) < Low(X() + 1) &&
         Close(X()) < Low(X() + 2) &&
         AD(X()) <= AD_Min(X() + 1, 2)
      )
      {  return(true);
      }
   }
   return(false);
}
The bearish scenario similarly is when the gator gives bearish indication without volume confirmation via the AD. In these cases price may briefly break support with the gator showing an awakening downward. If the AD does not drop from a lack of distribution volume or even surges slightly, this would mean the breakdown is on shaky ground. The smart money is not selling heavily, possibly buying the dip. In the interim, the lack of AD confirmation suggests the current downtrend may fail. The price would snap back up, and catch a few traders off guard, which in turn would trap some in thinking the downtrend will not materialize. If, however, price does revert downward as indicated in our code above and the AD also comes on board, we would have a bearish position. Testing for this pattern gave us the following report, which indicated we were able to forward walk profitably, for the most part although towards the later 6-months of 2025, our equity curve was effectively flat.
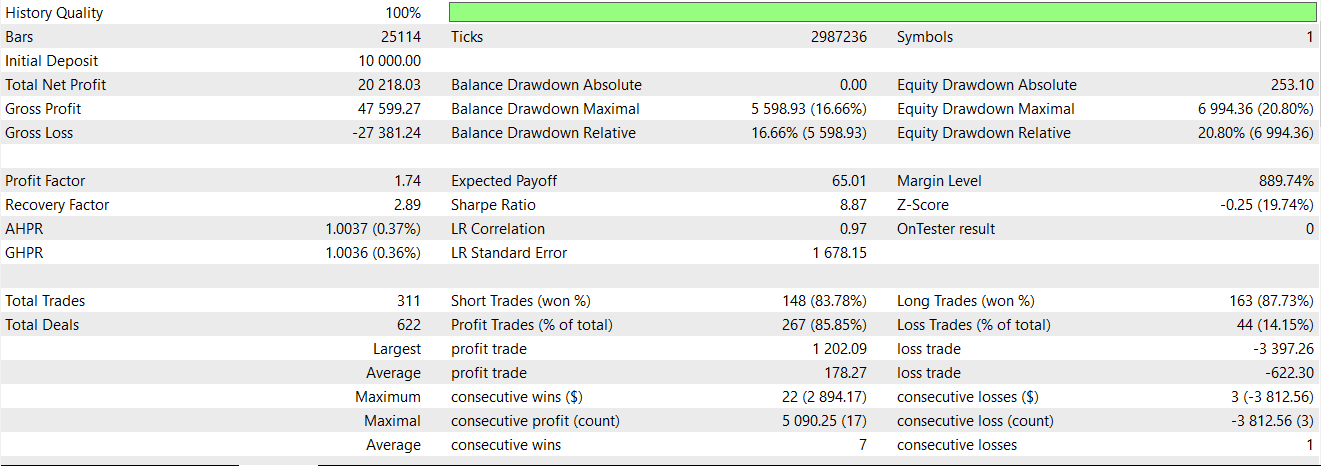
Strengths for this pattern would be its way of implementing the volume-filter with the gator. The gator may react to price movements, but it's the AD that tells us if that movement has substance. Many technical traders fall into the trap of taking every breakout or trend crossover; the AD alignment, in spite of indicative price action, avoids many losing many trades. In practice, the use of this pairing should lead to a lot of most signals being passed on, however in our case we were able to put on considerably more trades. Spotting a trap can also allow contrarian trades, such as the fading breakout. If one spots a classic volume divergence on a breakout, i.e. high price with no AD rise, they could explore taking a counter position with a tight stop.
On the weakness side, pattern-5 faces the challenge that sometimes real breakouts begin with only slight volume increases, with the AD lagging initially. Very strict traders can thus miss legitimate trades given that the volume confirmation would be lagging. There is always a fine line between a false breakout that hasn’t picked up volume yet. In addition, the AD itself could yield false signals, such as if a single large volume spike happens on a candle with no price change. This could have the AD jump in a way that is not indicative of a trend. More importantly, though, market context matters. During particular events, such as central bank interventions or surprise geopolitical decisions, prices can move violently on low recorded volume and continue their swings because liquidity would have evaporated. The AD might not confirm in its usual way, yet you wouldn’t want to be on the wrong end of these moves. Therefore, rigidly ignoring all gator signals lacking immediate volume confirmation can fail in exceptional cases. Another minor weakness is the reliance on tick-data, especially in forex implies if your broker’s tick data is off then AD can be misleading.
In practice, implementing volume confirmation as a rule in your strategy is paramount. Once a potential trap is identified, one can either avoid trading or, if experienced, trade against the breakout on failure confirmation, for instance if price falls back into a range. Using tight stops with this pattern, or traps, ensures if you’re wrong and the move was real but just delayed in volume, the market gets to prove it quickly. Pattern-5 can be crucial around key chart levels, such as major highs/lows, historic/Fibonacci levels, where smart money might ‘fake’ a break to trigger stops and then reverse. By watching the AD, one gets a sense of whether these large players are following through or just probing liquidity. Finally, the supplementing a news-filter. Given erratic volume readings around scheduled news events, traders can either skip entry or wait for the dust to settle.
Range Accumulation/Distribution (Gator Sleeping + A/D Bias foreshadowing Breakout)
Pattern-6 has its bullish signal defined in an accumulation range. When a market is whipsawing, in low volatility with Alligator lines frequently crossing, the gator oscillator often shows histograms as predominantly red - the gator sleeping for lack of a clear trend. In these situations, price oscillates in almost a horizontal channel, and while the gator gives no signal, the AD can point to a bullish bias building under the surface. If in this price ranging, the AD line is slowly and steadily rising, it does mean that on balance more volume is flowing into up-moves than the down ones. This is despite price not breaking out. This accumulation phase is often a powerful clue that bullish interests are positioning. Strong players could be using the quiet range to buy without moving price much.
When the gator is flat with no trend, but AD is trending up on up, one should expect that the next significant move is likely to be a bullish breakout. The price ranging is likely to resolve to the upside as latent buying pressure is unleashed. A trader might not act until the breakout occurs in order to avoid false starts however they will be biased to go long, or even accumulate on existing long positions when at the price range support, in anticipation of the eventual upside break. We implement this in MQL5 as follows:
//+------------------------------------------------------------------+
//| Check for Pattern 6.                                             |
//+------------------------------------------------------------------+
bool CSignalGator_AD::IsPattern_6(ENUM_POSITION_TYPE T)
{  if
   (
      clrRed == Color_UP(m_gator, X() + 1) &&
      clrRed == Color_LO(m_gator, X() + 1) &&
      clrRed == Color_UP(m_gator, X()) &&
      clrGreen == Color_LO(m_gator, X())
   )
   {  if
      (
         T == POSITION_TYPE_BUY &&
         Close(X()) > High(X() + 1) &&
         Close(X()) > High(X() + 2) &&
         AD(X()) >= AD_Max(X() + 1, 2)
      )
      {  return(true);
      }
      else if
      (
         T == POSITION_TYPE_SELL &&
         Close(X()) < Low(X() + 1) &&
         Close(X()) < Low(X() + 2) &&
         AD(X()) <= AD_Min(X() + 1, 2)
      )
      {  return(true);
      }
   }
   return(false);
}
For the bearish in-range-distribution, it occurs in a sideways consolidation following an uptrend or within a broad range. Once the AD is gradually declining with price staying range-bound, it should indicate distribution. The smart money could be offloading into the rallies quietly - volume on down-swings outweighing that on up-swings, even though price has not capitulated. The gator would remain asleep with the up and down bars indicating red, a sign we do not have a trend. However, the falling AD would be warning that once the range breaks, it will most likely be to the downside.
Traders who are observing this can prepare for a bearish resolution - for example they could avoid long trades in the range and look to short a break of support since there is some proof of sustained selling in the background. This AD bias can precede the actual breakdown, essentially giving traders a heads-up that the path of least resistance is down. Our testing pattern-6, gives us the following report:
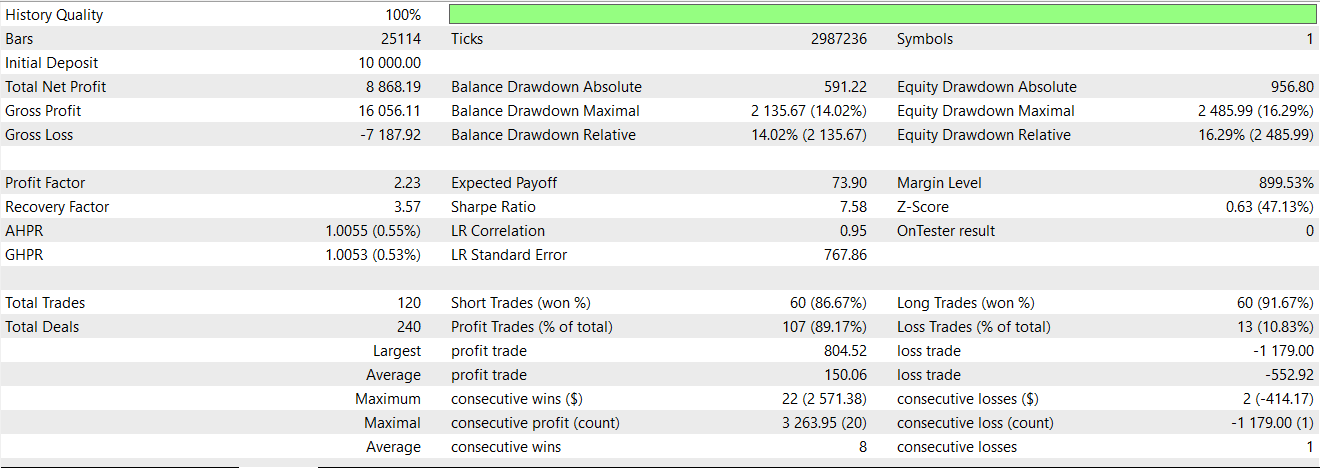
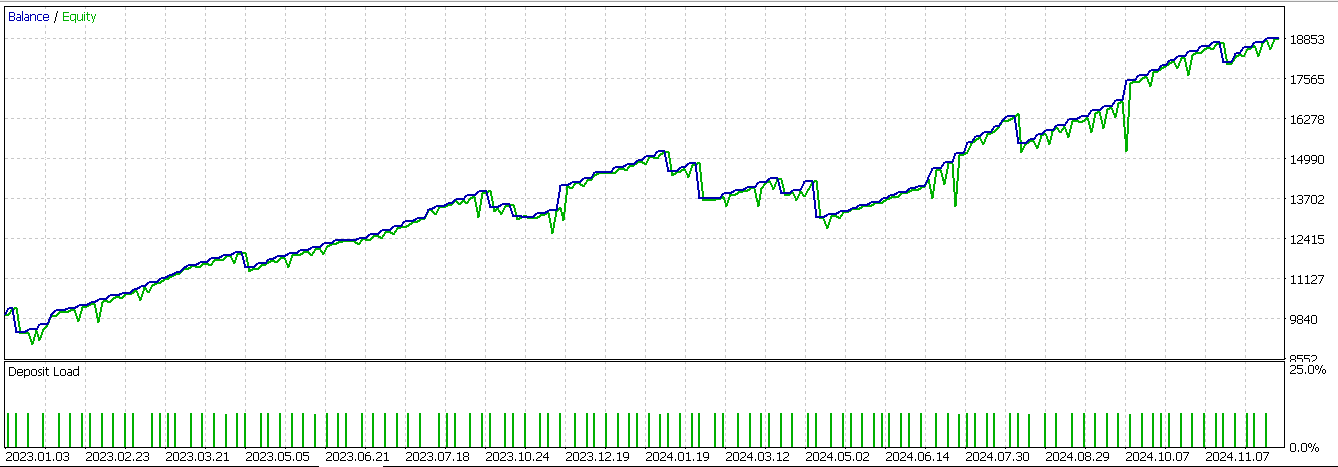
This signal pattern does walk forward profitably, perhaps better than all the prior 6 we have looked at (from 0-5). Its strengths could arguably come from seeing the footprints of institutional players. Even though price may slumber by moving sideways, volume could be counted on for telling the true story - accumulation/distribution in ranges often precede big moves. By using the AD in conjunction with a non-trending gator, you can get an edge in predicting breakouts’ direction. Many traders tend to treat all ranges the same, by waiting for a breakout in either direction, however in the case of pattern-6 one tilts the odds in his favour by knowing which side is being favoured by the volume.
The strength therefore of this signal pattern is that it's a relatively low-risk insight, given that during a price range, one can accumulate a position in the direction pointed to by the AD or simply be ready to pounce with a tight stop at the opposite end of the range. When the breakout occurs as anticipated, you will be in early. Furthermore, this helps avoid fake outs in the opposite direction - for instance when presented with clear evidence of accumulation and price dips briefly under support, plus the gator flickers green on the lower histogram, you would be sceptical of that breakdown. Indeed, often price reverses violently. In forex, given the decentralized volume structure, this pattern could still hold with our use of tick-volume. Consider this, across a Tokyo market price ranging of the EUR GBP, if the tick-AD creeps up all night while price is flat, usually the London session gets to see a bullish move.
On the weakness side for pattern-6, there is a limitation in that the AD can drift gradually without being extreme enough to be detected. Small upward or downward slopes in AD can potentially be noise, so a trader needs some skill in order to distinguish meaningfully accumulation from random fluctuation. In addition, ranges tend to las a long time - the AD could be rising, however if no breakout catalyst appears, price could continue in its range with possibly the volume range even reversing if interim news is impactful. It's possible to get a ‘false bias’ for instance if early in a range the AD rose, but later on bigger players started selling. One would therefore need to update their read continuously.
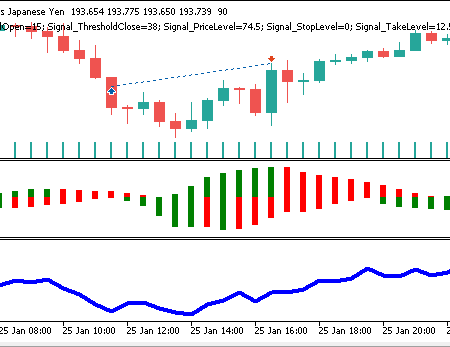
Another weakness is that this is not a precise timing signal. It only informs you of the likely direction, not when the breakout will happen. One could be biased correctly, but still end up suffering whipsaws within the range before the move comes. For example, a forex pair can accumulate for weeks, with AD rising, and yet if you try going long too soon you get chopped up when placing a tight stop just outside the range. Finally, in certain instances like price ranges during news uncertainty, both accumulation and distribution happen in different parts of the range, making volume ambiguous. This method therefore may not give a clear bias. The bullish signal on a chart for pattern 6 could appear as follows:
Hidden Volume Divergence (Hidden Bull/Bear with Gator Confirmation of Trend)
Pattern-7, as its name suggests above, is based on hidden volume divergence. The bullish hidden divergence is typically a trend continuation pattern. It occurs during a corrective dip in an uptrend - price making a higher low with the pullback not going below a prior swing low, leaving the uptrend structure intact. With this backdrop, the AD line would make a lower low at the same points. This means the second dip had more selling volume than the first, and yet sellers were not able to push price to a lower low. This is then taken as a sign of underlying strength, since buyers are able to absorb the extra volume.
In essence, the market had a stronger selling effort but held above the prior low, implying the move down was countered by strong buying. The gator oscillator in this scenario would likely reflect the trend still being bullish overall. For instance, in the pullback the gator might indicate some red histograms, since momentum dipped, however the jaws/teeth/lips buffers would remain in bullish alignment despite some contraction from one of their pair gaps. Once price begins moving higher from the higher low, gator will quickly flip back to green bars and resume eating upward as confirmation that the main uptrend is resuming. The hidden divergence of AD making lower lows while price makes higher lows is the volume based clue that bulls quietly dominated the dip. This pattern therefore signals a high probability continuation long since weak hands were shaken out, but smart money is buying. We implement this in MQL5 as follows:
//+------------------------------------------------------------------+
//| Check for Pattern 7.                                             |
//+------------------------------------------------------------------+
bool CSignalGator_AD::IsPattern_7(ENUM_POSITION_TYPE T)
{  if
   (
      clrRed == Color_UP(m_gator, X() + 1) &&
      clrRed == Color_LO(m_gator, X() + 1) &&
      clrGreen == Color_UP(m_gator, X()) &&
      clrGreen == Color_LO(m_gator, X())
   )
   {  if
      (
         T == POSITION_TYPE_BUY &&
         Low(X() + 2) > Low(X() + 1) &&
         Close(X()) > Low(X() + 1) &&
         AD(X()) >= AD_Max(X() + 1, 2)
      )
      {  return(true);
      }
      else if
      (
         T == POSITION_TYPE_SELL &&
         High(X() + 2) < High(X() + 1) &&
         Close(X()) < High(X() + 1) &&
         AD(X()) <= AD_Min(X() + 1, 2)
      )
      {  return(true);
      }
   }
   return(false);
}
With the bearish trend continuation hidden divergence, we have a downtrend with hidden bearish divergence appearing on a relief rally. Price makes a lower high by failing to get to the height of the prior swing, maintaining the downtrend. However, AD does make a higher high on that rally. The interpretation of this being that there was even more accumulation volume on the second bounce than the first, yet buyers couldn’t drive price to a higher high. This serves as an indication of underlying weakness, given that selling interest is absorbing volume. Put differently, despite significant buying the price recovery was shallow, and this is bearish. The gator would show the downtrend as still broadly in force, probably with just one histogram turning red, if at all, during the momentum blip.
The MA buffers of jaws-teeth-lips would maintain their bearish stack or quickly revert to a bearish alignment. Once the price turns downward from the lower high, gator’s histograms would match green on the top and bottom since the gator has resumed eating, on the downtrend, confirming the continuation. The hidden divergence here is the AD making a higher high while price makes a lower high, signalling a prime opportunity to continue shorting the downtrend, given that it suggests the bulls’ push lacked effect and the path is clear for sellers to regain control. Our testing of pattern-7 gave us the following report:
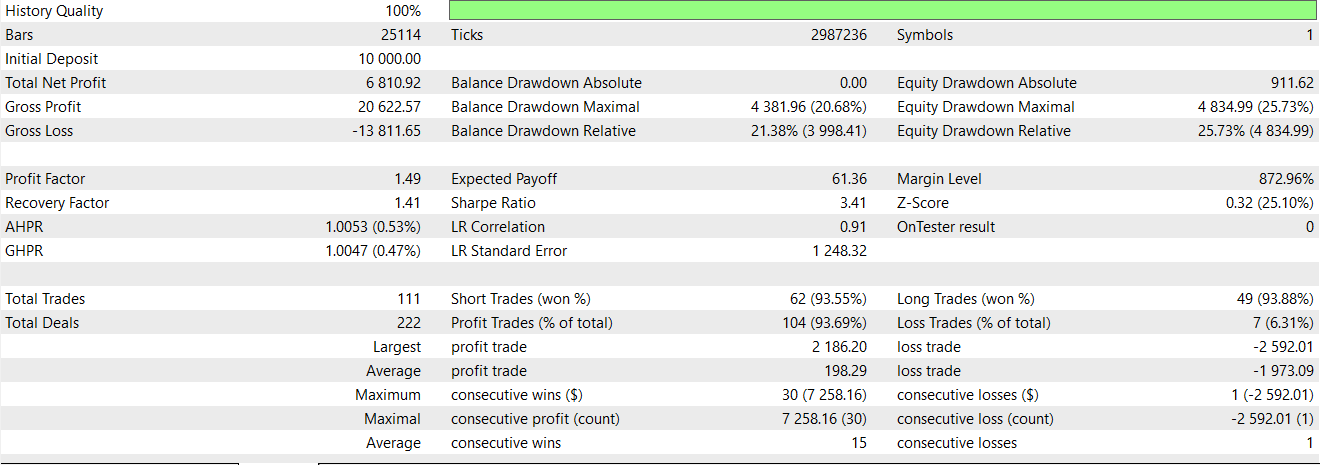
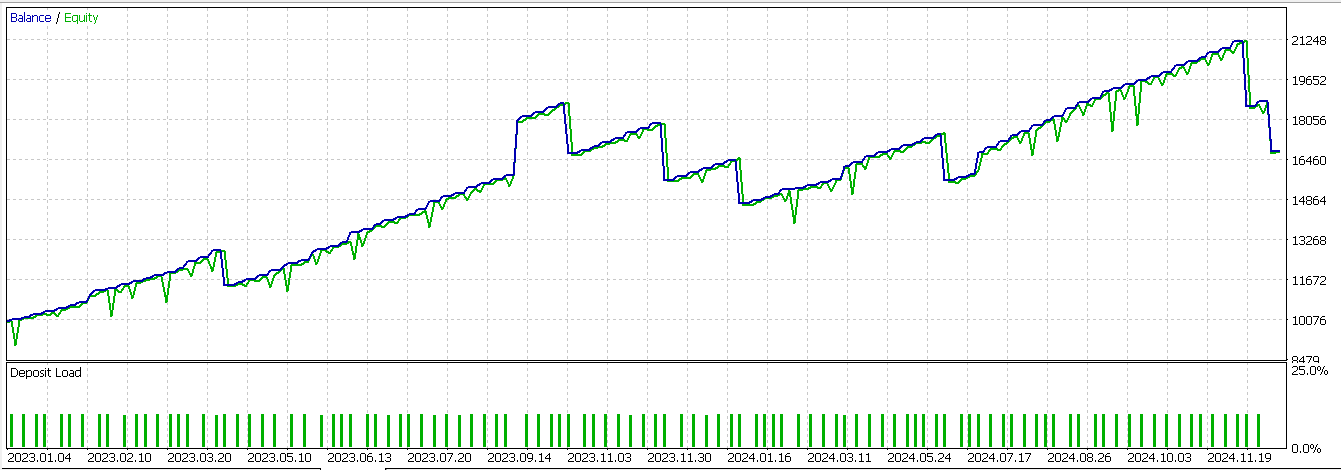
Pattern-7 is also able to forward walk profitably, almost as well as pattern-6. Its strengths can be argued to come from the thesis that hidden divergences precede strong trend continuation moves because they reveal trend resilience. The prevailing trend tends to hold firm despite opposing volume pressure. Using AD to identify hidden divergence does add a volume dimension to the classic momentum-based hidden divergence. Volume does not lie, as they say. If massive volume could not break trend structure, this often means the remaining side will return, but even stronger. This pattern can be well suited for re-entry when in a trend before a breakout to new extremes materializes. You would be effectively observing that the counter-trend move was hollow. Gator’s role in this situation is to see to it that the trend indeed remained intact. As long as the gator buffers of jaws-teeth-lips did not reverse and also the gator never went to sustained dual-red aka sleep mode, it shows that the trend simply took a breather.
Thus, bringing the gator and the AD oscillator’s hidden divergence together filters for the best continuation setups. In forex, these usually occur around important Fibonacci retracement levels. For instance, a forex pair in an uptrend that pulls to a higher low at 50% retracement with high volume implies a lot of trading happened however price did not break support, and therefore it continues to rocket up. Traders who see the AD drop further than price, such as in a hidden bull divergence, can buy that support with confidence and catch the next wave.
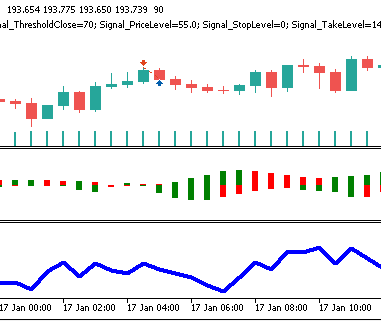
Pattern-7’s weaknesses are that the hidden divergence can be more difficult to identify than regular divergence. This is because it is more subtle given that price action does not make dramatic new extremes, these honours belong to the indicator. There is therefore a risk of misreading normal volume surges as hidden divergence. For example, in a healthy uptrend pullback volume often increases and the AD dip lower simply because more volume transacted on the down move, however this does not always mean bulls are in trouble. It may just be a shakeout. One must therefore always confirm price held higher low, firmly. A chart representation of a short signal for this pattern can appear as follows:
Alligator Crossover Reversal + Volume Spike (Major Trend Flip Signal)
Our penultimate pattern, pattern-8, is based on the gator crossover reversal. In the bullish setup, this signal-pattern spots a major trend reversal point by bringing together a clear gator crossover with a strong volume clue. The bullish case begins to unfold at the end of a prominent downtrend. First, the gator’s jaws-teeth-lips perform a bullish crossover. The usually green lips would cross above the red teeth and the blue jaw from below, portending that momentum has swung upward, and a potential new uptrend is starting up. The gator oscillator, for its part, will show its histograms shrinking in size about the zero-bound as the lines converge. This would be followed with a colour flip to green as the lines re-order bullishly. This gator awakening and then eating in the opposite direction does mark a definitive trend flip.
Now, volume confirmation does come from the AD line, and ideally at the time of or just before the crossover. The AD registers a notable bullish volume spike or an extreme high relative to recent levels, marking a surge of buy volume that is accompanied the change in trend. For example, it could be that a capitulation in the bottom occurred with huge volume and then price made a reversal upward, crossing the jaws-teeth-lips MAs, with also the AD line shooting up from this volume-event, underscoring genuine buying interest.
The combination of the jaws-teeth-lips crossover, a foundational buy signal, with an AD volume climax or break to the upside tends to produce one of the strongest bullish reversal signals. It suggests that not only have prices turned, but that the turn move has the backing of significant volume, such as in situations where institutions step in. Traders can confidently go long on this pattern as it often kicks off a sustained trend upwards. We implement pattern-8 as follows in MQL5:
//+------------------------------------------------------------------+
//| Check for Pattern 8.                                             |
//+------------------------------------------------------------------+
bool CSignalGator_AD::IsPattern_8(ENUM_POSITION_TYPE T)
{  if
   (
      clrRed == Color_UP(m_gator, X()) &&
      clrRed == Color_LO(m_gator, X()) &&
      STD_DEV(X()) <= fmax(Gator_UP(m_gator, X()), Gator_LO(m_gator, X())) &&
      5.0*STD_DEV(X()) > (AD_Max(X() + 1, 2) - AD_Min(X() + 1, 2))
   )
   {  if
      (
         T == POSITION_TYPE_BUY &&
         Close(X()) > 0.5 * (High(X() + 1) + Low(X() + 1)) &&
         AD(X()) > AD(X() + 1)
      )
      {  return(true);
      }
      else if
      (
         T == POSITION_TYPE_SELL &&
         Close(X()) < 0.5 * (High(X() + 1) + Low(X() + 1)) &&
         AD(X()) < AD(X() + 1)
      )
      {  return(true);
      }
   }
   return(false);
}
The bearish setup, the flip side of what we have just covered, features a major bearish reversal that is signalled when a strong uptrend ends with a jaws-teeth-lips crossover to a negative slope coupled with a volume spike. The lips would cross to below the teeth and the jaw from above, reversing the lines' hierarchy, setting up a bearish posture. The gator oscillator at this time would have a contraction followed by the histograms flipping green, on the upper and lower, indicating a developing downtrend. In order to be certain, this is not a whipsaw, but a genuine trend-flip, we would look to the AD. A significant drop or negative spike in the AD line around the crossover would add confirmation that large scale selling (or distribution) is in play. Usually this is seen when a climax top forms - often a final surge in price on high volume that immediately reverses, dropping price through the MA buffers.
AD would have likely shown a peak followed by a dramatic fall, or at least a break of its uptrend line. This signals that distribution is in control. When the gator MA buffers cross to bearish and volume indicates a big exit by the bulls, and the stage is set for a meaningful downtrend. Traders can therefore initiate short positions on this pattern, effectively catching the early phase of a new bearish trend. Testing of pattern-8 presents us with the following report:
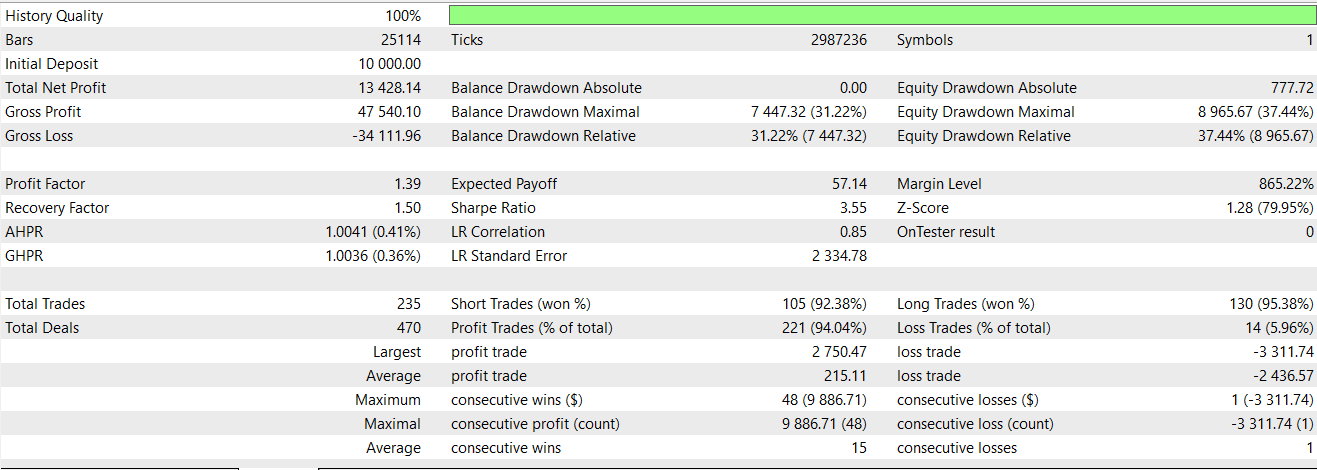
Pattern-8 is one of our busier signals, by placing a significant number of trades, and its equity curve has choppy sections, however it is able to effectively forward walk profitably. The strengths of this pattern are firstly that it marries a clear, rule-based trend reversal trigger with volume validation. As jejune as this may sound, each element covers the other’s weaknesses. The gator crossovers by themselves can sometimes be late or false in markets that are whipsawed, however, adding the requirement of a volume spike ensures we act on crosses that matter - those with strong volume behind the move.
Conversely, volume spikes alone could mark turning points. However, sometimes they occur during events without follow-through, thus requiring the trend structure to actually change via crossover. This filters out volume spikes that don’t lead to trend reversals. This synergy is key at grabbing the exact moment of regime change in the market. It's compelling on higher timeframes, larger than H4. For example, a classic scenario is that after a long decline a huge bullish engulfing candle on a lot of volume can cause the gator MA buffers to converge and cross a text book reversal that often launches multi-session rallies.
The strength here is also psychological. Many trend followers won’t believe in a trend change until much later. However, the volume and crossovers a trader can make early entry since the gator awakes and starts feeding. This can result in favourable risk-reward since the stops can be placed just beyond the pivot, with potentially the new trend running far from it.
Multi-Timeframe Alignment (Higher-Timeframe Gator Trend + Lower-Timeframe Volume Entry)
Our final signal pattern is multi-timeframe based. The bullish alignment is more of a strategic setup that leverages 2 timeframes in order to improve signal reliability. In a higher timeframe such as the H4 vs the M30 that we are primarily using for testing, if the gator oscillator is in a clear eating phase on both timeframes or at least awakening upwards from a slumber in the larger timeframe, the H4, this can emphasize an upward trend bias is in play on the macro. Once the AD shows accumulation, say over several weeks, on your primary smaller timeframe, one would wait for a bullish gator-volume signal that is in alignment with the bigger trend.
For instance, the lower timeframe could have a pullback or consolidation where the gator is sleeping. This can give way to a bullish breakout like signal pattern-1 or a pullback continuation such as pattern-3 in the direction of the higher timeframe trend. AD confirmation would be confirmed on the lower or primary timeframe. This alignment - a smaller pattern that is bullish and happening inside a larger bullish trend - significantly increases the odds of success. Basically, the higher timeframe gator acts as another trend filter by providing trend affirmation, with the lower timeframe AD providing a precise volume-confirmed entry. Another solid forex illustration of this could be on the H4 chart of the GBP JPY, if it is in an uptrend with the gator MAs fanning long, and AD trending up, then on our M30 primary a local AD spike can have one go long with more certainty since trading is in the dominant trend. We code this in MQL5 as follows:
//+------------------------------------------------------------------+
//| Check for Pattern 9.                                             |
//+------------------------------------------------------------------+
bool CSignalGator_AD::IsPattern_9(ENUM_POSITION_TYPE T)
{  if
   (
      clrGreen == Color_UP(m_gator, X()) &&
      clrGreen == Color_LO(m_gator, X()) &&
      (clrGreen == Color_UP(m_gator_h4, X())
      ||
      clrGreen == Color_LO(m_gator_h4, X()))
   )
   {  //printf(__FUNCSIG__+" close- "+DoubleToString(Close(X()))+", range- "+DoubleToString(0.5 * (High(X() + 1) + Low(X() + 1))));
      if
      (
         T == POSITION_TYPE_BUY &&
         Close(X()) > High(X() + 1) &&
         AD(X()) < AD(X() + 1) &&
         CloseH4(X()) > CloseH4(X() + 1)
      )
      {  return(true);
      }
      else if
      (
         T == POSITION_TYPE_SELL &&
         Close(X()) < Low(X() + 1) &&
         AD(X()) < AD(X() + 1) &&
         CloseH4(X()) < CloseH4(X() + 1)
      )
      {  return(true);
      }
   }
   return(false);
}
The bearish alignment, similarly, indicates a short condition of a downtrend with consistent distribution on the larger timeframe. This indicates a trending gator with distribution on the AD. The gator our primary indicator being trend neutral means we have to check price action on the two timeframes as shown in the implementation above. There could be a minor rally that ends with a bearish divergence as shown in pattern-8 or a small range that breaks down with gator awakening as illustrated in pattern-l.
It can also be any of the lower timeframe chart earlier bearish patterns taking hold while the guide/macro timeframe is indicating conditions are favouring sellers. Executing a short in such circumstances stacks the odds in favour of the trade. The volume confirmation on the execution timeframe means that the immediate move is valid, while the higher timeframe gator ensures the move is not against the broader flow. Our testing gives us the report below that is able to forward walk profitably.
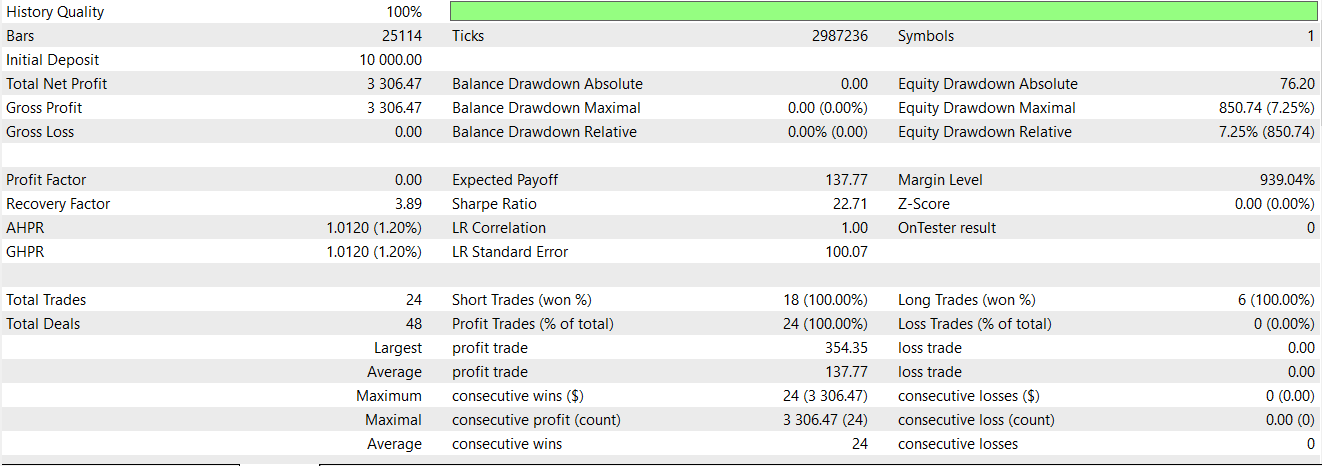
When implementing this, it is important to keep in mind that the goal is to synchronize, but not paralyse. When managing trades, it may be a good idea to scale out, by taking partial profits at the lower timeframe’s typical take-profit target. It's also important to always account for the higher timeframe’s volatility, as large ATR values would probably imply smaller position sizing. Pattern-9 is an approach that aims to ensure all signals are taken in context to yield more robust trading decisions.
Conclusion
To wrap up, we have examined the final 5 signal patterns of the gator oscillator and the accumulation/distribution oscillator. This has encompassed topics of handling false breakouts, managing accumulation in ranges, dealing with hidden divergences, coping with major trend reversals, multi-timeframe alignment, to mention but a few. It would appear these setups do enhance performance, as they were all able to forward walk profitably. The usual caveats apply in interpreting the short window test reports we post here. In the next article, we will try to see what supervised learning can do for our laggard patterns 0,3, and 4 already considered in the last article.
| name | description |
|---|---|
| wz-77.mq5 | Wizard assembled Expert Advisor whose header lists files included |
| SignalWZ_77.mqh | Custom signal Class file for use with MQL5 Wizard. Use Guide is here. |
Warning: All rights to these materials are reserved by MetaQuotes Ltd. Copying or reprinting of these materials in whole or in part is prohibited.
This article was written by a user of the site and reflects their personal views. MetaQuotes Ltd is not responsible for the accuracy of the information presented, nor for any consequences resulting from the use of the solutions, strategies or recommendations described.
 Self Optimizing Expert Advisors in MQL5 (Part 11): A Gentle Introduction to the Fundamentals of Linear Algebra
 Price Action Analysis Toolkit Development (Part 35): Training and Deploying Predictive Models
 From Novice to Expert: Animated News Headline Using MQL5 (VIII) — Quick Trade Buttons for News Trading
 Expert Advisor based on the universal MLP approximator
- Free trading apps
- Over 8,000 signals for copying
- Economic news for exploring financial markets
You agree to website policy and terms of use