Trading Insights Through Volume: Moving Beyond OHLC Charts
Introduction
In the field of technical analysis, traders have historically relied on price fluctuations as their primary indicator of market activity. This work presents a unique methodology that combines advanced mathematical analysis of volume with machine learning techniques, with an emphasis on how volume patterns may provide deeper insights into market dynamics. We provide a sophisticated system that exceeds conventional technical analysis methods by combining LSTM neural networks with calculus-based volume derivatives. The article is broken up into three main sections: the first discusses the fundamental importance of volume analysis and its mathematical bases; the second examines the practical applications of volume derivatives and LSTM predictions in identifying market opportunities; and the third explains how volume divergence analysis, trend confirmation, and breakout validation can be used to enhance trading decisions.Understanding Volume's Core Function
The total number of shares or contracts traded during a specific time period is known as volume, and it is a crucial indicator of market activity and liquidity. While price shows the market's direction, volume shows the confidence behind a market movement, highlighting the underlying strength and durability of trends. It is the force behind price action and has the ability to support or contradict price movements since significant price changes with high volume frequently indicate higher levels of market confidence than those with little volume. Furthermore, volume patterns often predict price changes, making them valuable indications for traders who understand how to use them in conjunction with price action and market context. Why Volume Matters
Simple Example:
The crucial importance of volume analysis may be demonstrated using a sophisticated mathematical technique that goes beyond standard analysis, providing traders with a more advanced framework for comprehending market dynamics than is possible with conventional indicators alone. By focusing just on volume dynamics, independent of OHLC data, we can find important market insights through the use of calculus and machine learning, with a special emphasis on volume derivatives and LSTM neural networks. This novel method uses sophisticated mathematical ideas to identify minute shifts in trade and market participation, giving early warnings of possible market movements before they show up in price action.
Traders may detect new trends and possible reversals more precisely than is possible with conventional volume analysis techniques by looking at the rate of change in volume (first derivative) and its acceleration (second derivative) in conjunction with machine learning forecasts. When applied correctly, this mathematical basis provides a strong approach to market analysis that might be especially helpful in today's algorithmically driven markets, when conventional technical analysis might not be sufficient.
This method looks at three important volume components: the first derivative (rate of volume change), the second derivative (acceleration of volume change), and LSTM projections of future volume that confirm the same volume derivates. By removing pricing noise, this approach focuses solely on market participation dynamics.
The EA begins with standard MetaTrader declarations. It includes the Trade library for order management and the custom Volume_LSTM library for predictions. The indicator_separate_window property indicates this will display in a separate window, and it allocates three indicator buffers for visualization.#property copyright "Your Name" #property version "1.00" #property strict #property indicator_separate_window #property indicator_buffers 3 #include <Trade\Trade.mqh> #include <Volume_LSTM.mqh> CTrade trade;
The parameters are organized into logical groups. The LSTM configuration section controls the neural network behavior, while the entry parameters manage the trading rules. Each parameter has a specific purpose: the LSTM parameters control the prediction model's complexity and memory. The trading parameters define position sizing and profit targets and the risk management parameters set loss limits and trailing stops.
input group "Configuración LSTM"
input bool     UseLSTM = true;
input int      LSTMHiddenSize = 32;
input int      LSTMLookback = 10;

input group "Entry Parameters"
input double   Lots = 0.1;
input double   TPPoints = 100;
input int      Periods = 4;
input int      AccelBars = 4;
input int      MaxBarsInTrade = 2;
input double   ProfitClose = 15;
input double   MaxDailyLoss = -25;
input double   TrailingStart = 5;
input double   TrailingStep = 5;
This function calculates the rate of change in volume (first derivative) and the acceleration of volume change (second derivative). It shifts existing derivatives to maintain history, calculates new first derivative as the difference between current and previous volume, calculates new second derivative as the change in first derivatives and provides insights into volume momentum and acceleration.
By looking at the first derivative of volume, we are essentially tracking whether trading activity is increasing or decreasing over time. This pattern of volume fluctuation gives us our first layer of insight into market momentum. A consistently positive first derivative suggests increasing market interest, whereas a negative one suggests decreasing engagement.
void CalculateDerivatives() {
    for(int i = 0; i < ArraySize(volumes)-1; i++) {
        firstDerivative[i] = firstDerivative[i+1];
        secondDerivative[i] = secondDerivative[i+1];
    }

    firstDerivative[ArraySize(volumes)-1] = volumes[ArraySize(volumes)-1] - volumes[ArraySize(volumes)-2];
    secondDerivative[ArraySize(volumes)-1] = firstDerivative[ArraySize(volumes)-1] - firstDerivative[ArraySize(volumes)-2];
}
These functions manage the trade lifecycle, TrackNewTrade records new positions in the first available slot, RemoveTrade clears the record when positions are closed. Both functions maintain the integrity of the trade tracking system.
void TrackNewTrade(ulong ticket) {
    for(int i = 0; i < ArraySize(openTrades); i++) {
        if(openTrades[i].ticket == 0) {
            openTrades[i].ticket = ticket;
            openTrades[i].openTime = TimeCurrent();
            openTrades[i].barsOpen = 0;
            break;
        }
    }
}

void RemoveTrade(ulong ticket) {
    for(int i = 0; i < ArraySize(openTrades); i++) {
        if(openTrades[i].ticket == ticket) {
            openTrades[i].ticket = 0;
            openTrades[i].openTime = 0;
            openTrades[i].barsOpen = 0;
            break;
        }
    }
}
This profit tracking function:
- Identifies the current trading day
- Calculates realized profit from closed trades
- Adds unrealized profit from open positions
- Maintains daily profit tracking across multiple trades
- Helps enforce daily loss limits
double GetDailyProfit() {
    datetime today = StringToTime(TimeToString(TimeCurrent(), TIME_DATE));

    if(lastDayChecked != today) {
        lastDayChecked = today;
        dailyProfit = 0;

        HistorySelect(today, TimeCurrent());
        int deals = HistoryDealsTotal();

        for(int i = 0; i < deals; i++) {
            ulong ticket = HistoryDealGetTicket(i);
            if(ticket > 0) {
                if(HistoryDealGetString(ticket, DEAL_SYMBOL) == _Symbol)
                    dailyProfit += HistoryDealGetDouble(ticket, DEAL_PROFIT);
            }
        }
    }

    // Add floating P/L
    double floatingProfit = 0;
    for(int i = PositionsTotal() - 1; i >= 0; i--) {
        ulong ticket = PositionGetTicket(i);
        if(ticket > 0 && PositionSelectByTicket(ticket)) {
            if(PositionGetString(POSITION_SYMBOL) == _Symbol)
                floatingProfit += PositionGetDouble(POSITION_PROFIT);
        }
    }

    return dailyProfit + floatingProfit;
}
The trailing stop function:
- Iterates through all open positions
- Calculates profit in points for each position
- Updates stop loss levels based on profit
- Implements a trailing mechanism to lock in profits
- Handles both buy and sell positions differently
void ApplyTrailingStop(double point) {
    for(int i = PositionsTotal() - 1; i >= 0; i--) {
        ulong ticket = PositionGetTicket(i);
        if(ticket <= 0) continue;

        if(PositionSelectByTicket(ticket)) {
            double openPrice = PositionGetDouble(POSITION_PRICE_OPEN);
            double currentPrice = PositionGetDouble(POSITION_PRICE_CURRENT);
            double currentSL = PositionGetDouble(POSITION_SL);
            long posType = PositionGetInteger(POSITION_TYPE);

            // Calculate and update trailing stop
            double profitPoints;
            if(posType == POSITION_TYPE_BUY) {
                profitPoints = (currentPrice - openPrice) / point;
                if(profitPoints >= TrailingStart) {
                    double newSL = openPrice + (profitPoints - TrailingStep) * point;
                    if(currentSL < newSL || currentSL == 0) {
                        trade.PositionModify(ticket, newSL, PositionGetDouble(POSITION_TP));
                    }
                }
            }
            // Similar logic for SELL positions
        }
    }
}
By showing the acceleration or slowdown of trade activity, the second derivative of volume provides even more detailed information. A positive value for this second derivative is a strong indication of growing market momentum as it shows that volume is rising and doing so at an accelerating rate. Because it indicates quickly increasing market participant interest, this volume acceleration frequently occurs before notable market movements. We provide a strong framework for predicting market behavior by fusing these derivatives with LSTM neural network predictions of future volume patterns. Our study gains an extra layer of validation from the LSTM's capacity to identify intricate patterns in volume sequences, which aids in determining if the observed volume trends are likely to persist.
The main trading logic:
- Checks for new bar formation
- Verifies daily loss limits
- Updates trade information
- Performs volume analysis
- Generates LSTM predictions if enabled
- Makes trading decisions based on multiple factors
- Opens positions when conditions align
void OnTick() {
    static datetime lastBar = 0;
    datetime currentBar = iTime(_Symbol, PERIOD_CURRENT, 0);

    if(lastBar == currentBar) return;
    lastBar = currentBar;

    if(GetDailyProfit() < MaxDailyLoss) {
        CloseAllPositions();
        return;
    }

    // Update and calculate
    UpdateTradesInfo();
    CheckTimeBasedClose();

    if(!CanTrade()) return;

    // Volume analysis and LSTM prediction
    // ... volume calculations ...

    if(UseLSTM && volumePredictor != NULL) {
        // LSTM prediction logic
        // ... prediction calculations ...
    }

    CalculateDerivatives();

    // Trading decisions based on calculations
    if(consecutiveAccel >= AccelBars) {
        if((!UseADX && !UseOBV) || ConfirmLongSignal()) {
            // Open buy position
        }
    }
    else if(consecutiveAccel <= -AccelBars) {
        if(!UseADX && !UseOBV || ConfirmShortSignal()) {
            // Open sell position
        }
    }
}
The technical indicator calculations:
- Set up data buffers for indicator values
- Copy indicator data from handles
- Update local arrays with new values
- Maintain indicator data for decision making
void CalculateADX() {
    if(!UseADX) return;

    double adx_buffer[];
    double plusdi_buffer[];
    double minusdi_buffer[];
    ArraySetAsSeries(adx_buffer, true);
    ArraySetAsSeries(plusdi_buffer, true);
    ArraySetAsSeries(minusdi_buffer, true);

    CopyBuffer(adx_handle, MAIN_LINE, 0, ArraySize(adx_main), adx_buffer);
    CopyBuffer(adx_handle, PLUSDI_LINE, 0, ArraySize(adx_plus), plusdi_buffer);
    CopyBuffer(adx_handle, MINUSDI_LINE, 0, ArraySize(adx_minus), minusdi_buffer);

    ArrayCopy(adx_main, adx_buffer);
    ArrayCopy(adx_plus, plusdi_buffer);
    ArrayCopy(adx_minus, minusdi_buffer);
}
Each component works together to create a comprehensive trading system that combines volume analysis, LSTM predictions, and traditional technical indicators while maintaining robust risk management practices.
The Volume_LSTM.mqh file implements a Long Short-Term Memory (LSTM) neural network specifically designed for predicting trading volumes.
The code starts with a fundamental Matrix2D structure that handles 2D matrix operations:
struct Matrix2D {
    double values[];
    int rows;
    int cols;

    void Init(int r, int c) {
        rows = r;
        cols = c;
        ArrayResize(values, rows * cols);
        ArrayInitialize(values, 0);
    }
    // ... other methods
}
The LSTM cell is implemented as a comprehensive structure:
struct LSTMCell {
    double forget_gate[];
    double input_gate[];
    double cell_state[];
    double output_gate[];
    double hidden_state[];

    Matrix2D Wf;  // Forget gate weights
    Matrix2D Wi;  // Input gate weights
    Matrix2D Wc;  // Cell state weights
    Matrix2D Wo;  // Output gate weights

    double bf[];  // Forget gate bias
    double bi[];  // Input gate bias
    double bc[];  // Cell state bias
    double bo[];  // Output gate bias

    int hidden_size;
    int input_size;
};
The implementation includes standard neural network activation functions:
double Sigmoid(double x) {
    return 1.0 / (1.0 + MathExp(-x));
}

double Tanh(double x) {
    return (MathExp(x) - MathExp(-x)) / (MathExp(x) + MathExp(-x));
}
The weights are initialized using a variation of Xavier/Glorot initialization:
void InitializeWeights() {
    double scale = MathSqrt(2.0 / (lstm.input_size + lstm.hidden_size));

    // Initialize weight matrices
    lstm.Wf.Init(lstm.hidden_size, lstm.input_size);
    lstm.Wi.Init(lstm.hidden_size, lstm.input_size);
    // ... other initializations

    // Random initialization with scaling
    for(int i = 0; i < lstm.hidden_size; i++) {
        for(int j = 0; j < lstm.input_size; j++) {
            lstm.Wf.Set(i, j, (MathRand() / 32768.0 - 0.5) * scale);
            // ... other weight initializations
        }
    }
}
The implementation includes data normalization:
void NormalizeVolumes() {
    volume_mean = 0;
    double sum_squared = 0;

    // Calculate mean
    for(int i = 0; i < ArraySize(historical_volumes); i++) {
        volume_mean += historical_volumes[i];
    }
    volume_mean /= ArraySize(historical_volumes);

    // Calculate standard deviation
    for(int i = 0; i < ArraySize(historical_volumes); i++) {
        sum_squared += MathPow(historical_volumes[i] - volume_mean, 2);
    }
    volume_std = MathSqrt(sum_squared / ArraySize(historical_volumes));

    // Normalize volumes
    if(volume_std == 0) volume_std = 1;  // Prevent division by zero
    for(int i = 0; i < ArraySize(historical_volumes); i++) {
        historical_volumes[i] = (historical_volumes[i] - volume_mean) / volume_std;
    }
}
The core prediction logic:
double PredictNextVolume() {
    if(!is_initialized) return 0;

    double input1 = historical_volumes[ArraySize(historical_volumes)-1];

    // LSTM forward pass
    for(int h = 0; h < lstm.hidden_size; h++) {
        double ft = 0, it = 0, ct = 0, ot = 0;

        // Calculate gates
        for(int i = 0; i < lstm.input_size; i++) {
            ft += lstm.Wf.Get(h, i) * input1;
            it += lstm.Wi.Get(h, i) * input1;
            ct += lstm.Wc.Get(h, i) * input1;
            ot += lstm.Wo.Get(h, i) * input1;
        }

        // Apply gates and calculate states
        lstm.forget_gate[h] = Sigmoid(ft + lstm.bf[h]);
        lstm.input_gate[h] = Sigmoid(it + lstm.bi[h]);
        double c_tilde = Tanh(ct + lstm.bc[h]);
        lstm.cell_state[h] = lstm.forget_gate[h] * lstm.cell_state[h] +
                            lstm.input_gate[h] * c_tilde;
        lstm.output_gate[h] = Sigmoid(ot + lstm.bo[h]);
        lstm.hidden_state[h] = lstm.output_gate[h] * Tanh(lstm.cell_state[h]);
    }

    // Calculate final prediction
    double prediction = 0;
    for(int h = 0; h < lstm.hidden_size; h++)
        prediction += lstm.hidden_state[h];
    prediction /= lstm.hidden_size;

    return prediction * volume_std + volume_mean;  // Denormalize
}
Results
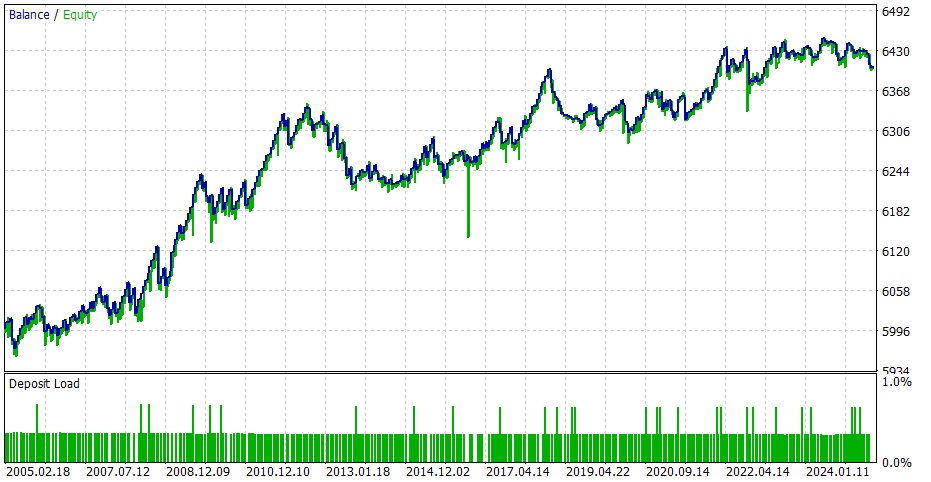
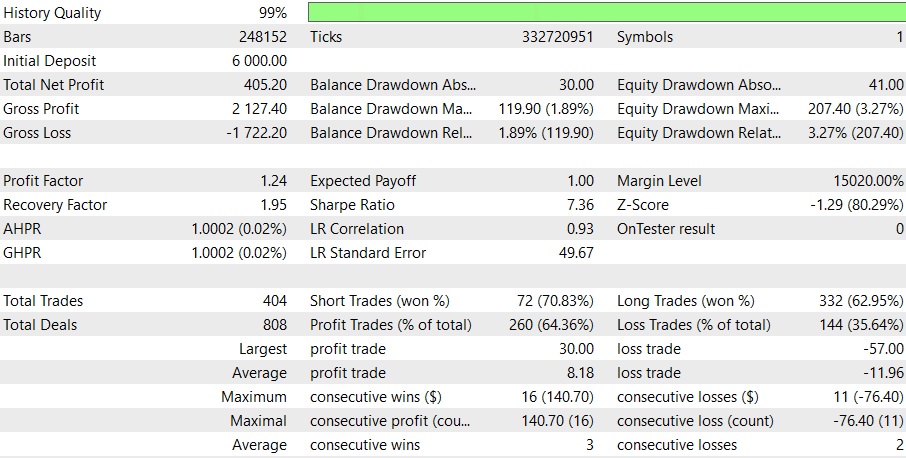
EURUSD, this are the results for EURUSD with 30 min time periods. This are the settings Setting_eurusd.set

GBPUSD with 30 min time frame period.
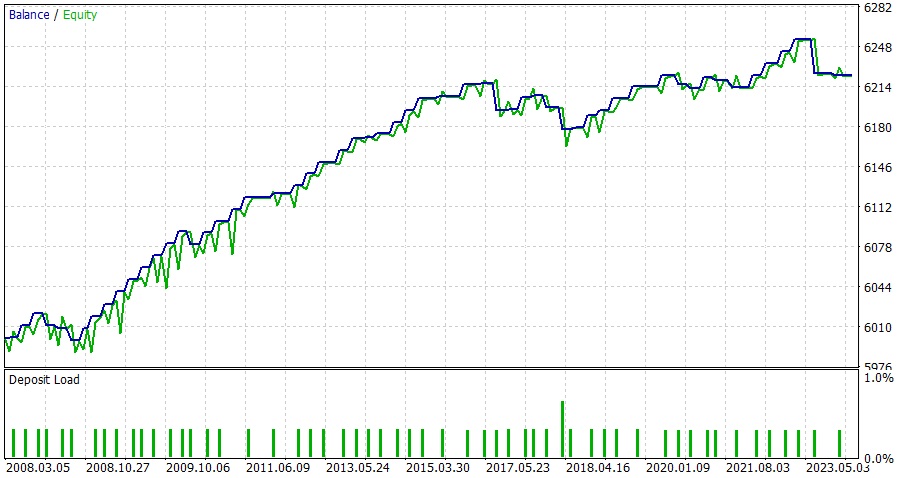
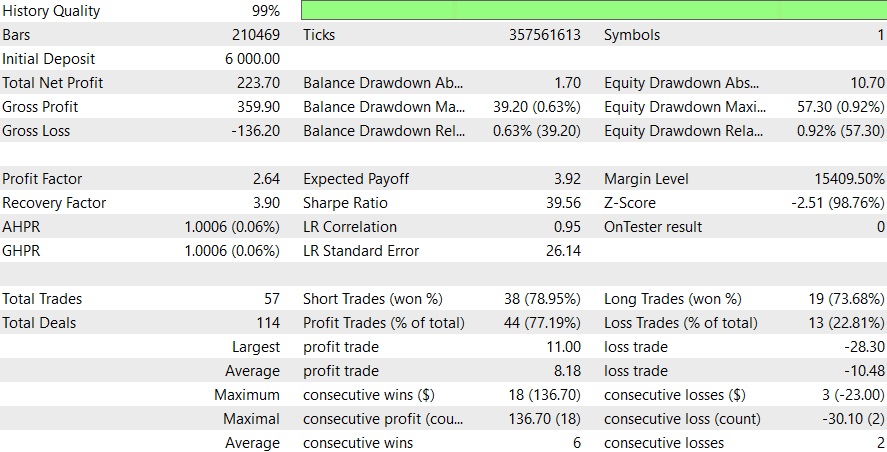
A big optimization might lead to get better results in big pairs, and lack of time don't help to extend this article. I strongly recommend to do a big optimization for each pair, and hope some users add comments with new possible setups at comments.
Advanced Techniques
Trend Confirmation
High volume during price increases indicates strong market support and a likely continuation of the trend. Conversely, high volume during price decreases reflects strong selling pressure and confirms a negative trend. Low volume during price movements warns of weak or unsustainable trends, often signaling false breakouts or manipulation.
Breakout Validation
Breakouts on high volume confirm market conviction, leading to sustained price changes. Low-volume breakouts often result in false signals, such as "bull traps" or "bear traps," and are likely to fail. Volume spikes during breakouts strongly validate the move and indicate robust market support.
Volume Divergence
Volume divergence, where price and volume trends differ, signals potential reversals or weakness in trends. Falling volume with rising prices indicates a weakening uptrend, while falling volume with declining prices suggests reduced selling pressure and possible market bottoming. These patterns can help identify turning points when combined with other indicators.
Conclusion
By fusing cutting-edge machine learning methods with conventional volume analysis, the Volume-Based Trading EA offers an advanced method of algorithmic trading. The system exhibits a strong approach for market research and trade execution by utilizing LSTM neural networks for volume prediction in addition to traditional technical indicators like ADX and OBV.
The EA's multi-layered approach to risk management, which includes stringent daily loss limits, dynamic trailing stops, and thorough position tracking, is its strongest point. This emphasis on risk management, together with adjustable entry parameters and variable session management, gives traders a flexible tool that can adjust to different market situations while upholding disciplined trading procedures.
Most significantly, a special hybrid system is produced by combining volume derivatives analysis with LSTM predictions. Because of this combination, the EA may be able to spot market changes before they completely materialize, and the conventional indicators' validation helps cut down on false signals. Future improvements and simple maintenance are also made possible by the modular code structure.
Users should be aware, however, that due to the complexity of the system, meticulous backtesting and parameter tuning are necessary before live deployment. Despite its strength, the LSTM component requires a large amount of processing power and appropriate training data. Despite these issues, the EA is a useful tool for traders looking to automate their volume-based trading methods because of its thorough commitment to fusing cutting-edge technology with tried-and-true trading concepts.
I hope this article is useful to considerate the use OHLCV and not just prices.
| File Name | Description |
|---|---|
| MQL5/Profiles/Tester/Setting_eurusd.set | Setting inputs for example with EURUSD |
| MQL5/Profiles/Tester/GBPUSD_settings.set | Setting inputs for example GBPUSD |
| MQL5/Experts/Volume_high_low_difference_LSTM.mq5 | Expert Advisor to use for the examples |
| MQL5/Include/Volume_LSTM.mqh | Include mqh file. Remember to change the path in the EA as to where you saved it |
Warning: All rights to these materials are reserved by MetaQuotes Ltd. Copying or reprinting of these materials in whole or in part is prohibited.
This article was written by a user of the site and reflects their personal views. MetaQuotes Ltd is not responsible for the accuracy of the information presented, nor for any consequences resulting from the use of the solutions, strategies or recommendations described.
 MQL5 Wizard Techniques you should know (Part 49): Reinforcement Learning with Proximal Policy Optimization
 Developing a Replay System (Part 53): Things Get Complicated (V)
 Creating a Trading Administrator Panel in MQL5 (Part VII): Trusted User, Recovery and Cryptography
 Creating a Trading Administrator Panel in MQL5 (Part VI):Trade Management Panel (II)
- Free trading apps
- Over 8,000 signals for copying
- Economic news for exploring financial markets
You agree to website policy and terms of use
You are a gen. I have been looking for an approach of this level of analysis with volumes. Have considered using zigzag indicators for price direction and a little of demand and Discount zone? Will try to do this if time permits.
Hi Thanks! not very sure about the gen ... but found this interesting. I will make an article with zigzag indicator and volumes. I will also continue with more strategies using volumes. Moving of country and will need some time to work more.
You are a gen. I have been looking for an approach of this level of analysis with volumes. Have considered using zigzag indicators for price direction and a little of demand and Discount zone? Will try to do this if time permits.
Hi, I've taken some days studding volume and ZigZag, and only got breakeven results ... I might take more time studying it on future, but for now, I don't feel is enough for making an article. Please try it yourself and correct me if its a good joint ;) (what I found interesting is ADX with ZigZag ... I might write one with that ... just started it ...) ... I promise on future I will check again volume with ZigZag.