
Developing a Replay System — Market simulation (Part 14): Birth of the SIMULATOR (IV)

Introduction
In the previous article "Developing a Replay System - Market Simulation (Part 13): Birth of the SIMULATOR (III)" I showed the changes made to the service file for better representation of ticks and their processing. The main goal of the previous article was to show how this can be done and where the code needs to be changed and added to get data from the service. This will allow us to move this data to another location, in this case to a file. With this file in hand, we can use the program, in this case I showed how to use EXCEL, to analyze the data that the simulator will generate.
This type of task, although it may seem trivial, is of paramount importance to what we are going to do in this article. Without understanding how to analyze the data that the simulator will generate, we will not be able to understand what will need to be implemented; but, most importantly, we will not understand why it is implemented in the way I will show. Besides the main topic of the previous article, we also explained some points that needed to be changed in the code so that the bar would be created in about 1 minute, with good accuracy, so that everything would be very close to reality. However, despite all this, to understand what we will do in this article, we need to consider one more thing. Since there was already a lot of information in the previous article, I decided to explain one last detail here. You can view it in the attached code.
Trying the free Random Walk
Below you can see the most basic version of the routine, which will attempt to create the free random walk.
inline void Simulation(const MqlRates &rate, MqlTick &tick[])
                        {
#define macroRandomLimits(A, B) (int)(MathMin(A, B) + (((rand() & 32767) / 32767.0) * MathAbs(B - A)))

                                long il0, max;
                                double v0, v1;
                                int p0;

                                ArrayResize(m_Ticks.Rate, (m_Ticks.nRate > 0 ? m_Ticks.nRate + 3 : def_BarsDiary), def_BarsDiary);
                                m_Ticks.Rate[++m_Ticks.nRate] = rate;
                                max = rate.tick_volume - 1;
                                v0 = 4.0;
                                v1 = (60000 - v0) / (max + 1.0);
                                for (int c0 = 0; c0 <= max; c0++, v0 += v1)
                                {
                                        tick[c0].last = 0;
                                        tick[c0].flags = 0;
                                        il0 = (long)v0;
                                        tick[c0].time = rate.time + (datetime) (il0 / 1000);
                                        tick[c0].time_msc = il0 % 1000;
                                        tick[c0].volume_real = 1.0;
                                }
                                tick[0].last = rate.open;
                                tick[max].last = rate.close;
                                for (int c0 = (int)(rate.real_volume - rate.tick_volume); c0 > 0; c0--)
                                        tick[macroRandomLimits(0, max)].volume_real += 1.0;
                                for (int c0 = 1; c0 < max; c0++)
                                        tick[c0].last = macroRandomLimits(rate.low, rate.high);
                                il0 = (long)(max * (0.3));
                                tick[macroRandomLimits(il0, il0 * 2)].last = rate.low;
                                tick[macroRandomLimits(max - il0, max)].last = rate.high;
                                for (int c0 = 0; c0 <= max; c0++)
                                {
                                        ArrayResize(m_Ticks.Info, (m_Ticks.nTicks + 1), def_MaxSizeArray);
                                        m_Ticks.Info[m_Ticks.nTicks++] = tick[c0];
                                }
                        }

#undef macroRandomLimits
It is very important to understand this code above to understand what we will do next. If you run this exact code, you will end up with a very confusing graph. It's important to know how this very basic function works so you can understand how more complex functions will operate. Let's start with the macro definition. Question: What does this macro do? You may be looking and thinking: what kind of madness is this? Do we really need something so strange? The answer to this question is YES and NO.
YES because we need the random value to be generated within a very specific range. To do this we need to set some kind of constraint. And NO because to generate a RANDOM WALK, we do not need this calculation itself. But again, we must understand how this simpler system works in order to understand other, more complex ones.
So when we do the AND operation, we restrict the value to a range. This is the first point. If we divide this value by the upper limit of the range, we will get a value that will be in the range from 0 to 1. We will then multiply this value, which will be between 0 and 1, by the difference between the upper and lower bounds. Thus we will get a value that will be in the range from 0 to the maximum value, which will be our range. Now if we add this range to the minimum value, we get the value that we actually need. This is the value that should be used. This way we won't have to worry about running any other checks: the macro itself will ensure that the value is within acceptable limits. Did you get the idea behind this crazy macro? This is pure mathematics, nothing more.
Next, let's move on to the first of four FOR loops that are inside the function. Before we get into the loop itself, we need to do a few simple calculations that will help us with the rest of the function. First of all, we need to know how many ticks we will actually simulate. Next, we will need to know how long each tick will be, or, more precisely, when they should appear. To keep things simple, we will use constant time between them. Now we can enter the loop and distribute the ticks within the 1-minute bar range. In some cases the ticks will be further apart and in others they will be closer together. But that doesn't really matter now. What we need and want is what really matters to us. This is that each tick exists and is unique. This can be achieved by placing ticks at different points in time.
You may have noticed that I set each simulated tick to initially have a minimum volume value. This point is also important for the next step. Now we enter the next loop. This is where things get interesting because the first thing we do is determine what the opening and closing price of a 1-minute bar will be. What's really interesting is what happens inside the loop. We will subtract the total volume from the number of ticks that will be used. This gives us a value that represents the volume that has not yet been allocated. We could allocate this volume directly on the last tick or on some other tick. However, this would cause a sharp change in volume, which does not often happen in the real market. Therefore, we need another method to distribute the remaining ticks so that the resulting volume is expressed in terms of the 1-minute bar value. To create this distribution in the smoothest and most random way possible, we will use our macro. Each time the macro is called, it generates a value that is within certain limits. And it is at this moment that the value present in the volume will increase by 1. In other words, the total volume will be distributed randomly and smoothly, giving the impression that the data is similar to that of the real market.
Finally, let's look at the last two loops, the first of which will create randomness in our tick system. Note that we don't have to put in any effort: all we do is tell the system what the minimum and maximum price to use is. Thus, each tick will have a randomly selected price. Note that we are using a macro to do this selection. Once we do this, we need to make sure that both the maximum value point and the minimum value point are present. This is because they may not have been created during random generation, and the position at which these points are found will also be chosen at random.
As for the last loop, it will simply pass the values into the tick system for use as if they were real ticks. You can see and understand the result if you save the output to a file and then use the output as data for a graph. We usually do this in some program, such as Excel. However, this can also be done directly in MetaTrader 5 using some custom symbol. However, we won't consider these details right now. It is important to understand that the simulation will actually occur as expected.
Based on the explanation we started in the previous article, you can see that now we are prioritizing movement randomization. Unlike what can be seen in other articles, which use a method very similar to that found in the strategy tester to create the simulation, we used a zigzag movement very similar to what is shown in the image below:
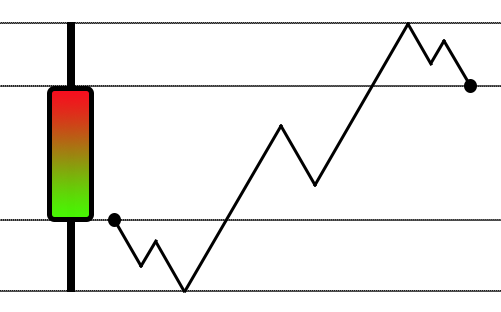
While this is a great idea for use in a strategy tester, this approach is not entirely adequate for a replay/simulation system. A different approach is required, a little more creative, but at the same time more complex. This is how the system I just explained was born. There we begin to quite simply "randomize" movements within a 1-minute bar. But this approach is not entirely adequate if our intention is to have a style of movement very similar to the movement of an object suspended in a liquid. To help you understand how this is done, it is important to know how to transform a series of data into something visible on a graph. The easiest way to do this is to use EXCEL for the conversion. Again, it's important that you know how to do this.
The previous article Developing a Replay System — Market simulation (Part 13): Birth of the SIMULATOR (III) had a video with an explanation. It is very important that you know how to do this if you really want to understand what will happen in this article. This is because here we will create a movement simulation that will look like a RANDOM WALK. Looking at the charts created by the simulator, you will immediately notice that the movement is very similar to the movement that is observed during the symbol trading phase. I will not include mathematical formulas or anything like that in this article, since I do not see any benefit in such an approach. What everyone is really interested in is the code itself and what it produces. The mathematical formulas used add nothing at all and do not provide any knowledge for many, since many do not understand the abstract issues being considered. Consequently, this will complicate the matter rather than explain it. But surely everyone will understand the results obtained.
In this article you will see the easiest way to convert figure 01 to figure 02:
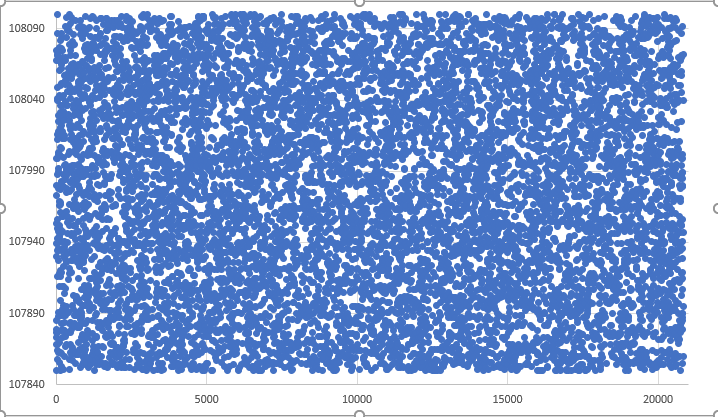
Figure 01 – Random movement performed in jumps
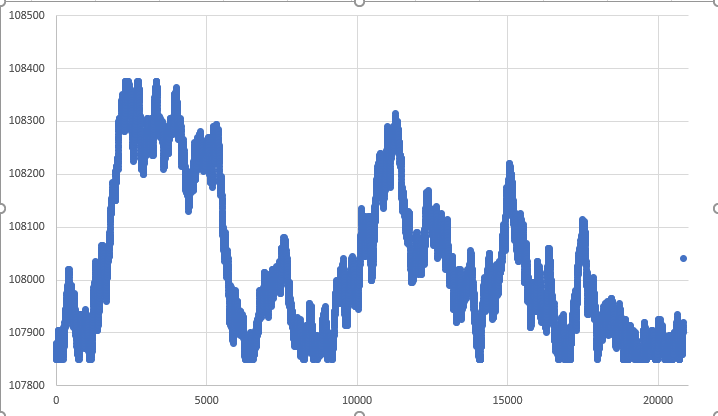
Figure 02 - Random movement performed in steps
Both figures are created using the same database:
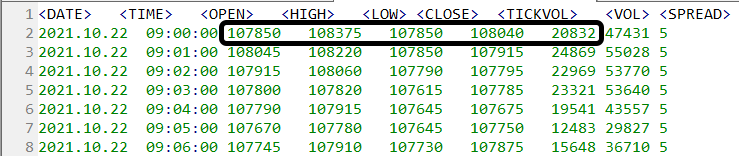
Figure 03 – Database used in both movements
BUT there are issues that differ from a totally random system and that we need to correct. Even then, we will not have a truly adequate system right away in more than 99% of cases, while that remaining 1% is due to some chance, which makes the simulation ideal. But it will be something rare. Therefore, we will need to implement some tricks to solve all other cases, that is, 99%.
Let's see how the system actually works. But before that, if you haven't read the previous article "Developing a Replay System — Market simulation (Part 13): Birth of the SIMULATOR (III)", I strongly recommend that you stop and read the previous article first. The reason is that here we will focus only on the necessary changes and how they should be implemented. We will not repeat the explanations that were given in the previous article. Therefore, it is important to understand the preceding content. Especially the part that involves converting data into graphs in Excel.
Let's now move on to the topic of implementation.
Implementing the RANDOM WALK with absolutely free movement
All we need to do to convert random jumping to random stepping is to change the way the simulation function works. To do this, let's look at its code:
inline void Simulation(const MqlRates &rate, MqlTick &tick[])
                        {
#define macroRandomLimits(A, B) (int)(MathMin(A, B) + (((rand() & 32767) / 32767.0) * MathAbs(B - A)))

                                long il0, max;
                                double v0, v1;

                                ArrayResize(m_Ticks.Rate, (m_Ticks.nRate > 0 ? m_Ticks.nRate + 3 : def_BarsDiary), def_BarsDiary);
                                m_Ticks.Rate[++m_Ticks.nRate] = rate;
                                max = rate.tick_volume - 1;
                                v0 = 4.0;
                                v1 = (60000 - v0) / (max + 1.0);
                                for (int c0 = 0; c0 <= max; c0++, v0 += v1)
                                {
                                        tick[c0].last = 0;
                                        tick[c0].flags = 0;
                                        il0 = (long)v0;
                                        tick[c0].time = rate.time + (datetime) (il0 / 1000);
                                        tick[c0].time_msc = il0 % 1000;
                                        tick[c0].volume_real = 1.0;
                                }
                                tick[0].last = rate.open;
                                tick[max].last = rate.close;
                                for (int c0 = (int)(rate.real_volume - rate.tick_volume); c0 > 0; c0--)
                                        tick[macroRandomLimits(0, max)].volume_real += 1.0;
                                for (int c0 = 1; c0 < max; c0++)
                                        tick[c0].last = macroRandomLimits(rate.low, rate.high);
                                        tick[c0].last = tick[c0 - 1].last + (m_PointsPerTick * ((rand() & 1) == 1 ? 1 : -1));
                                il0 = (long)(max * (0.3));
                                tick[macroRandomLimits(il0, il0 * 2)].last = rate.low;
                                tick[macroRandomLimits(max - il0, max)].last = rate.high;
                                for (int c0 = 0; c0 <= max; c0++)
                                {
                                        ArrayResize(m_Ticks.Info, (m_Ticks.nTicks + 1), def_MaxSizeArray);
                                        m_Ticks.Info[m_Ticks.nTicks++] = tick[c0];
                                }
#undef macroRandomLimits
                        }
Be careful, we are only changing the way the function works, but we still keep the same load. This way we will use the same number of ticks. Pay attention to the highlighted part. And now pay attention to the following fact: the DELETED code must be deleted and the highlighted code must be inserted in its place. By implementing just this change, we can create a RANDOM WALK, but this is not a proper move. Not yet, because even if at some rare moment there is a move that remains within the 1 minute bar, in other words, if the high and low are met and kept within that amplitude, then with this code we have no confidence or control above this. This can be seen if you run it and check the resulting graph.
If you use the attached files and do not change the configuration file, the replay/simulation service will only work in the first panel, and the panel that is highlighted in the image below will be used:

Note the limits: UPPER LIMIT => 108375 and LOWER LIMIT => 107850. And these are not the limits that can be seen on the graph. Even with a quick glance you can see that these limits are not respected. Look at the data graph image of one of the executions shown below.
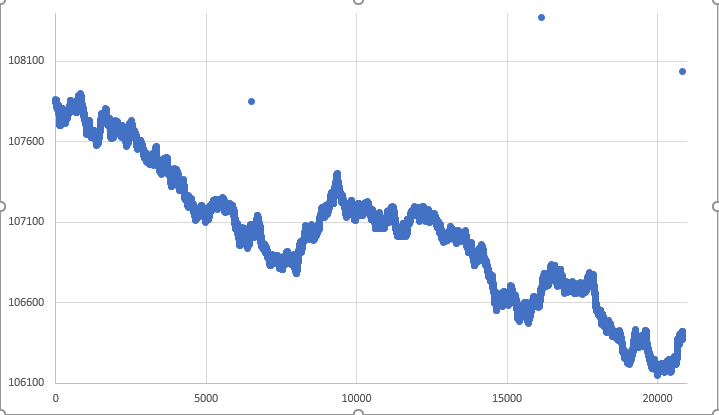
Figure 04 – Graph of a completely free RANDOM WALK
As you can see, the lower limit is far from being respected. Again, at some very, very specific point, it may happen that boundaries are respected. There is another problem with isolated points, which can be seen in the graph above, but let's move on gradually. These points represent another problem that we will have to solve. However, let's first deal with the limits. Well, some things may be acceptable when we are creating simulations of movement. But here we will not accept them. The reason is that we are doing simulations based on some kind of data previously obtained, and we have to respect what is provided to us.
To solve this problem of limits, we will have to transform a free system into a limited one. Although many people do not approve of this approach, we have no choice but to create some kind of check to comply with the limits at all costs. Therefore, it is important to read the previous article to understand how to use EXCEL or any other program to analyze the graph generated by the simulation system. Don't just rely on data and think it's correct. You really need to look at them on a graph.
Unlike what happens when we have a completely random jumping-based system as shown in Figure 01, where using the MetaTrader 5 graphics system is completely impossible, the same does not happen when we get what is depicted in the figure 02 or even in figure 04. Although in both cases we have the problem of isolated points on the graph which will generate a strange bar. However, if you do not want to transfer the simulation data to EXCEL, you can make some changes to the code so that each tick is displayed directly on the MetaTrader 5 chart. But this will make the chart more difficult to understand due to the amount of information it will contain. Remember: you will need to place tick by tick on the chart, not on the bars. If you don't know how to do this, read this article: "Developing a trading Expert Advisor from scratch (Part 13): Time and trade (II)", because in it I explain how to plot the ticks that we generate here in the simulator. Although Times And Trade focuses on viewing real symbol ticks, we can use it to view ticks generated in the simulator. It's all about adapting the code shown for Times And Trade.
This is not too difficult a task, but it will require changes that will then have to be undone. So I won't show how to do it. The goal here is to show in a very simple way how to make the system generate movement so that we have a simulation of possible movement within a 1-minute bar, but in a continuous form and not in jumps. I think many of you don't have in-depth knowledge of how to program these things using MQL5. Changing your approach just for personal satisfaction is completely beyond the scope of this or any other article in this sequence. Therefore, let's continue our work. Now let's add something to the code so that it matches the limits, which are determined by the information contained in the 1-minute bar highlighted in Figure 03.
Implementing a limited-movement RANDOM WALK
Based on what we saw in the previous topic, we can easily notice what we need to update. See the changes in the code below:
inline void Simulation(const MqlRates &rate, MqlTick &tick[])
                        {
#define macroRandomLimits(A, B) (int)(MathMin(A, B) + (((rand() & 32767) / 32767.0) * MathAbs(B - A)))

                                long    il0, max;
                                double  v0, v1;
                                bool    bLowOk, bHighOk;

                                ArrayResize(m_Ticks.Rate, (m_Ticks.nRate > 0 ? m_Ticks.nRate + 3 : def_BarsDiary), def_BarsDiary);
                                m_Ticks.Rate[++m_Ticks.nRate] = rate;
                                max = rate.tick_volume - 1;
                                v0 = 4.0;
                                v1 = (60000 - v0) / (max + 1.0);
                                for (int c0 = 0; c0 <= max; c0++, v0 += v1)
                                {
                                        tick[c0].last = 0;
                                        tick[c0].flags = 0;
                                        il0 = (long)v0;
                                        tick[c0].time = rate.time + (datetime) (il0 / 1000);
                                        tick[c0].time_msc = il0 % 1000;
                                        tick[c0].volume_real = 1.0;
                                }
                                tick[0].last = rate.open;
                                tick[max].last = rate.close;
                                for (int c0 = (int)(rate.real_volume - rate.tick_volume); c0 > 0; c0--)
                                        tick[macroRandomLimits(0, max)].volume_real += 1.0;
                                bLowOk = bHighOk = false;
                                for (int c0 = 1; c0 < max; c0++)
                                {
                                        v0 = tick[c0 - 1].last + (m_PointsPerTick * ((rand() & 1) == 1 ? 1 : -1));
                                        if (v0 <= rate.high)
                                                v0 = tick[c0].last = (v0 >= rate.low ? v0 : tick[c0 - 1].last + m_PointsPerTick);
                                        else
                                                v0 = tick[c0].last = tick[c0 - 1].last - m_PointsPerTick;
                                        bLowOk = (v0 == rate.low ? true : bLowOk);
                                        bHighOk = (v0 == rate.high ? true : bHighOk);
                                }
                                il0 = (long)(max * (0.3));
                                if (!bLowOk) tick[macroRandomLimits(il0, il0 * 2)].last = rate.low;
                                if (!bHighOk) tick[macroRandomLimits(max - il0, max)].last = rate.high;
                                for (int c0 = 0; c0 <= max; c0++)
                                {
                                        ArrayResize(m_Ticks.Info, (m_Ticks.nTicks + 1), def_MaxSizeArray);
                                        m_Ticks.Info[m_Ticks.nTicks++] = tick[c0];
                                }
#undef macroRandomLimits
                        }
It may seem like no changes are happening or you may feel a little confused by all the labels. Two new variables have been added here that will help us better control the situation. They are initialized in such a way that if the positions they represent are not properly accessed, we will definitely have to place these points on the chart. And these points are selected randomly. The required checks are done within the framework of the system that analyzes the limits. Thus, we can focus on one thing only: keeping the RANDOM WALK within the limits previously set by the 1-minute bars. The first thing we will check is whether the upper limit was violated and how it was respected. If this happens, we will immediately return the movement within the limits. If it has been respected, we will check whether the lower bound has been violated. If so, we will immediately return the movement within the limits. Otherwise the value will be accepted.
We haven't changed too much in the code. However, the results have undergone significant changes. See the result of one of the executions.
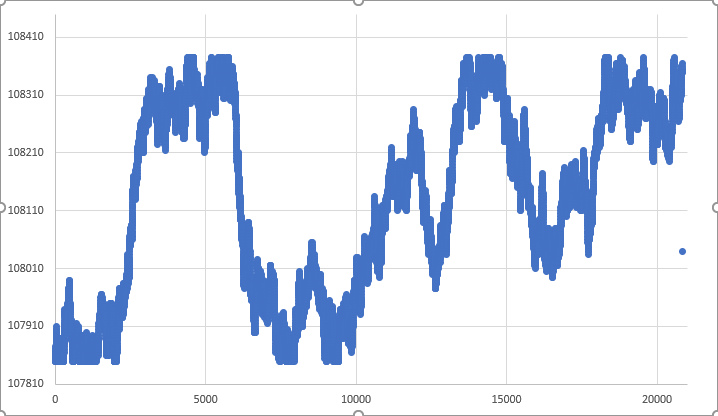
Figure 05 – RANDOM WALK within certain limits
In fact, it was pure luck that the movement covered all loose points. But we still have a loose point on the chart. This point represents the closing tick of the 1-minute bar. It's actually quite difficult to achieve this accurately, given the nature of random walk and how we do it. Unlike Figure 04, where the restrictions were not met, in Figure 05 they were met and the entire 1-minute bar will be within the previously set limits, so the movement is almost perfect. And I say "almost" because the result of Figure 05 was pure luck. In most cases we will get a result similar to the one shown in Figure 06 below.
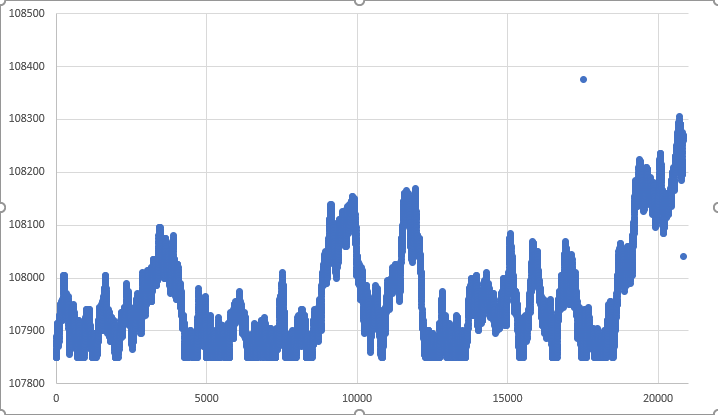
Figure 06 – Typical movement graph within limits
Note that also in Figure 06 the closing point was not reached at the desired time by the random movement system. However, in extremely rare cases you can get a result similar to Figure 07. Here we can notice that the closing point was reached by a random movement.
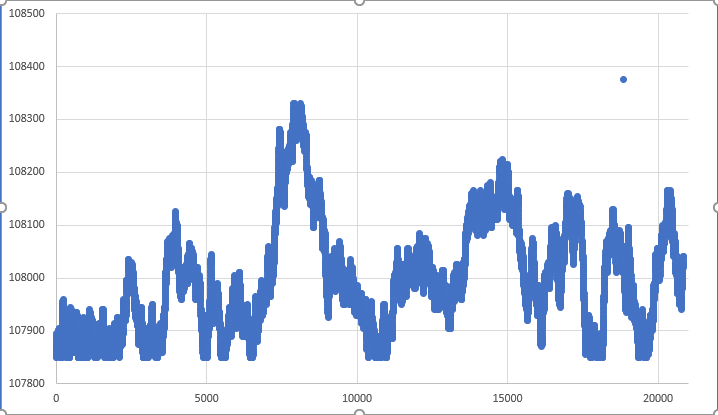
Figure 07 – RARE movement in which the closing point was reached
But this type of movement is so rare that we cannot count on it. In most cases, the tick before closing will be far from the closing point. This will cause a sharp movement in the graph of the replay/simulation asset displayed by MetaTrader 5. If you don't mind this effect, great, the system is now usable, but you should notice something else. At various times, and this is not that uncommon, the highs or lows are not actually affected. This means that at the second or third point we will see another sudden move in the asset plotting system. In a sense, this is not a big problem, at least in most cases, since in the real market, in fact, at some points we have such movements. Even if in this case we want to create a system in which these movements will not be so frequent, we must take other measures. In other words, we will have to make more changes to the simulation system, but these changes will not come without difficulties. On the contrary, this implementation will be difficult for some people to understand. Additionally, if we want to have a graph very similar to the one shown in Figure 07, we will need to make these changes.
I think many people are already quite satisfied with the results presented in this version. However, we can still improve all this. For those who think this is enough, the following article may not seem necessary. But for the perfectionists, I have one more suggestion to work on. This will create a RANDOM WALK with no loose points. This way, all points will be visited. But that's enough for today. I will give you time to digest the knowledge from this article. You will need to test the system several times with different types of assets, only then will you truly know whether the possible movements within a 1-minute bar are adequate and reflect the possible reality of the market you want to exploit using the concept of a limited RANDOM WALK.
Final considerations
With virtually no complex mathematical formulas and in simple language, I think I have managed to convey to you, dear readers, a concept that is quite interesting and present in the market. This is the so-called RANDOM WALK. The system presented in this article shows how far we can go without understanding complex concepts, although of course it is always good to gain knowledge. But why complicate something when you can explain it in a fairly simple and pleasant way, right?
The attached file provides the system in its current state of development. Many of you are probably wondering when we will actually start using the order system in our replay/simulator. Don't worry, we'll start adding the order system soon, but before we do that, there's one more thing we need to do. This is necessary because the order system will become a rather interesting problem to solve. But first we need to complete the implementation of the replay/simulation service, which now appears to be almost ready. We only need to add a few more details. After this we can start developing the order system. This way, it will be possible to use the replay/simulator as if trading on a real market. Although you may have to change a few things before you start using it. But we'll decide later. Either way, you need to practice and train to become an experienced programmer. What I am trying to explain to you will help you with this. See you in the next article where we will finish with this RANDOM WALK. This stage has not yet been completed.
Translated from Portuguese by MetaQuotes Ltd.
Original article: https://www.mql5.com/pt/articles/11058
Warning: All rights to these materials are reserved by MetaQuotes Ltd. Copying or reprinting of these materials in whole or in part is prohibited.
This article was written by a user of the site and reflects their personal views. MetaQuotes Ltd is not responsible for the accuracy of the information presented, nor for any consequences resulting from the use of the solutions, strategies or recommendations described.

 How to create a simple Multi-Currency Expert Advisor using MQL5 (Part 4): Triangular moving average — Indicator Signals
- Free trading apps
- Over 8,000 signals for copying
- Economic news for exploring financial markets
You agree to website policy and terms of use