
Reimagining Classic Strategies (Part 18): Searching For Candlestick Patterns

Candlestick patterns have long been used by professional traders to navigate financial markets and gauge investor sentiment. These patterns can sometimes hold true and produce reliable results. However, they are also known to falter depending on the prevailing market regime. In this article, we seek to explore the candlestick patterns available and examine whether any algorithmic improvements can be made to overcome the limitations of their classical interpretation.
For today’s discussion, we will focus on candlestick patterns, commonly referred to as engulfing candlesticks. There are many challenges that make it hard for practitioners to find reliable candlestick patterns. The first problem most practitioners will run into is that, there are materially many different candlestick patterns that any trader can follow. To make matters worse, this space can only be searched manually, meaning that the practitioner must often define by hand the rules and conditions in their algorithm that describe the specific candlestick pattern they have in mind.
As we know, there are numerous existing candlestick patterns, and searching through this space by hand, on your own may be intimidating for new and inexperienced members of our community. This article seeks to offer a practical guide on how we can improve a well-known candlestick pattern. The engulfing candlestick pattern that we will examine today is commonly recognized by most traders as a sign of a potential breakout in the market. These candlestick patterns often indicate accumulating open interest and, therefore, the possibility of a strong breakout on one side of the market.
In most of our articles in this series, we mostly focus on AI-powered trading strategies and technical indicators as the main signal generators. Rarely do we provide opportunities to candlestick patterns as the driver of the algorithm’s decision-making. Among many reasons, we’ll name a few why candlestick patterns can be more challenging to integrate into trading strategies.
For one, the space defined by candlestick patterns is considerable. There are so many candlestick patterns that can exist, and each of them has its own variations in which they can take shape. Because candlestick patterns do not always take the same shape each time, trying to search this space and think of new patterns is quite challenging, as it has to be done by hand. It’s a hard space to search algorithmically.
Additionally, patterns themselves can be repeated with different outcomes each time. Therefore, there can be arguments that candlestick patterns are not robust because each occurrence of the same pattern can have different outcomes. It is not necessarily a dead giveaway of the market’s intended direction.
Visualizing The Classical Strategy
With that out of the way, we are ready to begin visualizing the classical implementation of the trading strategy. Normally, an engulfing candle is defined as the opening price of a candle being greater than the closing price of the candle that precedes it, and the opposite is true for its closing price. An engulfing candle is classically assumed to be a two-candle pattern in most instances. It serves as an entry signal and is typically not used on low timeframes. In the code example we use, we will implement the strategy on the daily timeframe. In Figure 1, we’ve highlighted the pattern of an engulfing candle on the EURUSD pair for illustrative purposes.
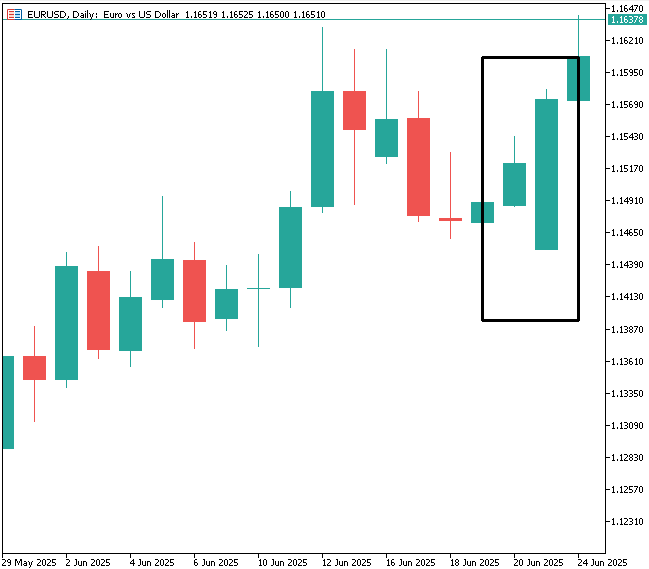
Figure 1: Identifying the classical engulfing candle pattern
When identified correctly, the candlestick pattern is usually followed by strong price action in the anticipated direction, as we have visualized for the reader in Figure 2. This serves as the motivation behind why the pattern is popular in trading circles.
However, as we shall soon see, some challenges arise when implementing the algorithm in code. We used this classical version of the strategy to establish a baseline performance level for our application. After adding some refinements to this classical version of the strategy, we were able to filter more noise from the market and produce higher profitability levels, using fewer trades compared to the number of trades required by the noisier version of the pattern.
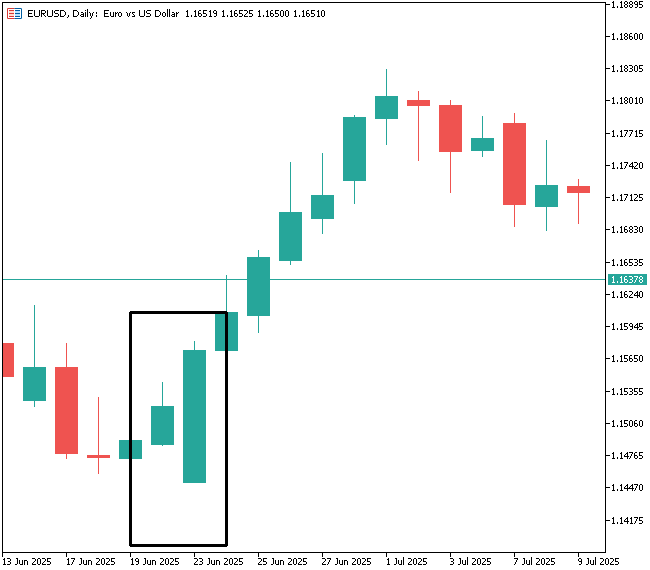
Figure 2: The pattern produces reasonable levels of confidence from its past performance
Throughout this series, we will search over 5 unique candle patterns. But for today, we will start with our focus purely on the engulfing candlestick pattern. As with most of our applications, we will start by defining system constants to ensure we use the same lot size across both tests.
//+------------------------------------------------------------------+
//|                                        Candle Stick Patterns.mq5 |
//|                                  Copyright 2025, MetaQuotes Ltd. |
//|                                             https://www.mql5.com |
//+------------------------------------------------------------------+
#property copyright "Copyright 2025, MetaQuotes Ltd."
#property link      "https://www.mql5.com"
#property version   "1.00"

//+------------------------------------------------------------------+
//| This application attempts to reliably use different candlestick  |
//| patterns. The application will employ the following:             |
//|                                                                  |
//|   1) Engulfing Candle                                            |
//|   2) Momentum Candle                                             |
//|   3) Doji Candle                                                 |
//|   4) Shooting Star Candle                                        |
//|   5) Hammer Candle                                               |
//+------------------------------------------------------------------+

//+------------------------------------------------------------------+
//| System constants                                                 |
//+------------------------------------------------------------------+
#define LOT_SIZE SymbolInfoDouble(Symbol(),SYMBOL_VOLUME_MIN)
Import the trade library.
//+------------------------------------------------------------------+
//| Trading libraries                                                |
//+------------------------------------------------------------------+
#include  <Trade\Trade.mqh>
CTrade Trade;
Now, we load the technical indicators we need. We will use the ATR indicator to define stop loss and take profit levels for our application.
//+------------------------------------------------------------------+
//| Indicators                                                       |
//+------------------------------------------------------------------+
int atr_handler;
double atr[];
As with most applications, we need a few global variables. These will be responsible for keeping track of the passage of time, and the changes to price levels.
//+------------------------------------------------------------------+
//| Global variables                                                 |
//+------------------------------------------------------------------+
MqlDateTime time_stamp,current_time;
double bid,ask;
When the application is initialized for the first time, we will setup the time stamp parameter and the ATR.
//+------------------------------------------------------------------+
//| Expert initialization function                                   |
//+------------------------------------------------------------------+
int OnInit()
  {
//--- Set the time
   TimeLocal(time_stamp);
   atr_handler = iATR(Symbol(),PERIOD_CURRENT,14);
//---
   return(INIT_SUCCEEDED);
  }
When our application is no longer in use, we will free up the memory that was previously associated with the indicator we needed.
//+------------------------------------------------------------------+
//| Expert deinitialization function                                 |
//+------------------------------------------------------------------+
void OnDeinit(const int reason)
  {
//---
IndicatorRelease(atr_handler);
  }
Whenever new price data is received, the system first updates the current time and checks for any mismatch between the current day and the stored timestamp. If this is the first tick since initialization, the timestamp will still reflect that initial value. When a new day is detected, the timestamp is updated, followed by a refresh of market data — including ATR buffer readings and the current bid and ask prices.
If there are no open positions, the algorithm proceeds to scan for the engulfing candlestick pattern. Typically, this pattern spans two candles — the current (still-forming) candle and the previous day’s candle. Accordingly, iOpen and iClose are indexed at 0 and 1 to reference the present and previous candles, respectively.
A bullish engulfing setup is identified when the current candle opens below the previous day’s close and its current close exceeds the previous day’s open, forming a candle that fully engulfs the prior one. The inverse conditions define the bearish setup.
These rules generate entry signals, with take-profit levels spaced at 1.5× ATR intervals, maintaining a 1:1 risk–reward ratio.
//+------------------------------------------------------------------+
//| Expert tick function                                             |
//+------------------------------------------------------------------+
void OnTick()
  {
//--- Update the current time
   TimeLocal(current_time);

//--- Check if a new candle has fully formed
   if(time_stamp.day != current_time.day)
     {
     //--- Update the time
      TimeLocal(time_stamp);

      //--- A new candle has formed
      //--- Update the ATR reading
      CopyBuffer(atr_handler,0,0,1,atr);
      ask = SymbolInfoDouble(Symbol(),SYMBOL_ASK);
      bid = SymbolInfoDouble(Symbol(),SYMBOL_BID);

      //--- First check if we have no open positions
      if(PositionsTotal() == 0)
        {
         //--- Then check for a trade
         //--- Check for a bullish engulfing candle stick pattern
         if((iOpen(Symbol(),PERIOD_D1,0)<iClose(Symbol(),PERIOD_D1,1)) && (iClose(Symbol(),PERIOD_D1,0)>iOpen(Symbol(),PERIOD_D1,1)))
           {
            //--- Then, enter long positions
           Trade.Buy(LOT_SIZE,Symbol(),ask,(ask - (atr[0]*1.5)),(ask + (atr[0]*1.5)));
           }

         //--- Otherwise we may check for bearish engulfing candlestick pattern
         if((iOpen(Symbol(),PERIOD_D1,0)>iClose(Symbol(),PERIOD_D1,1)) && (iClose(Symbol(),PERIOD_D1,0)<iOpen(Symbol(),PERIOD_D1,1)))
           {
            //--- Then, enter long positions
           Trade.Sell(LOT_SIZE,Symbol(),ask,(ask + (atr[0]*1.5)),(ask - (atr[0]*1.5)));
           }
        }
     }
//--- Otherwise, the current candle has not fully formed
  }
//+------------------------------------------------------------------+
Always undefine all system variables at the end of the application.
//+------------------------------------------------------------------+
//| System definitions                                               |
//+------------------------------------------------------------------+
#undef LOT_SIZE
Selecting the backtest days for our benchmark version of the application. We will use 2 years of data, spanning from 2023 until 2025.

Figure 3: Testing the benchmark version of the classical candlestick pattern
The initial performance indicators we have obtained are encouraging. It appears the engulfing candlestick pattern has some levels of reliability to it. It produced a total net profit of $127.64 over the 2 year period, in 115. This was achieved with 55.7% accuracy, with a healthy distribution of long and short entries. Returning readers will remember how difficult it was for us to obtain such symmetrical trade distributions from a statistical model in our last discussion, last week, link provided here.

Figure 4: The statistical results obtained from the classical setup
The original version of the candlestick pattern produced an equity curve with profitability levels that appear sound and have a long term uptrend in them. This gives us additional levels of confidence that the strategy is worth the effort it may take to further refine it.
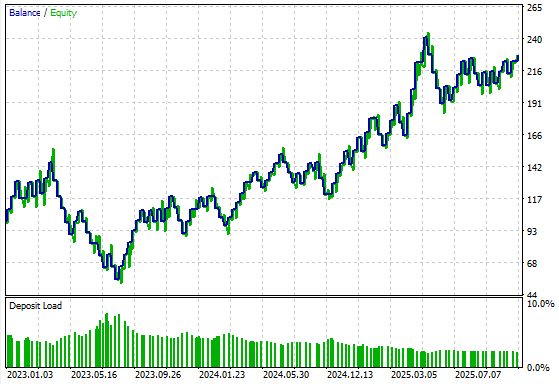
Figure 5: The equity curve produced by the benchmark strategy has a long term uptrend
Visualizing The Reimagined Strategy
After careful consideration, several potential improvements came to mind.
The first was to compare the two candles not only by their opening and closing prices, but also by the highs and lows of their wicks. This helps filter out noise and highlights more prominent candles — those backed by enough volume to sustain a trend or strong directional move.
The second improvement is more technical and relates to how backtesting operates on the MetaTrader 5 platform. When backtesting a trading robot in MetaTrader 5, the simulation begins at the very start of each candle — at midnight. As a result, any trading logic that depends on a fully formed daily candle’s open, high, low, and close values becomes ineffective at that point. From an MQL5 perspective, it is therefore more practical to treat the pattern as a three-candle structure, where each new day references both the previous day and the one before it.
In practical terms, at the start of the week on Monday, we check whether Friday’s candle engulfed Thursday’s. This insight then informs our trading decisions for Monday, rather than attempting to determine whether Monday’s candle engulfs Friday’s, since Monday’s candle is still forming when the market opens. With that reasoning, we developed a refined pattern, illustrated in Figure 6.
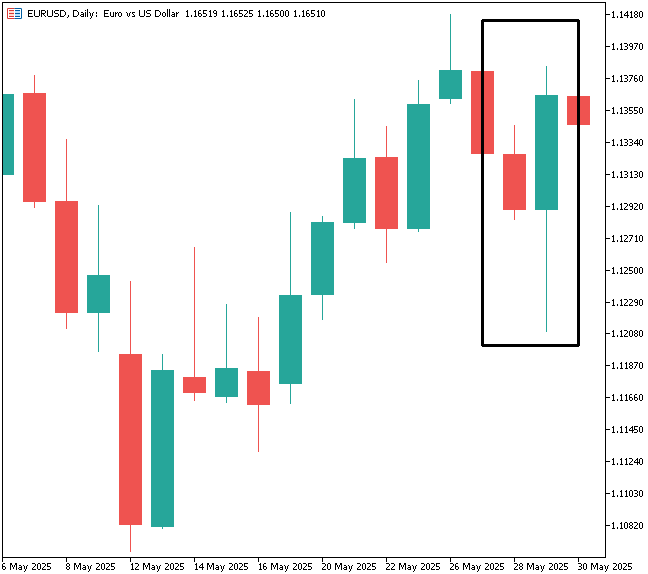
Figure 6: Identifying the improved version of the candlestick pattern we are now looking for
Preliminary test results were encouraging and suggested that the strategy holds promise. However, as always, the data must ultimately speak for itself.
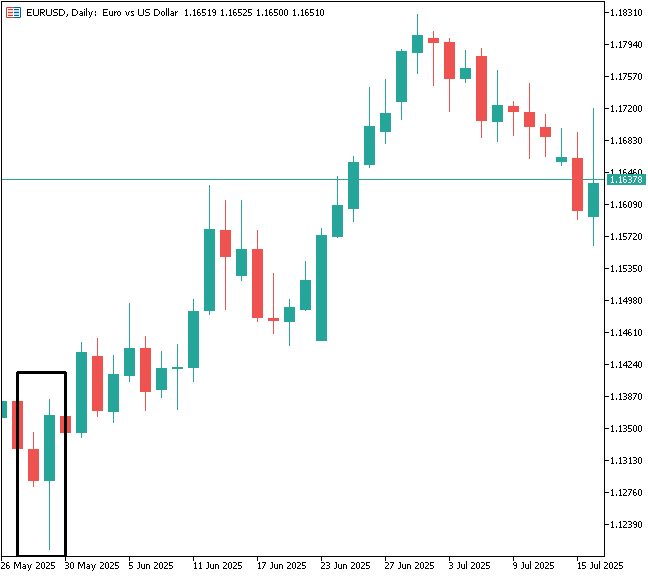
Figure 7: The preliminary results we obtained from our suggested candlestick pattern are encouraging
We updated the trading application accordingly — conditioning entries to check candle wicks instead of relying solely on open and close prices. We also found a better use for the open price: rather than comparing it directly with the close, we evaluated its movement over the previous two days. A rising open price during an engulfing movement signaled bullish sentiment, while a falling open price suggested bearish sentiment.
//--- Then check for a trade
//--- Check for a bullish engulfing candle stick pattern
if((iLow(Symbol(),PERIOD_D1,1)<iLow(Symbol(),PERIOD_D1,2)) && (iHigh(Symbol(),PERIOD_D1,1)>iHigh(Symbol(),PERIOD_D1,2)) && (iOpen(Symbol(),PERIOD_D1,1)>iOpen(Symbol(),PERIOD_D1,2)))
  {
   //--- Then, enter long positions
  Trade.Buy(LOT_SIZE,Symbol(),ask,(ask - (atr[0]*1.5)),(ask + (atr[0]*1.5)));
  }

//--- Otherwise we may check for bearish engulfing candlestick pattern
if((iLow(Symbol(),PERIOD_D1,1)<iLow(Symbol(),PERIOD_D1,2)) && (iHigh(Symbol(),PERIOD_D1,1)>iHigh(Symbol(),PERIOD_D1,2)) && (iOpen(Symbol(),PERIOD_D1,1)<iOpen(Symbol(),PERIOD_D1,2)))
  {
   //--- Then, enter long positions
  Trade.Sell(LOT_SIZE,Symbol(),ask,(ask + (atr[0]*1.5)),(ask - (atr[0]*1.5)));
  }
Re-running the same testing window produced improved results.
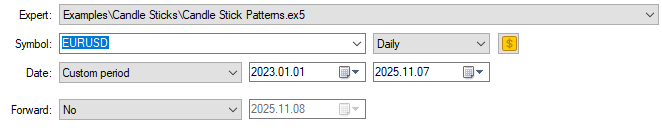
Figure 8: The improved version of our application is ready for testing
Total net profit increased from $126 to $160, while the total number of trades decreased — demonstrating a more efficient use of capital. This indicates that the previous version introduced unnecessary risk in identifying engulfing candles. Interestingly, the proportion of profitable trades remained roughly the same at 55%, which makes sense given that both strategies are variations of the same underlying candlestick concept.
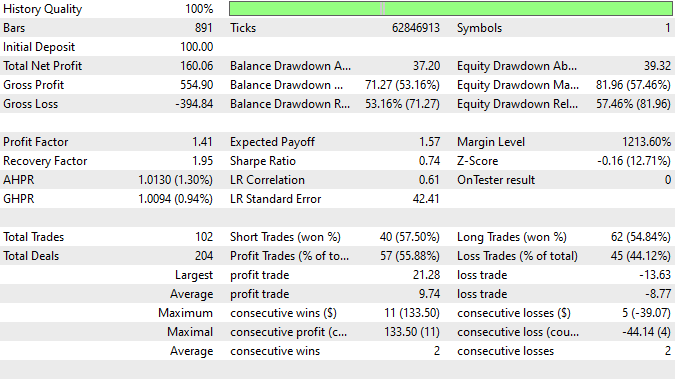
Figure 9: The detailed results we obtained from our improved version of the trading application
Finally, when analyzing the equity curve of the improved pattern, we observed a clear breakout to new highs that the original strategy never achieved.
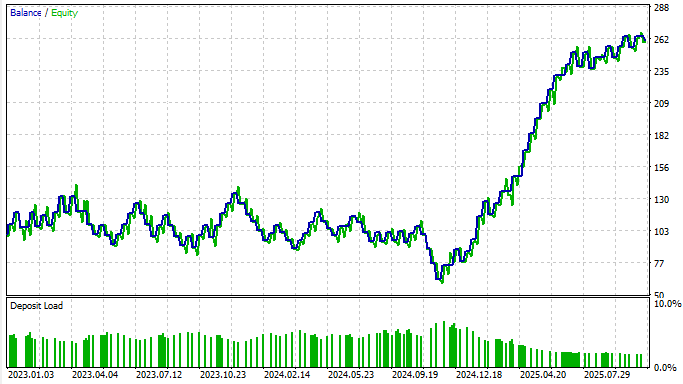
Figure 10: The equity curve produced by our revised version of the trading strategy
Conclusion
In conclusion, this article has shown how to effectively apply the popular engulfing candlestick pattern in a form better suited to the MQL5 platform. It demonstrates that candlestick patterns continue to hold practical value, even in their classical form, and that with thoughtful refinements they can become more robust and capital-efficient.
We also illustrated how to pair these patterns with the ATR indicator to better manage risk, since candlestick formations alone offer no built-in risk guidance. We look forward to continuing this exploration in our next discussion, where we’ll improve upon the second candlestick pattern in our series of five.
| File Name | File Description |
|---|---|
| Candle Stick Benchmark.mq5 | The benchmark version of our application that we designed to establish key performance indicators. |
| Candle Stick Patterns.mq5 | The improved application we created to rise above the previous performance levels we obtained. |
Warning: All rights to these materials are reserved by MetaQuotes Ltd. Copying or reprinting of these materials in whole or in part is prohibited.
This article was written by a user of the site and reflects their personal views. MetaQuotes Ltd is not responsible for the accuracy of the information presented, nor for any consequences resulting from the use of the solutions, strategies or recommendations described.

- Free trading apps
- Over 8,000 signals for copying
- Economic news for exploring financial markets
You agree to website policy and terms of use