MQL5 Programming Articles
Study the MQL5 language for programming trading strategies in numerous published articles mostly written by you - the community members. The articles are grouped into categories to help you quicker find answers to any questions related to programming: Integration, Tester, Trading Strategies, etc.
Follow our new publications and discuss them on the Forum!
Add a new article

You are missing trading opportunities:
- Free trading apps
- Over 8,000 signals for copying
- Economic news for exploring financial markets
Registration
Log in
You agree to website policy and terms of use
If you do not have an account, please register

Category Theory in MQL5 (Part 14): Functors with Linear-Orders
This article which is part of a broader series on Category Theory implementation in MQL5, delves into Functors. We examine how a Linear Order can be mapped to a set, thanks to Functors; by considering two sets of data that one would typically dismiss as having any connection.

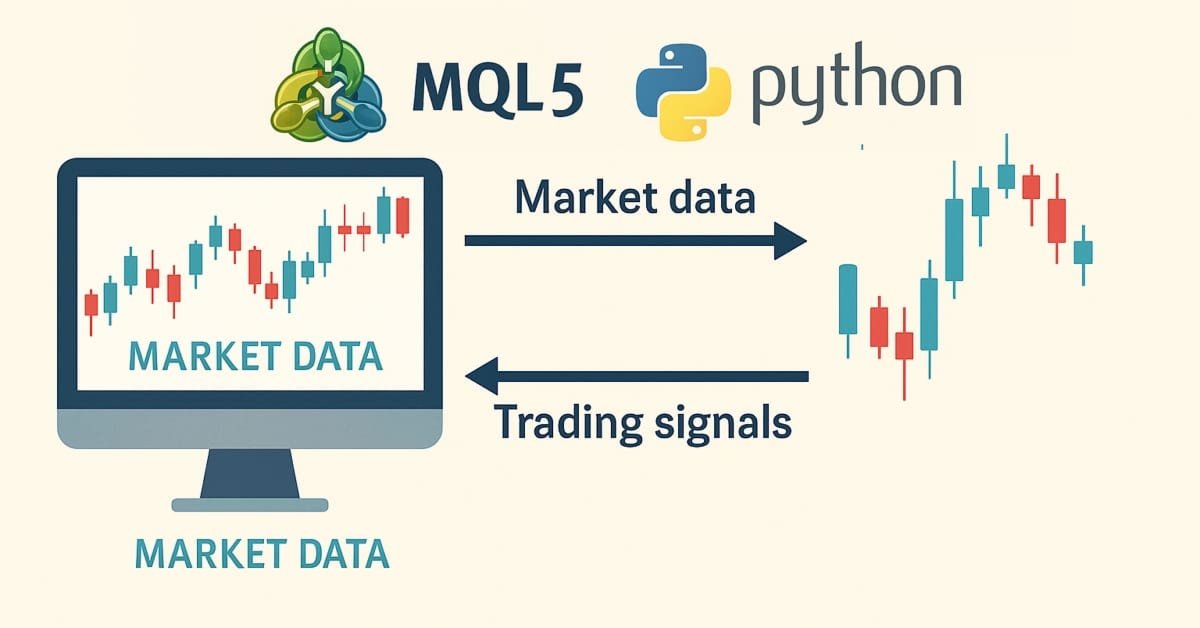
From Python to MQL5: A Journey into Quantum-Inspired Trading Systems
The article explores the development of a quantum-inspired trading system, transitioning from a Python prototype to an MQL5 implementation for real-world trading. The system uses quantum computing principles like superposition and entanglement to analyze market states, though it runs on classical computers using quantum simulators. Key features include a three-qubit system for analyzing eight market states simultaneously, 24-hour lookback periods, and seven technical indicators for market analysis. While the accuracy rates might seem modest, they provide a significant edge when combined with proper risk management strategies.

DoEasy. Controls (Part 7): Text label control
In the current article, I will create the class of the WinForms text label control object. Such an object will have the ability to position its container anywhere, while its own functionality will repeat the functionality of the MS Visual Studio text label. We will be able to set font parameters for a displayed text.

Reimagining Classic Strategies (Part 21): Bollinger Bands And RSI Ensemble Strategy Discovery
This article explores the development of an ensemble algorithmic trading strategy for the EURUSD market that combines the Bollinger Bands and the Relative Strength Indicator (RSI). Initial rule-based strategies produced high-quality signals but suffered from low trade frequency and limited profitability. Multiple iterations of the strategy were evaluated, revealing flaws in our understanding of the market, increased noise, and degraded performance. By appropriately employing statistical learning algorithms, shifting the modeling target to technical indicators, applying proper scaling, and combining machine learning forecasts with classical trading rules, the final strategy achieved significantly improved profitability and trade frequency while maintaining acceptable signal quality.

Creating an MQL5-Telegram Integrated Expert Advisor (Part 2): Sending Signals from MQL5 to Telegram
In this article, we create an MQL5-Telegram integrated Expert Advisor that sends moving average crossover signals to Telegram. We detail the process of generating trading signals from moving average crossovers, implementing the necessary code in MQL5, and ensuring the integration works seamlessly. The result is a system that provides real-time trading alerts directly to your Telegram group chat.

Neural networks made easy (Part 31): Evolutionary algorithms
In the previous article, we started exploring non-gradient optimization methods. We got acquainted with the genetic algorithm. Today, we will continue this topic and will consider another class of evolutionary algorithms.

Developing a trading Expert Advisor from scratch (Part 13): Time and Trade (II)
Today we will construct the second part of the Times & Trade system for market analysis. In the previous article "Times & Trade (I)" we discussed an alternative chart organization system, which would allow having an indicator for the quickest possible interpretation of deals executed in the market.

Cycles and Forex
Cycles are of great importance in our lives. Day and night, seasons, days of the week and many other cycles of different nature are present in the life of any person. In this article, we will consider cycles in financial markets.

Price Action Analysis Toolkit Development (Part 31): Python Candlestick Recognition Engine (I) — Manual Detection
Candlestick patterns are fundamental to price-action trading, offering valuable insights into potential market reversals or continuations. Envision a reliable tool that continuously monitors each new price bar, identifies key formations such as engulfing patterns, hammers, dojis, and stars, and promptly notifies you when a significant trading setup is detected. This is precisely the functionality we have developed. Whether you are new to trading or an experienced professional, this system provides real-time alerts for candlestick patterns, enabling you to focus on executing trades with greater confidence and efficiency. Continue reading to learn how it operates and how it can enhance your trading strategy.

From Novice to Expert: Enhancing Liquidity Strategies with Multi-Timeframe Structural Confirmation in MQL5
The alignment of higher-timeframe liquidity structures with lower-timeframe reversal patterns can greatly influence both the likelihood and direction of the next price movement. By integrating structural liquidity zones from higher timeframes with precise reversal confirmations on lower timeframes, traders can improve entry timing and overall trade quality. This article demonstrates how to reinforce liquidity-based trading strategies through higher-timeframe structural confirmation—and how to implement this approach effectively using MQL5.

Timeseries in DoEasy library (part 48): Multi-period multi-symbol indicators on one buffer in a subwindow
The article considers an example of creating multi-symbol multi-period standard indicators using a single indicator buffer for construction and working in the indicator subwindow. I am going to prepare the library classes for working with standard indicators working in the program main window and having more than one buffer for displaying their data.

Price Action Analysis Toolkit Development (Part 70): Turning Flag Pattern Signals into Automated Trade Execution
The article defines a buffer-based signal architecture for flag breakouts and an EA that consumes it. Breakout arrows and pole height are written to dedicated buffers only after confirmation, preventing repainting and ambiguity. The EA polls buffers with CopyBuffer(), validates signals using configurable filters, and executes trades with fixed or dynamic SL/TP.

Reimagining Classic Strategies (Part 16): Double Bollinger Band Breakouts
This article walks the reader through a reimagined version of the classical Bollinger Band breakout strategy. It identifies key weaknesses in the original approach, such as its well-known susceptibility to false breakouts. The article aims to introduce a possible solution: the Double Bollinger Band trading strategy. This relatively lesser known approach supplements the weaknesses of the classical version and offers a more dynamic perspective on financial markets. It helps us overcome the old limitations defined by the original rules, providing traders with a stronger and more adaptive framework.
From Novice to Expert: Enhancing Liquidity Strategies with Multi-Timeframe Structural Confirmation in MQL5
The alignment of higher-timeframe liquidity structures with lower-timeframe reversal patterns can greatly influence both the likelihood and direction of the next price movement. By integrating structural liquidity zones from higher timeframes with precise reversal confirmations on lower timeframes, traders can improve entry timing and overall trade quality. This article demonstrates how to reinforce liquidity-based trading strategies through higher-timeframe structural confirmation—and how to implement this approach effectively using MQL5.

Automating Trading Strategies in MQL5 (Part 27): Creating a Price Action Crab Harmonic Pattern with Visual Feedback
In this article, we develop a Crab Harmonic Pattern system in MQL5 that identifies bullish and bearish Crab harmonic patterns using pivot points and Fibonacci ratios, triggering trades with precise entry, stop loss, and take-profit levels. We incorporate visual feedback through chart objects like triangles and trendlines to display the XABCD pattern structure and trade levels.

Swing Extremes and Pullbacks in MQL5 (Part 2): Automating the Strategy with an Expert Advisor
Built on lower-timeframe market structure, and then orchestrated on the higher-timeframe, this indicator detects swing extremes where price becomes statistically vulnerable to reversal. It visualizes overextension and pullback zones, offering early insight into mean-reversion behavior.

Automating Trading Strategies in MQL5 (Part 38): Hidden RSI Divergence Trading with Slope Angle Filters
In this article, we build an MQL5 EA that detects hidden RSI divergences via swing points with strength, bar ranges, tolerance, and slope angle filters for price and RSI lines. It executes buy/sell trades on validated signals with fixed lots, SL/TP in pips, and optional trailing stops for risk control.
Graphics in DoEasy library (Part 85): Graphical object collection - adding newly created objects
In this article, I will complete the development of the descendant classes of the abstract graphical object class and start implementing the ability to store these objects in the collection class. In particular, I will create the functionality for adding newly created standard graphical objects to the collection class.
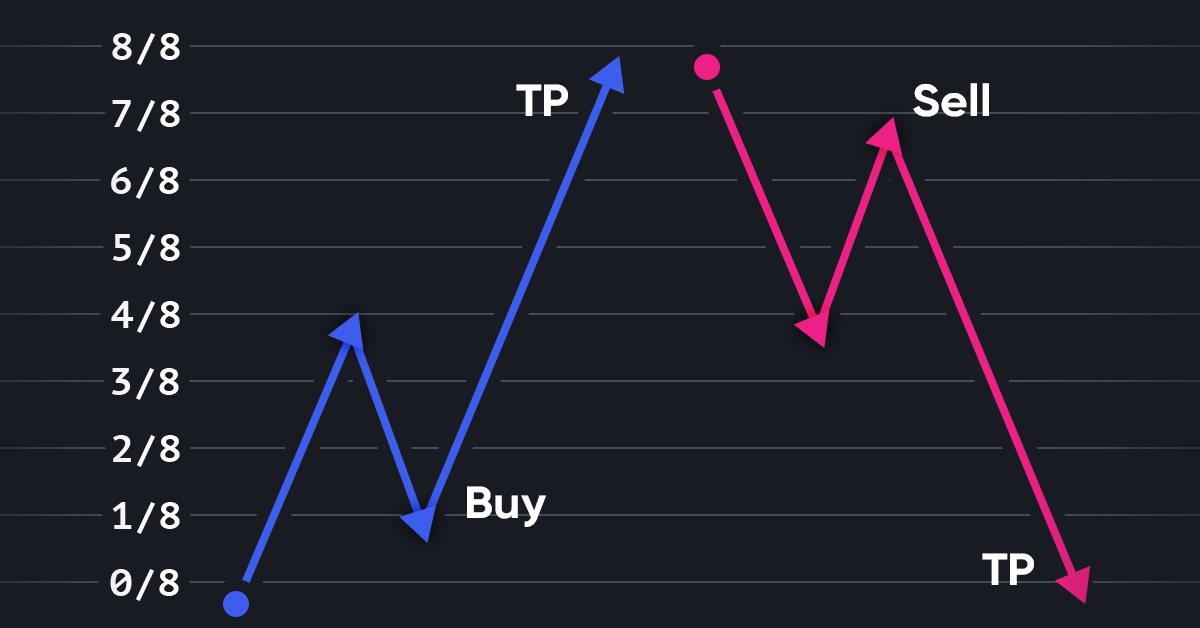
Revisiting Murray system
Graphical price analysis systems are deservedly popular among traders. In this article, I am going to describe the complete Murray system, including its famous levels, as well as some other useful techniques for assessing the current price position and making a trading decision.
Interview with Enbo Lu (ATC 2012)
"Be sure to participate in the Automated Trading Championships, where you can get a truly invaluable experience!" - this is the motto of contestant Enbo Lu (luenbo) from China. He appeared in the TOP-10 of Automated Trading Championship 2012 last week and is now consistently trying to reach the podium.

Data Science and Machine Learning (Part 13): Improve your financial market analysis with Principal Component Analysis (PCA)
Revolutionize your financial market analysis with Principal Component Analysis (PCA)! Discover how this powerful technique can unlock hidden patterns in your data, uncover latent market trends, and optimize your investment strategies. In this article, we explore how PCA can provide a new lens for analyzing complex financial data, revealing insights that would be missed by traditional approaches. Find out how applying PCA to financial market data can give you a competitive edge and help you stay ahead of the curve

Currency pair strength indicator in pure MQL5
We are going to develop a professional indicator for currency strength analysis in MQL5. This step-by-step guide will show you how to develop a powerful trading tool with a visual dashboard for MetaTrader 5. You will learn how to calculate the strength of currency pairs across multiple timeframes (H1, H4, D1), implement dynamic data updates, and create a user-friendly interface.

Category Theory (Part 9): Monoid-Actions
This article continues the series on category theory implementation in MQL5. Here we continue monoid-actions as a means of transforming monoids, covered in the previous article, leading to increased applications.

Color buffers in multi-symbol multi-period indicators
In this article, we will review the structure of the indicator buffer in multi-symbol, multi-period indicators and organize the display of colored buffers of these indicators on the chart.

Price Action Analysis Toolkit Development (Part 23): Currency Strength Meter
Do you know what really drives a currency pair’s direction? It’s the strength of each individual currency. In this article, we’ll measure a currency’s strength by looping through every pair it appears in. That insight lets us predict how those pairs may move based on their relative strengths. Read on to learn more.

Algorithmic Trading Without the Routine: Quick Trade Analysis in MetaTrader 5 with SQLite
The article presents a minimal working set for maintaining a trading journal in MQL5 using SQLite: a table structure for trades, signals, and events, indices, prepared statements and trades, as well as standard analytical SQL queries. Integration with the statistics dashboard in MetaTrader 5 and working with the database via MetaEditor are demonstrated. The approach allows automating the journal, accelerating calculations, and performing analysis without complicating the EA code.
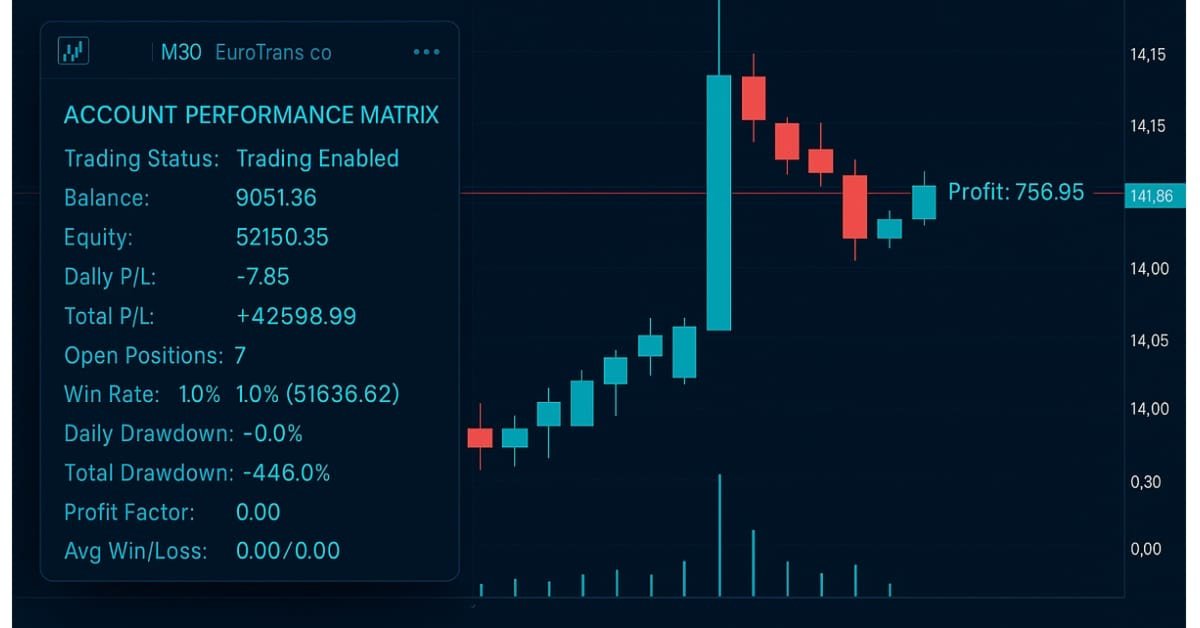
Developing A Custom Account Performance Matrix Indicator
This indicator acts as a discipline enforcer by tracking account equity, profit/loss, and drawdown in real-time while displaying a performance dashboard. It can help traders stay consistent, avoid overtrading, and comply with prop-firm challenge rules.
Graphics in DoEasy library (Part 100): Making improvements in handling extended standard graphical objects
In the current article, I will eliminate obvious flaws in simultaneous handling of extended (and standard) graphical objects and form objects on canvas, as well as fix errors detected during the test performed in the previous article. The article concludes this section of the library description.

Risk manager for manual trading
In this article we will discuss in detail how to write a risk manager class for manual trading from scratch. This class can also be used as a base class for inheritance by algorithmic traders who use automated programs.
Interview with Sergey Pankratyev (ATC 2012)
The Championship is coming to an end leaving us with vivid impressions of many unusual trading strategies. However, the trading robot of Sergey Pankratyev (s75) is showing really peculiar things - it is trading all 12 currency pairs opening only long positions. It is not an error but just a response to some certain market conditions.

Price Action Analysis Toolkit Development (Part 56): Reading Session Acceptance and Rejection with CPI
This article presents a session-based analytical framework that combines time-defined market sessions with the Candle Pressure Index (CPI) to classify acceptance and rejection behavior at session boundaries using closed-candle data and clearly defined rules.

Creating an EA that works automatically (Part 10): Automation (II)
Automation means nothing if you cannot control its schedule. No worker can be efficient working 24 hours a day. However, many believe that an automated system should operate 24 hours a day. But it is always good to have means to set a working time range for the EA. In this article, we will consider how to properly set such a time range.

Price Action Analysis Toolkit Development (Part 61): Structural Slanted Trendline Breakouts with 3-Swing Validation
We present a slanted trendline breakout tool that relies on three‑swing validation to generate objective, price‑action signals. The system automates swing detection, trendline construction, and breakout confirmation using crossing logic to reduce noise and standardize execution. The article explains the strategy rules, shows the MQL5 implementation, and reviews testing results; the tool is intended for analysis and signal confirmation, not automated trading.

Neural Networks in Trading: A Multi-Agent System with Conceptual Reinforcement (Final Part)
We continue to implement the approaches proposed by the authors of the FinCon framework. FinCon is a multi-agent system based on Large Language Models (LLMs). Today, we will implement the necessary modules and conduct comprehensive testing of the model on real historical data.
Price Action Analysis Toolkit Development (Part 35): Training and Deploying Predictive Models
Historical data is far from “trash”—it’s the foundation of any robust market analysis. In this article, we’ll take you step‑by‑step from collecting that history to using it to train a predictive model, and finally deploying that model for live price forecasts. Read on to learn how!

Population optimization algorithms: Gravitational Search Algorithm (GSA)
GSA is a population optimization algorithm inspired by inanimate nature. Thanks to Newton's law of gravity implemented in the algorithm, the high reliability of modeling the interaction of physical bodies allows us to observe the enchanting dance of planetary systems and galactic clusters. In this article, I will consider one of the most interesting and original optimization algorithms. The simulator of the space objects movement is provided as well.

MQL5 Wizard Techniques you should know (Part 09): Pairing K-Means Clustering with Fractal Waves
K-Means clustering takes the approach to grouping data points as a process that’s initially focused on the macro view of a data set that uses random generated cluster centroids before zooming in and adjusting these centroids to accurately represent the data set. We will look at this and exploit a few of its use cases.

Neural networks made easy (Part 49): Soft Actor-Critic
We continue our discussion of reinforcement learning algorithms for solving continuous action space problems. In this article, I will present the Soft Actor-Critic (SAC) algorithm. The main advantage of SAC is the ability to find optimal policies that not only maximize the expected reward, but also have maximum entropy (diversity) of actions.

Introduction to MQL5 (Part 3): Mastering the Core Elements of MQL5
Explore the fundamentals of MQL5 programming in this beginner-friendly article, where we demystify arrays, custom functions, preprocessors, and event handling, all explained with clarity making every line of code accessible. Join us in unlocking the power of MQL5 with a unique approach that ensures understanding at every step. This article sets the foundation for mastering MQL5, emphasizing the explanation of each line of code, and providing a distinct and enriching learning experience.

Data Science and Machine Learning (Part 21): Unlocking Neural Networks, Optimization algorithms demystified
Dive into the heart of neural networks as we demystify the optimization algorithms used inside the neural network. In this article, discover the key techniques that unlock the full potential of neural networks, propelling your models to new heights of accuracy and efficiency.