Canvas based indicators: Filling channels with transparency

Introduction
In this article I'll introduce a method for creating custom indicators whose drawings are made using the class CCanvas from standard library. I'll approach specially indicators which need to fill the area between two lines with a solid color. Before we start, we will see the reasons why using canvas may be the best choice over the option currently available for this kind of indicators. After that we will see some chart properties that are required to calculate coordinates and the basic process that involves working with CCanvas.
The final goal will be to use everything seen until this point to build an indicator applying transparency. All the work will be considering only the main chart window. Once our goal is achieved we can then extend that to working in subwindow indicators.
The topics of this article are listed below:
- Reasons for using Canvas
- Chart window properties
- Understanding the chart window properties
- Chart properties viewer indicator
- Coordinates conversion
- DRAW_FILLING with transparency
- Extending the method to work in subwindow indicators
Reasons for using Canvas
Someone would ask, why to use canvas instead of the DRAW_FILLING already available for custom indicators? There are at least two reasons:
- The colors of the indicator are mixed with the colors of other indicators, candles and chart objects
- DRAW_FILLING do not allow transparency

Chart window properties
To start drawing a custom chart we need think about some chart properties. You can find all properties in the documentation. To get these properties values we need use the appropriate functions ChartGetInteger and ChartGetDouble. There is a ChartGetString also, but we won't work with that here.
The properties we are gonna use are listed down with a short description. If we need some more I'll point it out later.
- CHART_WIDTH_IN_PIXELS — the width of the chart window, not including the price scale
- CHART_HEIGTH _IN_PIXELS — the height of the a subwindow, not including date scale
- CHART_PRICE_MAX — the price corresponding to the top of the subwindow
- CHART_PRICE_MIN — the price corresponding to the bottom of the subwindow
- CHART_SCALE — determines spacing between the bars. After some tests I discovered that it is a power of two value, given by pow(2, CHART_SCALE)
- CHART_FISRT_VISIBLE_BAR — the first visible bar on the chart, from left to right
- CHART_VISIBLE_BARS — the amount of bars visible on the chart
Understanding the chart window properties
These properties can be easily seen in the next picture.

The properties CHART_WIDTH_IN_PIXELS and CHART_HEIGTH _IN_PIXELS we will use the determine the size of the canvas object that we need create to make the drawings. And when the chart window changes, if these properties have changed, we need adjust the canvas size.
For better understanding, we will create a simple indicator that shows the properties and how they change based on price changes and users interactions. We will already start using canvas to understand the canvas drawing process.
Chart properties viewer indicator
At this point it is supposed that you already know how to create a custom indicator. If you don't, you can start by this articles MQL5: Create Your Own Indicator and Exploring options for creating multicolored candlesticks. Let's get started.
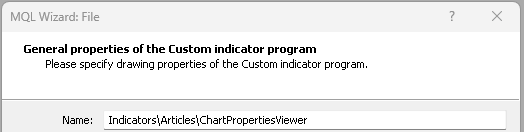
I have created my indicator in this path. I suggest you to do the same for organization purpose.
Once the indicator skeleton is ready we need to add the CCanvas library to the file. We can do that using the #include directive.
Then we create an instance of the CCanvas class. All of these immediately after the indicator #property directives.
#property copyright "Copyright 2023, Samuel Manoel De Souza"
#property link      "https://www.mql5.com/en/users/samuelmnl"
#property version   "1.00"
#property indicator_chart_window

#include <Canvas/Canvas.mqh>
CCanvas Canvas;
The first thing we need to do when working with CCanvas is to create an OBJ_BITMAP_LABEL and attach a resource to it. That shall be done if you want to add it to the chart, usually in the initialization of the indicator, using the method CreateBitampLabel(...). And the last is to delete the OBJ_BITMAP_LABEL and the resource attached to it. That shall be done if you want to remove it from the chart, usually in the indicator deinitialization, using the method Destory(void). In the meantime, we execute the basic drawing process which consist of erase the drawings (clear or set default pixels values to the resource), make the drawings and update the resource. The complete lifecycle of a canvas process is like in the bellow diagram.

For simplicity we will hold the Erase, Draw, Update in a single function called Redraw. Writing everything in the code we get the follow structure.
//+------------------------------------------------------------------+
//| Custom indicator initialization function                         |
//+------------------------------------------------------------------+
int OnInit()
  {
//--- indicator buffers mapping
   Canvas.CreateBitmapLabel(0, 0, "Canvas", 0, 0, 200, 150, COLOR_FORMAT_ARGB_NORMALIZE);
//---
   return(INIT_SUCCEEDED);
  }
//+------------------------------------------------------------------+
//| Custom indicator deinitialization function                       |
//+------------------------------------------------------------------+
void OnDeinit(const int reason)
  {
   Canvas.Destroy();
  }
//+------------------------------------------------------------------+
//| Custom indicator redraw function                                 |
//+------------------------------------------------------------------+
void Redraw(void)
  {
   uint default_color = ColorToARGB(clrBlack);
   uint text_color = ColorToARGB(clrWhite);
//--- canvas erase
   Canvas.Erase(default_color);
//--- add first draw

//--- add second draw

//--- add ... draw

//--- add last draw

//--- canvas update
   Canvas.Update();
  }
To show the properties we will write them using the TextOut method. Those properties values will be stored as string in a struct array variable.
struct StrProperty
  {
   string name;
   string value;
  };
The structure can be as follow. Then we can briefly output them in a loop. As we don't have the array yet, we will pass the array as parameter in the Redraw function. Then, the Redraw function will be as follows:
void Redraw(StrProperty &array[])
  {
   uint default_color = ColorToARGB(clrBlack);
   uint text_color = ColorToARGB(clrWhite);
//--- canvas erase
   Canvas.Erase(default_color);
//--- add first draw
   int total = ArraySize(array);
   for(int i=0;i<total;i++)
     {
      int padding = 2;
      int left = padding, right = Canvas.Width() - padding, y = i * 20 + padding;
      Canvas.TextOut(left, y, array[i].name, text_color, TA_LEFT);
      Canvas.TextOut(right, y, array[i].value, text_color, TA_RIGHT);
     }
//--- canvas update
   Canvas.Update();
  }
Finally we can get the properties values and output them. If your code doesn't have the OnChartEvent function handler, you need to add it. And there we will check the CHARTEVENT_CHART_CHANGE event id. When the event arises we declare some variables to take the properties values and pass them to an struct array and then call Redraw function. And there we go. We can compile the indicator, add it to the chart and manipulate the chart to see the canvas updates.
//+------------------------------------------------------------------+
//| Custom indicator chart event handler function                    |
//+------------------------------------------------------------------+
void OnChartEvent(const int id, const long& lparam, const double& dparam, const string& sparam)
  {
   if(id != CHARTEVENT_CHART_CHANGE)
      return;
   int chart_width         = (int)ChartGetInteger(0, CHART_WIDTH_IN_PIXELS);
   int chart_height        = (int)ChartGetInteger(0, CHART_HEIGHT_IN_PIXELS);
   int chart_scale         = (int)ChartGetInteger(0, CHART_SCALE);
   int chart_first_vis_bar = (int)ChartGetInteger(0, CHART_FIRST_VISIBLE_BAR);
   int chart_vis_bars      = (int)ChartGetInteger(0, CHART_VISIBLE_BARS);
   double chart_prcmin     = ChartGetDouble(0, CHART_PRICE_MIN);
   double chart_prcmax     = ChartGetDouble(0, CHART_PRICE_MAX);
//---
   StrProperty array[]
     {
        {"Width", (string)chart_width},
        {"Height", (string)chart_height},
        {"Scale", (string)chart_scale},
        {"First Vis. Bar", (string)chart_first_vis_bar},
        {"Visible Bars", (string)chart_vis_bars},
        {"Price Min", (string)chart_prcmin},
        {"Price Max", (string)chart_prcmax},
     };
   Redraw(array);
  }
Coordinates conversion
At this point we need some basic functions to make the conversion from datetime or bar index to x in pixels, from price to y in pixels, from x to bar index and from y to price (some of them we won't use now, but we can make them all at once). Because of that we will move the chart properties variables to global scope, while in the OnChartEvent function we will only update values and call Redraw function when needed. The ideal solution is to encapsulate the variables and conversion functions in a class or struct, but let's keep it simple for now. However I suggest you to start learning OOP by reading the article The Basics of Object-Oriented Programming and the related topic in the documentation (Object-Oriented Programming). We will make use of that in a next opportunity.
As the functions basically involve on proportional relationships we won't spend time and words on explanations. They are as follow.
//+------------------------------------------------------------------+
//| Converts the chart scale property to bar width/spacing           |
//+------------------------------------------------------------------+
int BarWidth(int scale) {return (int)pow(2, scale);}
//+------------------------------------------------------------------+
//| Converts the bar index(as series) to x in pixels                 |
//+------------------------------------------------------------------+
int ShiftToX(int shift) {return (chart_first_vis_bar - shift) * BarWidth(chart_scale) - 1;}
//+------------------------------------------------------------------+
//| Converts the price to y in pixels                                |
//+------------------------------------------------------------------+
int PriceToY(double price)
  {
// avoid zero divider
   if(chart_prcmax - chart_prcmin == 0.)
      return 0.;
   return (int)round(chart_height * (chart_prcmax - price) / (chart_prcmax - chart_prcmin) - 1);
  }
//+------------------------------------------------------------------+
//| Converts x in pixels to bar index(as series)                     |
//+------------------------------------------------------------------+
int XToShift(int x)
  {
// avoid zero divider
   if(BarWidth(chart_scale) == 0)
      return 0;
   return chart_first_vis_bar - (x + BarWidth(chart_scale) / 2) / BarWidth(chart_scale);
  }
//+------------------------------------------------------------------+
//| Converts y in pixels to price                                    |
//+------------------------------------------------------------------+
double YToPrice(int y)
  {
// avoid zero divider
   if(chart_height == 0)
      return 0;
   return chart_prcmax - y * (chart_prcmax - chart_prcmin) / chart_height;
  }
DRAW_FILLING with transparency
Now we have everything needed to implement our DRAW_FILLING using CCanvas.
We won't spend time creating a new indicator. Instead let's take an example existing in all MetaTrader 5 platforms and add the filling between two lines. I'll use the Envelopes found in the directory "\\MQL5\\Indicators\\Examples\\" located in the terminal data folder. I'll copy the Envelopes.mq5 to the same directory where I have created the ChartPropertiesViwer indicator. You can choose any indicator but I suggest to use the same indicator while following the steps described in this article.
The first thing we need do is copy everything we have done in the ChartPropertiesViewer indicator to the Envelopes.
As mentioned above we will fill the channel between two lines. For this purpose we will create a function where will pass the arrays corresponding to these line values. In the envelopes indicator the arrays are given by the variables ExtUpBuffer and ExtMABuffer.
double                   ExtUpBuffer[];
double                   ExtDownBuffer[];
Along with the arrays we will pass some more variables that will allow us to use two colors, set a transparency level and shift the indicator to left or right of the chart.
| Parameter | Description of the variable |
|---|---|
| serie1 | Array of values corresponding to the first line |
| serie2 | Array of values corresponding to the second line |
| clr1 | Color for when serie1 >= serie2 |
| clr2 | Color for when serie1 < serie2 |
| alpha | Value for the transparency of the channel |
| plot_shift | Shift the indicator for the right or left of the chart |
And the function using the existing variables and the mentioned parameters is as follow.
//+------------------------------------------------------------------+
//| Fill the area between two lines                                  |
//+------------------------------------------------------------------+
void DrawFilling(double &serie1[], double &serie2[], color clr1, color clr2, uchar alpha = 255, int plot_shift = 0)
  {
   int start  = chart_first_vis_bar;
   int total  = chart_vis_bars + plot_shift;
   uint argb1 = ColorToARGB(clr1, alpha);
   uint argb2 = ColorToARGB(clr2, alpha);
   int limit  = fmin(ArraySize(serie1), ArraySize(serie2));
   int px, py1, py2;
   for(int i = 0; i < total; i++)
     {
      int bar_position = start - i;
      int bar_shift = start - i + plot_shift;
      int bar_index = limit - 1 - bar_shift;
      if(serie1[bar_index] == EMPTY_VALUE || serie1[bar_index] == EMPTY_VALUE || bar_shift >= limit)
         continue;
      int x  = ShiftToX(bar_position);
      int y1 = PriceToY(serie1[bar_index]);
      int y2 = PriceToY(serie2[bar_index]);
      uint argb = serie1[bar_index] < serie2[bar_index] ? argb2 : argb1;
      if(i > 0 && serie1[bar_index - 1] != EMPTY_VALUE && serie2[bar_index - 1] != EMPTY_VALUE)
        {
         if(py1 != py2)
            Canvas.FillTriangle(px, py1, px, py2, x, y1, argb);
         if(y1 != y2)
            Canvas.FillTriangle(px, py2, x, y1, x, y2, argb);
        }
      px  = x;
      py1 = y1;
      py2 = y2;
     }
  }
Until this point we have been using the canvas with a fixed size. However indicators drawings need the canvas to fill the full area of the chart. Even more, whenever the chart window size changes, by maximizing, minimizing, stretching to any side or adding subwindow indicators, we need make sure that the canvas still fills the full area of the chart. To do that we will resize the canvas introducing a small change in our OnChartEvent function.
void OnChartEvent(const int id, const long& lparam, const double& dparam, const string& sparam)
  {
   if(id != CHARTEVENT_CHART_CHANGE)
      return;
   chart_width          = (int)ChartGetInteger(0, CHART_WIDTH_IN_PIXELS);
   chart_height         = (int)ChartGetInteger(0, CHART_HEIGHT_IN_PIXELS);
   chart_scale          = (int)ChartGetInteger(0, CHART_SCALE);
   chart_first_vis_bar  = (int)ChartGetInteger(0, CHART_FIRST_VISIBLE_BAR);
   chart_vis_bars       = (int)ChartGetInteger(0, CHART_VISIBLE_BARS);
   chart_prcmin         = ChartGetDouble(0, CHART_PRICE_MIN, 0);
   chart_prcmax         = ChartGetDouble(0, CHART_PRICE_MAX, 0);
   if(chart_width != Canvas.Width() || chart_height != Canvas.Height())
      Canvas.Resize(chart_width, chart_height);
Now we will make some small updates to get it working.
- Update our Redraw function, removing the parameters that was added in prior indicator and adding the DrawFilling function.
- Add our Redraw function in the OnCalculation, to update the drawing when the indicator values change.
- Change the object name passed as parameter when calling CreateBitmapLabel.
//+------------------------------------------------------------------+
//| Custom indicator redraw function                                 |
//+------------------------------------------------------------------+
void Redraw(void)
  {
   uint default_color = 0;
   color clrup = (color)PlotIndexGetInteger(0, PLOT_LINE_COLOR, 0);
   color clrdn = (color)PlotIndexGetInteger(1, PLOT_LINE_COLOR, 0);
//--- canvas erase
   Canvas.Erase(default_color);
//--- add first draw
   DrawFilling(ExtUpBuffer, ExtDownBuffer,clrup, clrdn, 128, InpMAShift);
//--- canvas update
   Canvas.Update();
  }
//--- the main loop of calculations
   for(int i=start; i<rates_total && !IsStopped(); i++)
     {
      ExtUpBuffer[i]=(1+InpDeviation/100.0)*ExtMABuffer[i];
      ExtDownBuffer[i]=(1-InpDeviation/100.0)*ExtMABuffer[i];
     }
   Redraw();
//--- OnCalculate done. Return new prev_calculated.
   return(rates_total);
Canvas.CreateBitmapLabel(0, 0, short_name, 0, 0, 200, 150, COLOR_FORMAT_ARGB_NORMALIZE);
And that is done. You can see how it looks now with two Envelopes with different periods and one rectangle object.


As you can see the issue with the indicators are solved while the issue with the chart objects is still present, but this is a matter for another chapter.
Extending the method to work in subwindow indicators
See the picture bellow. Here we can see a subwindow indicator using the DRAW_FILLING. This picture was taken from the MQL documentation. We will do the same but allowing transparency using CCanvas, and more important, avoiding the overlap areas issues.

The changes we need to do are listed below:
- Create the bitmap label in the same subwindow where the indicator is located
- Resize the canvas based on the subwindow size instead of the main chart window
To create the bitmap label in the same subwindow and get the size of the subwindow, we need to find in which subwindow the indicator is placed. We could think that it is simply the last subwindow of the chart, but the terminal allows to place two or more indicator on the same subwindow, not necessarily the last subwindow. Then we need a function that returns the number of the subwindow where the indicator is located. Take a look at the following function:
//+------------------------------------------------------------------+
//| return the number of the subwindow where the indicator is located|
//+------------------------------------------------------------------+
int ChartIndicatorFind(string shortname)
  {
   int subwin = ChartGetInteger(0, CHART_WINDOWS_TOTAL);
   while(subwin > 0)
     {
      subwin--;
      int total = ChartIndicatorsTotal(0, subwin);
      for(int i = 0; i < total; i++)
        {
         string name = ChartIndicatorName(0, subwin, i);
         if(name == shortname)
            return subwin;
        }
     }
   return -1;
  }
In the last indicator we have used the Envelopes indicator as example. Now we will use the code from the documentation, the topic DRAW_FILLING as source for our example. We can create a new indicator in the same directory in which we have previously created two indicators. Let's name it as "SubwindowIndicator". Then copy the code from the documentation.
This indicator is plotted using the DRAW_FILLING. As we will use CCanvas to fill the channel, we can replace the plot type by lines. Bellow are the changes in the indicator properties.
#property indicator_plots   2
//--- plot Intersection
#property indicator_label1  "Fast"
#property indicator_type1   DRAW_LINE
#property indicator_color1  clrRed
#property indicator_width1  1
#property indicator_label2  "Slow"
#property indicator_type2   DRAW_LINE
#property indicator_color2  clrBlue
#property indicator_width2  1
And the changes in the OnInit function.
//--- indicator buffers mapping
   SetIndexBuffer(0,IntersectionBuffer1,INDICATOR_DATA);
   SetIndexBuffer(1,IntersectionBuffer2,INDICATOR_DATA);
//---
   PlotIndexSetInteger(0,PLOT_SHIFT,InpMAShift);
   PlotIndexSetInteger(1,PLOT_SHIFT,InpMAShift);
Also we don't need the indicator to change the line appearance, then we can comment this line in OnCalculate function.
//--- If a sufficient number of ticks has been accumulated
   if(ticks>=N)
     {
      //--- Change the line properties
      //ChangeLineAppearance();
      //--- Reset the counter of ticks to zero
      ticks=0;
     }
Now we can add our chart properties variables and our functions created in this article. In this indicator, the arrays that we need to pass as parameters to the DrawFilling function have different names. So, we need change it in the Redraw function
double         IntersectionBuffer1[];
double         IntersectionBuffer2[];
And the Redraw function becomes:
//+------------------------------------------------------------------+
//| Custom indicator redraw function                                 |
//+------------------------------------------------------------------+
void Redraw(void)
  {
   uint default_color = 0;
   color clrup = (color)PlotIndexGetInteger(0, PLOT_LINE_COLOR, 0);
   color clrdn = (color)PlotIndexGetInteger(1, PLOT_LINE_COLOR, 0);
//--- canvas erase
   Canvas.Erase(default_color);
//--- add first draw
   DrawFilling(IntersectionBuffer1, IntersectionBuffer2, clrup, clrdn, 128, InpMAShift);
//--- canvas update
   Canvas.Update();
  }
After compiling the code we have the expected result.

Conclusion
In this article we have seen the basic process that involves working with CCanvas, some chart properties, how to get their values and use them to make some basic coordinates conversions that is useful and applicable to numerous purposes. After that we were able to develop an indicator with transparency. And extend the method for working with subwindow indicators was our final task.
The files of the indicators developed in this article can be found in the end of this article for download.
Warning: All rights to these materials are reserved by MetaQuotes Ltd. Copying or reprinting of these materials in whole or in part is prohibited.
This article was written by a user of the site and reflects their personal views. MetaQuotes Ltd is not responsible for the accuracy of the information presented, nor for any consequences resulting from the use of the solutions, strategies or recommendations described.

- Free trading apps
- Over 8,000 signals for copying
- Economic news for exploring financial markets
You agree to website policy and terms of use
Good day!
Is it realistic to realise that when scrolling the chart, the frame follows the candlesticks without delay as in the case with objects?
Good time!
Is it realistic to realise that when scrolling the chart, the frame follows the candlesticks without delay as in the case with objects?
It is possible to fiddle with OBJ_BITMAP, when the upper left corner of the picture is bound to the price-time with overlapping of the window itself, i.e. when the size of the canvas is larger than the size of the window itself.
In this case you can achieve almost complete absence of delay.
But there arises the problem of changing the vertical scale and the event model becomes much more complicated.
That's why I personally wouldn't do this.
There is another alternative - to disable the native chart and form your own one on the canvas. But it is suitable if you don't need to use other indicators on this chart.
Great job Samuel!
But I saw a situation here: using it in my indicator, every time the PRICES axis re-scales, we see that CANVAS does not update itself.
See the images:
and here, after I resize manually the window and everything had been fixed automatically, when the current candle crossed the bounds the chart causing a complete re-scaling of candles, the CANVAS did not re-scale again, as it should:
Also, I can see that the DrawFilling function consumes a lot of time if we use it twice, I mean, to plot 2 colors among three lines (see above). I guess it would be interesting if we could optimize the routine for speed.
Anyway, great job and article - congrats!