
Price Action Analysis Toolkit Development (Part 55): Designing a CPI Mini-Candle Overlay for Intra-bar Pressure

Contents
- Introduction
- Concept and Theory
- Indicator Design
- Alerts and Event Logic
- MQL5 Implementation
- Testing
- Conclusion
Introduction
Most traders learn to interpret candlesticks using a simple color code: green suggests buying, and red suggests selling. In practice, however, price rarely behaves in such a binary manner. Each candle represents a continuous negotiation between buyers and sellers, and the closing price reflects only where that struggle ended, not how strongly either side dominated during the bar. As a result, two candles may appear similar in color and size while conveying very different information: one may close decisively near the high, signaling sustained buying pressure, while another may finish weakly despite being green.
A helpful analogy is a football match. The final score (for example, 1–0) indicates who won, but it does not describe how the match was played. A team can lose by a single goal while controlling possession, spending most of the game in the opponent’s half, and creating better chances. Candlesticks function similarly. Candle color indicates whether the price closed above or below the open, but it often obscures which side controlled most of the movement within the bar—and how strong that control actually was.

This article introduces Candle Pressure Index Mini-Candles for MetaTrader 5, a compact overlay based on Closing Location Value (CLV) that reveals this hidden information. The indicator measures where price closes within each bar’s range and visualizes the result as mid-anchored mini-candles. Both the direction and size of each mini-candle reflect intra-bar pressure, allowing traders to see whether buying or selling dominated and also how strong that dominance was. Candles are categorized into neutral, mild, and strong pressure zones, with optional arrows highlighting high-pressure bars and event-based alerts signaling strong-zone entries or changes in CPI direction.
By adding this additional layer of information, CPI Mini-Candles helps identify situations in which candle color alone is insufficient—such as a candle that closes slightly red yet finishes near the top of its range (“red-but-bullish”)—and also distinguishes between candles that share the same color but differ significantly in pressure strength. The indicator is intended strictly for analytical purposes and does not execute trades. It visualizes price behavior only and does not provide trade recommendations.
The sections that follow examine the candle anatomy underlying the CPI framework, derive the CLV-based formula, detail the MQL5 implementation of the visualization and alert logic, and present practical examples with reproducible testing procedures so that everyone can evaluate and adapt the tool within their own price-action workflows.
Concept and Theory
Before introducing the Candle Pressure Price Index (CPI) and its calculation, it is helpful to revisit the basic structure of a candlestick. CPI builds directly on candle anatomy: it uses the candle’s full range and the position of the close to estimate whether the market accepted prices near the high, near the low, or somewhere in between.
A candlestick summarizes all trading activity over a fixed time interval in a compressed form. The candle’s color indicates whether the close finished above or below the open, but its structure (range, body, and wicks) provides additional information about where price traveled, where it was rejected, and where it ultimately settled. CPI focuses on this internal structure rather than on candle color alone.
Candle Anatomy Refresher
A candlestick is defined by four key price points:
- Open—the price at which the candle begins
- High—the highest traded price during the interval
- Low—the lowest traded price during the interval
- Close—the price at which the candle ends
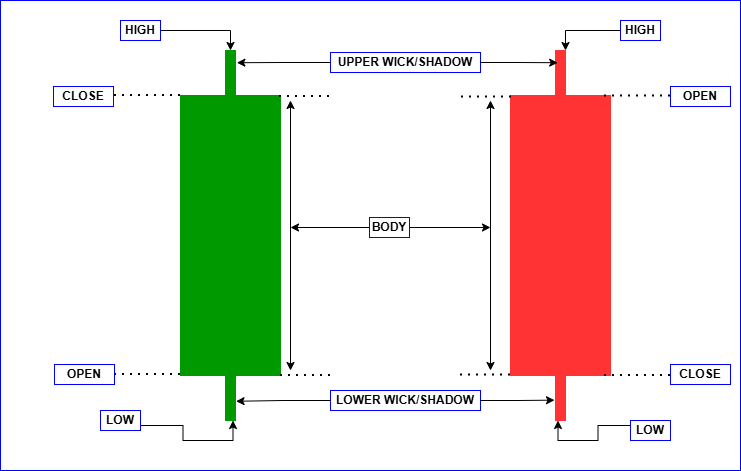
From these values, we derive three structural components:
Range
The range represents the total distance between the high and the low:
- Range = High – Low
It defines the full area within which buyers and sellers interacted during the candle.
Body
The body is the distance between the open and the close. Candle color is derived from this relationship:
- Close above open—bullish (green)
- Close below open—bearish (red)
The body reflects the candle’s outcome, but it does not describe where the close occurred within the full range.
Wicks (Shadows)
The upper and lower wicks indicate price rejection:
- The upper wick marks prices that were reached but not sustained into the close.
- The lower wick marks prices that were reached but not sustained into the close.
Wicks often contain important information about rejection and absorption, details that candle color alone does not reveal.
From Candle Structure to CPI
Candle Pressure Index (CPI) is a normalized value in the range [-1, +1] that measures where a candle closes within its high–low range, indicating bullish pressure when the close is near the high and bearish pressure when the close is near the low. While candle color indicates whether the price closed above or below the open, it does not reveal whether the close occurred near the high, near the low, or somewhere in between. The Candle Pressure Index (CPI) addresses this limitation by measuring the closing location within the candle’s range.
Closing Location in Range
Conceptually:
- A close near the high suggests sustained buying pressure.
- A close near the low suggests sustained selling pressure.
- A close near the middle suggests market balance or absorption.
To quantify this concept, CPI employs the Closing Location Value (CLV) formula:

CPI Value Range
This formula normalizes the result within a fixed scale:
- +1—close at the high (maximum buying pressure)
- 0—close at the midpoint (balanced pressure)
- −1—close at the low (maximum selling pressure)
Normalization enables consistent comparison of CPI values across various instruments and timeframes.
- Edge Case: High = Low
When the high equals the low, the candle has no range. In such cases, CPI is undefined and treated as neutral (0). This avoids division by zero and appropriately reflects the absence of directional pressure.
Practical Interpretation (Scenarios)
CPI becomes most informative when applied to actual candlestick behavior. The following scenarios illustrate how CPI adds insight beyond what is conveyed by candle color alone.
Red Candle with Strong Bullish CPI (“Red-but-Bullish”)
A candle may close slightly below its open (red), yet still finish near the top of its range. This indicates that although sellers won the candle by outcome, buyers dominated most of the intra-bar movement. CPI captures this by returning a positive, often strong, value despite the red candle.
Green Candle with Bearish CPI (“Green-but-Weak”)
A candle may close above its open (green), yet finish near the lower portion of its range. This suggests that although buyers technically secured the close, sellers exerted pressure throughout the session. CPI reflects this weakness through a low or even negative value, despite the green candle.
Neutral CPI Example
When the price closes near the midpoint of the range, the CPI approaches zero. This reflects balanced participation, where neither buyers nor sellers exerted dominant pressure, regardless of the candle’s color.
Why This Matters
- Traditional candlestick analysis emphasizes outcome.
- CPI emphasizes pressure and dominance.
By combining candle anatomy with closing location, CPI enables you to evaluate:
- Direction—who dominated the session
- Strength—how strongly they dominated
Indicator Design
The indicator provides a compact CPI visualization on the main chart without altering the original price candles. CPI is displayed per bar using a small candle-like marker, optional strong-zone arrows, and color-coded zones for rapid interpretation.
Visualization Rules
- Closed candles only: CPI is calculated only for bars where i ≥ 1. Bar 0 (the currently forming bar) is excluded to avoid unstable values and repeated alert conditions.
- Mid anchoring: Each marker is centered at the midpoint of the bar.

This positioning ensures that the marker remains visually independent from the bar’s high and low.
- Height proportional to |CPI| (clamped): Marker height increases with the absolute value of CPI and is constrained within the interval MinMarkerPoints, MaxMarkerPoints (in points), ensuring legibility across different symbols and volatility regimes.
Zones and Colors
Two threshold values define five CPI zones:
- StrongThreshold (e.g., 0.60)
- MildThreshold (e.g., 0.20)
Defined Zones:
- Strong Buy: CPI ≥ +StrongThreshold
- Mild Buy: +MildThreshold ≤ CPI < +StrongThreshold
- Neutral: −MildThreshold < CPI < +MildThreshold
- Mild Sell: −StrongThreshold < CPI ≤ −MildThreshold
- Strong Sell: CPI ≤ −StrongThreshold
Each zone is assigned a distinct color for quick and intuitive recognition.
Strong Arrows (Optional)
When enabled, arrows are drawn only for candles within strong zones:
Strong Buy arrow: Plotted below the low.
- Low—OffsetPoints × Point
Strong Sell arrow: Plotted above the high.
- High + OffsetPoints × Point
The OffsetPoints value ensures that the arrow does not overlap with the price candle or the mini-marker.
Figure below—CPI Mini-Candle Visualization.
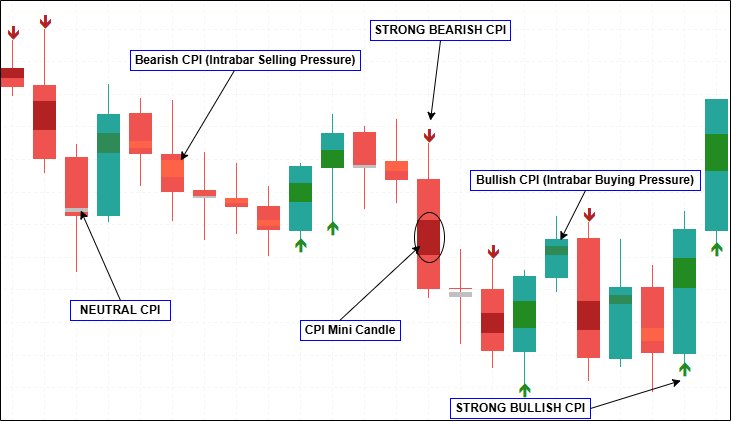
CPI values are displayed as compact, mid-anchored mini-candles on each closed bar. Marker direction indicates buying or selling pressure, marker height reflects pressure strength, and arrows highlight strong CPI zones. Candle color and CPI pressure may differ, revealing intra-bar dynamics not visible from price alone.
Alerts and Event Logic
The alert system is based on a simple principle: notify on change rather than on persistence. CPI values can remain within the same pressure zone for several consecutive bars, and issuing repeated alerts on every candle introduces noise without enhancing practical value. For this reason, alerts are generated only when CPI transitions between defined states, and only on closed bars. Each closed bar is assigned a discrete CPI state based on the configured thresholds: Strong Buy, Mild Buy, Neutral, Mild Sell, and Strong Sell. Rather than reacting to raw CPI values, the alert logic compares the current state with the previous state and triggers events only when a meaningful transition occurs.
The primary alert event is entry into a strong pressure zone. This occurs when CPI shifts from neutral or mild into either strong buy or strong sell. Because this reflects a clear change in close-location pressure, it is the most selective and typically the most informative alert. Optional alerts are available for strong-zone exits and for CPI sign flips. A strong-zone exit indicates weakening directional pressure, while a sign flip captures a change in directional bias that may occur within mild or neutral zones. Since sign flips can occur more frequently, they are separated from strong-zone alerts and can be disabled if desired.
To prevent duplication, all events are evaluated once per newly closed bar, with at most one alert per bar. The same event logic is applied across all notification channels to ensure consistent behavior regardless of delivery method.
MQL5 Implementation
This section describes how the CPI Mini-Candles concept is implemented in MetaTrader 5, with a focus on rendering, calculation flow, and alert handling. Particular emphasis is placed on deterministic behavior, non-repainting logic, and visual clarity.
Rendering Approach (Plots and Buffers)
The indicator is rendered directly within the main chart window and utilizes three plots, each serving a distinct visual function. CPI is displayed using compact, candle-like markers that overlay price without modifying the original market candles. This design preserves traditional price action while augmenting it with intra-bar pressure information.
The primary visualization is handled by the first plot, which uses the DRAW_COLOR_CANDLES drawing mode to render CPI mini-candles. Because this mode requires candle-style input, the plot is supported by five buffers: synthetic Open, High, Low, and Close values that define each CPI marker’s geometry, and a color index buffer that selects one of five predefined palette colors. These synthetic OHLC values are not derived from actual market data; instead, they are constructed from the CPI calculation by centering the marker at the candle midpoint and scaling its height according to pressure strength. The color-index buffer maps each marker to a zone—strong buy, mild buy, neutral, mild sell, or strong sell—allowing both direction and intensity to be conveyed visually.
Two additional plots are used to display strong CPI events without cluttering the mini-candle layer. The second plot is a DRAW_ARROW plot dedicated to strong bullish CPI bars, and the third plot is a separate DRAW_ARROW plot for strong bearish bars. Keeping buy and sell arrows in separate plots allows for independent styling and ensures that only the appropriate arrow appears on each bar. By separating continuous pressure visualization (mini-candles) from discrete event markers (arrows), the rendering logic remains clear, deterministic, and visually balanced.
#property indicator_chart_window
#property indicator_plots 3
#property indicator_buffers 7

#property indicator_label1  "CPI MiniCandles"
#property indicator_type1   DRAW_COLOR_CANDLES
#property indicator_color1  clrForestGreen, clrSeaGreen, clrSilver, clrTomato, clrFireBrick
#property indicator_width1  2

#property indicator_label2  "CPI Strong Buy"
#property indicator_type2   DRAW_ARROW
#property indicator_color2  clrForestGreen

#property indicator_label3  "CPI Strong Sell"
#property indicator_type3   DRAW_ARROW
#property indicator_color3  clrFireBrick

double BufOpen[], BufHigh[], BufLow[], BufClose[], BufColorIndex[];
double BufBuyArrow[], BufSellArrow[];
Inputs (Visual Sizing, Zones, Arrows, Alerts)
User inputs are grouped by functional category to maintain an intuitive configuration interface and to separate visual concerns from analytical logic. Visual parameters control the scaling and clamping of CPI mini-candles (in points), ensuring that markers remain legible across various instruments and volatility regimes. A range-based noise gate (InpMinRangePoints) suppresses CPI calculation on candles with minimal range, where intra-bar pressure is less meaningful. This helps reduce false positives and low-quality signals.
Zone thresholds define how CPI values are classified into mild and strong pressure states, forming the basis for both color assignment and alert generation. Arrow markers and alerts are implemented as optional features. Each can be enabled or disabled independently, allowing users to tailor the indicator’s visual output and notification behavior without modifying the underlying CPI computation.
input double InpMarkerScale        = 0.25;
input int    InpMinMarkerPoints    = 2;
input int    InpMaxMarkerPoints    = 200;
input int    InpMinRangePoints     = 5;
input bool   InpHideNeutralMarkers = false;
input bool   InpShowLatestInfo     = true;

input double InpStrongThreshold    = 0.60;
input double InpMildThreshold      = 0.20;

input bool InpShowStrongArrows     = true;
input int  InpArrowOffsetPoints    = 10;
input int  InpArrowCodeBuy         = 233;
input int  InpArrowCodeSell        = 234;

input bool   InpEnableAlerts       = true;
input bool   InpAlertOnExit        = false;
input bool   InpAlertOnSignFlip    = true;
input bool   InpPopupAlert         = true;
input bool   InpSoundAlert         = false;
input string InpSoundFile          = "alert.wav";
input bool   InpPushAlert          = false;
input bool   InpEmailAlert         = false;
CPI Formula and Helper Utilities
CPI is calculated using a Closing Location Value (CLV)–style normalization, which measures where the closing price lies relative to the candle’s full range. This produces a bounded value in the interval [−1,+1] for all candles with nonzero range, allowing pressure strength to be compared consistently across different symbols and timeframes. In cases where a candle has no range—i.e., when High equals Low—the CPI value is treated as neutral (0.0). This both avoids division by zero and correctly reflects the absence of directional pressure.
In addition to the CPI calculation, a small clamping utility is used during rendering to constrain the height of CPI mini-candles within the user-defined minimum and maximum bounds. This ensures that the markers remain visible but not visually dominant, preserving chart clarity under varying volatility conditions.
double ClampVal(const double v, const double lo, const double hi)
{
   if(v < lo) return lo;
   if(v > hi) return hi;
   return v;
}

double CalcCPI(const double high, const double low, const double close)
{
   double range = high - low;
   if(range <= 0.0)
      return 0.0;
   return (2.0*close - high - low) / range;
}
Zone Classification and Color Mapping
CPI mini-candles are classified into five discrete visual zones to simplify interpretation while preserving both the direction and strength of intra-bar pressure. These zones are implemented using an enumeration whose numeric order is intentionally aligned with the order of colors specified in indicator_color1. This alignment is critical, as the DRAW_COLOR_CANDLES plot selects colors by index, not by name. A helper function, ColorFromCPI(), maps each computed CPI value to the appropriate palette index, based on the configured mild and strong thresholds. This ensures that each mini-candle is rendered with the correct color.
In parallel, the function ZoneNameFromCPI() converts the same CPI value into a human-readable label, which is used for informational output such as on-chart status text or tooltips. By deriving both visual coloring and textual classification from the same logic, the implementation guarantees consistency between what is displayed on the chart and what is reported to the user.
enum CPIColorIndex
{
   IDX_STRONG_BUY = 0,
   IDX_MILD_BUY   = 1,
   IDX_NEUTRAL    = 2,
   IDX_MILD_SELL  = 3,
   IDX_STRONG_SELL= 4
};

int ColorFromCPI(const double cpi)
{
   double a = MathAbs(cpi);

   if(a < InpMildThreshold)
      return IDX_NEUTRAL;

   if(cpi >= 0.0)
   {
      if(a >= InpStrongThreshold) return IDX_STRONG_BUY;
      return IDX_MILD_BUY;
   }
   else
   {
      if(a >= InpStrongThreshold) return IDX_STRONG_SELL;
      return IDX_MILD_SELL;
   }
}

string ZoneNameFromCPI(const double cpi)
{
   double a = MathAbs(cpi);
   if(a < InpMildThreshold) return "NEUTRAL";
   if(cpi >= 0.0)
   {
      if(a >= InpStrongThreshold) return "STRONG BUY";
      return "MILD BUY";
   }
   else
   {
      if(a >= InpStrongThreshold) return "STRONG SELL";
      return "MILD SELL";
   }
}
Strong-State Extraction (for Transition-Based Alerts)
For alert processing, CPI values are further reduced to a simplified strong-state representation. Instead of evaluating the full five-zone classification, the code maps CPI into three discrete states:
- +1 for strong buy pressure
- −1 for strong sell pressure
- 0 for all non-strong conditions (mild or neutral)
This abstraction allows the alert logic to focus exclusively on meaningful dominance transitions, ignoring minor fluctuations that do not warrant notification. By comparing the current strong state with the previous one, the system can detect strong-zone entries and exits using minimal branching logic. This approach also prevents repeated alerts while CPI remains in the same strong state across consecutive candles, ensuring that notifications are triggered only when a genuine transition occurs.
int StrongStateFromCPI(const double cpi)
{
   if(cpi >=  InpStrongThreshold) return +1;
   if(cpi <= -InpStrongThreshold) return -1;
   return 0;
}
Alert Routing (Delivery Channels)
All alert events—including strong-zone entries, strong-zone exits, and CPI sign flips—are routed through a centralized alert-handling function. This design ensures consistent behavior across all supported notification channels, including terminal popups, sound alerts, push notifications, and email. Each delivery method is controlled by its own input flag, allowing users to enable or disable specific channels without modifying the underlying alert logic. This separation keeps alert detection deterministic while making notification preferences flexible.
void FireAlert(const string msg)
{
   if(!InpEnableAlerts) return;

   if(InpPopupAlert) Alert(msg);
   if(InpSoundAlert) PlaySound(InpSoundFile);
   if(InpPushAlert)  SendNotification(msg);
   if(InpEmailAlert) SendMail("CPI Alert", msg);
}
Initialization (OnInit): Buffer Binding, Arrows, Series Mode
During initialization, the OnInit() function binds all indicator buffers to their respective plots in the required order. This includes associating the synthetic Open, High, Low, Close, and color index buffers with the DRAW_COLOR_CANDLES plot, as well as linking arrow buffers to their respective DRAW_ARROW plots. Wingdings arrow codes are assigned at this stage, and empty values are configured so that arrows remain hidden when not applicable. All buffers are explicitly set to series mode, ensuring that index 0 corresponds to the most recent bar and aligns correctly with the price arrays passed into OnCalculate().
int OnInit()
{
   SetIndexBuffer(0, BufOpen,       INDICATOR_DATA);
   SetIndexBuffer(1, BufHigh,       INDICATOR_DATA);
   SetIndexBuffer(2, BufLow,        INDICATOR_DATA);
   SetIndexBuffer(3, BufClose,      INDICATOR_DATA);
   SetIndexBuffer(4, BufColorIndex, INDICATOR_COLOR_INDEX);

   PlotIndexSetInteger(0, PLOT_COLOR_INDEXES, 5);

   SetIndexBuffer(5, BufBuyArrow, INDICATOR_DATA);
   PlotIndexSetInteger(1, PLOT_ARROW, InpArrowCodeBuy);
   PlotIndexSetDouble(1, PLOT_EMPTY_VALUE, EMPTY_VALUE);

   SetIndexBuffer(6, BufSellArrow, INDICATOR_DATA);
   PlotIndexSetInteger(2, PLOT_ARROW, InpArrowCodeSell);
   PlotIndexSetDouble(2, PLOT_EMPTY_VALUE, EMPTY_VALUE);

   IndicatorSetString(INDICATOR_SHORTNAME, "CPI MiniCandles (CLV) + Strong Arrows");

   ArraySetAsSeries(BufOpen, true);
   ArraySetAsSeries(BufHigh, true);
   ArraySetAsSeries(BufLow, true);
   ArraySetAsSeries(BufClose, true);
   ArraySetAsSeries(BufColorIndex, true);
   ArraySetAsSeries(BufBuyArrow, true);
   ArraySetAsSeries(BufSellArrow, true);

   return INIT_SUCCEEDED;
}
Main Calculation (OnCalculate): Closed Bars, Noise Gate, Marker Construction
The main calculation loop operates only on closed candles, processing bars with index i ≥ 1. The forming candle (index 0) is excluded to prevent unstable values and repainting behavior. For each processed bar, all relevant buffers are cleared first to avoid residual data from previous calculations.
double point    = SymbolInfoDouble(_Symbol, SYMBOL_POINT);
double minMarker= InpMinMarkerPoints * point;
double maxMarker= InpMaxMarkerPoints * point;
double minRange = InpMinRangePoints  * point;

for(int i = rates_total - 1; i >= 1; --i)
{
   BufOpen[i] = BufHigh[i] = BufLow[i] = BufClose[i] = EMPTY_VALUE;
   BufColorIndex[i] = EMPTY_VALUE;
   BufBuyArrow[i]  = EMPTY_VALUE;
   BufSellArrow[i] = EMPTY_VALUE;

   double range = high[i] - low[i];

   double cpi = 0.0;
   if(range > 0.0 && range >= minRange)
      cpi = CalcCPI(high[i], low[i], close[i]);

   int colorIdx = ColorFromCPI(cpi);

   if(!(InpHideNeutralMarkers && colorIdx == IDX_NEUTRAL))
   {
      double mid = 0.5 * (high[i] + low[i]);

      double height = range * InpMarkerScale * MathAbs(cpi);
      height = ClampVal(height, minMarker, maxMarker);

      double o = mid;
      double c = (cpi >= 0.0 ? mid + height : mid - height);

      BufOpen[i]  = o;
      BufClose[i] = c;
      BufHigh[i]  = MathMax(o, c);
      BufLow[i]   = MathMin(o, c);
      BufColorIndex[i] = (double)colorIdx;
   }
}
CPI is computed only if the candle’s total range exceeds the configured noise gate; otherwise, the bar is treated as neutral. When CPI is valid, the mini-candle marker is centered at the candle midpoint. Its height is derived from the candle’s range, scaled by the absolute CPI value and the user-defined scale factor. This height is then clamped between the minimum and maximum marker sizes to ensure consistent visual scaling. If configured, neutral markers can be hidden entirely to reduce chart clutter.
Strong Arrows (Optional Overlay)
Strong arrows are drawn only when the feature is enabled and only for candles that pass the noise gate. This prevents arrows from appearing on petite candles where CPI is forced to neutral. Strong bullish events are marked with arrows plotted below the candle’s low, while strong bearish events are marked with arrows plotted above the candle’s high. A point-based offset is applied to prevent visual overlap with the price candle or the CPI mini-marker.
double arrowOff = InpArrowOffsetPoints * point;

if(InpShowStrongArrows && range >= minRange)
{
   if(cpi >= InpStrongThreshold)
      BufBuyArrow[i]  = low[i] - arrowOff;
   else if(cpi <= -InpStrongThreshold)
      BufSellArrow[i] = high[i] + arrowOff;
}
Hiding Bar 0 (Forming Candle)
To guarantee stable, non-repainting output, the forming candle (index 0) is explicitly hidden for both CPI mini-candles and arrow plots. This design choice ensures that visual output aligns precisely with the alert logic, which also operates exclusively on closed bars. As a result, both visuals and alerts reflect finalized data only.
BufOpen[0] = BufHigh[0] = BufLow[0] = BufClose[0] = EMPTY_VALUE;
BufColorIndex[0] = EMPTY_VALUE;
BufBuyArrow[0] = EMPTY_VALUE;
BufSellArrow[0] = EMPTY_VALUE;
Latest-Bar Info Panel (Optional)
When enabled, the indicator displays a compact on-chart information panel showing the CPI value of the most recently closed candle (bar 1), its corresponding zone label, and the current noise gate setting. This panel is intended primarily for testing and verification, allowing users to confirm CPI behavior without inspecting internal buffers. It does not affect plotting, alert logic, or performance.
if(InpShowLatestInfo)
{
   double cpi1 = 0.0;
   double range1 = high[1] - low[1];
   if(range1 > 0.0 && range1 >= minRange)
      cpi1 = CalcCPI(high[1], low[1], close[1]);

   Comment(StringFormat("CPI (closed bar): %.3f | %s | MinRange=%d pts",
                        cpi1, ZoneNameFromCPI(cpi1), InpMinRangePoints));
}
else
{
   Comment("");
}
Alerts: New-Bar Gate, Strong Transitions, Optional Exit, and Sign Flip
Alerts are evaluated once per newly closed bar using a stored timestamp (lastAlertBarTime) to prevent duplication. A strong-zone entry alert is triggered when the current strong state is non-zero and differs from the previously stored strong state. Optional exit alerts are triggered when the prior state was strong and the current state returns to non-strong.
datetime lastAlertBarTime = 0;
int      lastStrongState  = 0;

if(InpEnableAlerts)
{
   datetime barTime = time[1];
   if(barTime != lastAlertBarTime)
   {
      double cpi1 = 0.0, cpi2 = 0.0;

      double r1 = high[1] - low[1];
      double r2 = high[2] - low[2];

      if(r1 > 0.0 && r1 >= minRange) cpi1 = CalcCPI(high[1], low[1], close[1]);
      if(r2 > 0.0 && r2 >= minRange) cpi2 = CalcCPI(high[2], low[2], close[2]);

      int strongState = StrongStateFromCPI(cpi1);

      if(strongState != 0 && strongState != lastStrongState)
      {
         string side = (strongState > 0 ? "STRONG BUY" : "STRONG SELL");
         FireAlert(StringFormat("%s %s | CPI=%.3f | TF=%s | %s",
                                _Symbol, side, cpi1,
                                EnumToString((ENUM_TIMEFRAMES)_Period),
                                TimeToString(barTime, TIME_DATE|TIME_MINUTES)));
      }
      else if(InpAlertOnExit && lastStrongState != 0 && strongState == 0)
      {
         FireAlert(StringFormat("%s EXIT STRONG | CPI=%.3f | TF=%s | %s",
                                _Symbol, cpi1,
                                EnumToString((ENUM_TIMEFRAMES)_Period),
                                TimeToString(barTime, TIME_DATE|TIME_MINUTES)));
      }

      if(InpAlertOnSignFlip)
      {
         if(r1 >= minRange && r2 >= minRange)
         {
            if((cpi2 < 0.0 && cpi1 > 0.0) || (cpi2 > 0.0 && cpi1 < 0.0))
               FireAlert(StringFormat("%s CPI SIGN FLIP | prev=%.3f now=%.3f | TF=%s | %s",
                                      _Symbol, cpi2, cpi1,
                                      EnumToString((ENUM_TIMEFRAMES)_Period),
                                      TimeToString(barTime, TIME_DATE|TIME_MINUTES)));
         }
      }

      lastStrongState  = strongState;
      lastAlertBarTime = barTime;
   }
}
Optional sign-flip alerts are generated when the CPI value crosses zero, but only when both the current and previous candles pass the noise gate. This condition avoids spurious signals caused by low-range candles that may otherwise distort directional interpretation.
Performance Note (prev_calculated)
For simplicity and to avoid stale buffer artifacts, the current implementation recalculates all closed bars on every tick. Because the per-bar computation is lightweight, this approach is acceptable for most practical use cases and improves robustness during development and testing.
// current approach (simple, stable):
for(int i = rates_total - 1; i >= 1; --i) { /* ... */ }

// optimized approach (conceptual):
// if(prev_calculated == 0) start = rates_total - 1; else start = 2;
// for(int i = start; i >= 1; --i) { /* ... */ }
If performance optimization becomes necessary, the calculation loop can be refined using the prev_calculated parameter to process only the most recently closed bars. Any such optimization must still preserve the core rules: clearing buffer slots for recalculated bars, enforcing the noise gate, and excluding the forming candle.
Testing
To ensure robust and consistent behavior, all tests should be conducted across a diverse set of trading environments. Specifically, the indicator should be evaluated on at least two distinct symbol types—such as a major foreign exchange pair and a non-FX instrument (e.g., an index or commodity)—and across multiple timeframes (e.g., M5, M15, H1). Testing under varied market structures and time compressions is essential for validating that point-based sizing, the range-based noise gate, and CPI threshold logic perform reliably across instruments with different volatility profiles, price scales, and digit formats.
I tested the indicator on a live MetaTrader 5 chart to verify that the visual layer, information panel, and alert engine behave consistently on closed candles. The figure below shows the indicator attached to EURUSD, H1, using the default noise gate setting (MinRange = 5 pts).
The on-chart information panel confirms correct operation across three aspects in a single reading:
CPI (closed bar): 0.767 | STRONG BUY | MinRange = 5 pts
This output verifies that:
- CPI is computed on bar 1 (the most recently closed candle),
- Zone classification is functioning correctly, with a CPI of 0.767 mapped to the STRONG BUY zone, and
- The noise gate setting is active and correctly reported, indicating that calculations are gated based on candle range.
In the Journal tab, alerts are triggered according to the defined transition rules. In this test, the log records both a STRONG BUY alert and a CPI SIGN FLIP alert at the same bar-close timestamp. This is expected behavior when CPI simultaneously
- Enters the strong positive zone and
- Crosses from negative to positive between the previous and current closed bars.
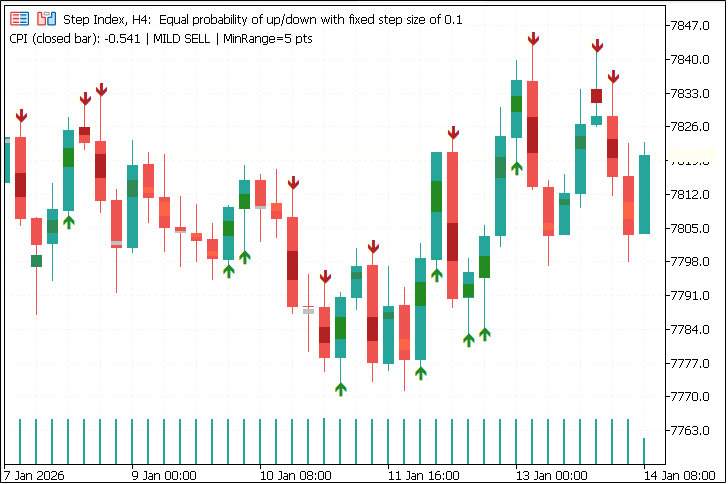
These results demonstrate that the indicator’s alert system is transition-based and evaluated once per newly closed candle, rather than reacting continuously on each tick. Visual output and alerts remain in full alignment, ensuring deterministic and non-repainting behavior. Below is an additional test on Step Index (H4) showing CPI Mini-Candles with alternating intra-bar pressure states. The latest closed bar reports a mild sell CPI in the on-chart info panel, while strong-zone arrows highlight periods of dominant pressure using unchanged thresholds and noise-gate settings.
Conclusion
The Candle Pressure Index (CPI) is a price-action analysis tool that visualizes intra-bar buying and selling pressure through a normalized closing-location model. By combining structured zone classification, color mapping, and transition-based alerts, it delivers a non-repainting representation of market pressure—revealing dynamics not visible through candle color alone.
The MetaTrader 5 implementation emphasizes deterministic behavior through strict closed-bar evaluation, explicit buffer management, and a clear separation between visualization and alert logic. The indicator can be configured to behave consistently across instruments and timeframes. These design choices make CPI a robust tool for both technical analysis and educational demonstration of intra-bar pressure concepts.
Warning: All rights to these materials are reserved by MetaQuotes Ltd. Copying or reprinting of these materials in whole or in part is prohibited.
This article was written by a user of the site and reflects their personal views. MetaQuotes Ltd is not responsible for the accuracy of the information presented, nor for any consequences resulting from the use of the solutions, strategies or recommendations described.

- Free trading apps
- Over 8,000 signals for copying
- Economic news for exploring financial markets
You agree to website policy and terms of use
Check out the new article: Price Action Analysis Toolkit (Part 55): Designing a CPI Mini-Candle Overlay for Intra-bar Pressure.
Author: Christian Benjamin
Do the arrows get plotted on open candle?