
Price Action Analysis Toolkit Development (Part 50): Developing the RVGI, CCI and SMA Confluence Engine in MQL5

Contents
Introduction
Identifying when the market has reached an overbought or oversold condition remains one of the most challenging tasks in trading. Even seasoned traders often find it difficult to pinpoint the exact moment a strong trend has peaked and a reversal is imminent. Hours can be spent analyzing charts and expecting the prevailing move to continue, only to discover too late that momentum has already shifted. For many, especially those still mastering price action, this uncertainty leads to confusion and emotional decision making which undermines disciplined execution. Over years of chart work, I have observed this pattern repeatedly. It is not a lack of skill. Markets simply do not move with perfect balance. They produce false signals, abrupt spikes, and misleading pullbacks that can trap even the most disciplined operator. This reality inspired the Price Action Analysis Toolkit series. The project aims to simplify market interpretation, reduce emotional interference, and impose greater order on chart reading.
From the outset the objective has been rigorous and practical. Decompose price behavior into measurable components that can be tested, automated, and applied consistently. Every challenge—identifying genuine reversals, confirming breakouts, filtering weak momentum—becomes an opportunity to craft systematic rules. Those rules must be reproducible in code and robust in live conditions. The common difficulties faced by traders are shared by the development process, and that shared experience drives continuous improvement. In today’s environment, automation delivers a clear advantage. MQL5 lets us translate careful observation into deterministic logic. Indicator handles, buffer reads, and closed-bar checks run without fatigue. A well-designed Expert Advisor performs objective analysis and enforces discipline, freeing the trader to focus on execution and risk management.
In this installment I introduce an analytical setup designed to bring clarity to uncertain markets. The strategy integrates three components: RVGI, CCI(14), and SMA(30), each contributing a different role. RVGI supplies a smoothed momentum signal. CCI detects overbought and oversold extremes. SMA provides structural context and trend bias. When these elements align, the system generates a single cohesive signal that confirms direction, validates reversals, and identifies early breakout potential.
The remainder of the article covers the decision flow and the MQL5 implementation. Expect a clear mapping from concept to code, including indicator handles, signal logic, visualization, and the Expert Advisor lifecycle, such as OnInit and OnTick. The goal is not another indicator. Our goal is a structured decision engine that reads price intelligently, reduces noise, and strengthens trading confidence. This toolkit distills years of observation into an adaptive system meant to simplify and improve price action analysis in real trading conditions.
Strategy Logic and Design Framework
Every analytical tool begins with a clear purpose. For this system, the primary objective is to identify moments of exhaustion and transition within a prevailing trend—those critical points where momentum starts to fade and a potential reversal begins to take shape. Achieving this requires a framework capable of capturing the subtle shifts in market energy, direction, and timing. To accomplish this, the strategy integrates three distinct yet interconnected components: momentum recognition (RVGI), market condition measurement (CCI), and trend filtering (SMA). When combined, these elements form a synchronized mechanism that reads and interprets the market’s rhythm, providing a comprehensive view of energy, overextension, and directional bias.
1. Momentum Recognition—The Role of RVGI
The Relative Vigor Index (RVGI) measures the persistent force behind price moves by comparing where bars close relative to their range, then smoothing that relationship over time. In a healthy uptrend closes cluster near the highs, and RVGI rises; in a downtrend closes cluster near the lows, and RVGI falls. In this strategy RVGI is the first layer of confirmation, the momentum heartbeat that tells us whether the market’s energy supports a turn. A clean RVGI main-line crossover of its signal line signals a shift in momentum direction, and we use closed-bar crossovers to avoid intra-bar noise. Divergence—for example, a falling RVGI while price makes new highs—warns that the current move is losing strength and prepares the setup for confirmation by CCI and SMA. Used this way, RVGI does not trigger trades alone; it validates that momentum is changing, so that any reversal called by CCI and bounded by the SMA carries higher conviction.
2. Market Condition Measurement—The Function of CCI
The Commodity Channel Index, set to 14 periods, measures how far price has moved from its statistical mean. It does this by comparing the typical price against its moving average, scaled by mean deviation. In practice, CCI highlights when price is stretched away from its normal range, making it a clear tool for spotting overbought and oversold conditions. At the extremes, CCI is a warning light. Readings above +100 generally indicate overbought tension, while readings below −100 point to oversold pressure. Those extreme readings alone do not guarantee an immediate reversal, but they mark zones where a reversal becomes more likely if momentum changes direction.
In timing and confirmation, CCI works best as a reality check rather than a standalone trigger. Use it to ask a simple question: has the market moved far enough to warrant a counter move? When combined with a momentum tool like RVGI, CCI adds context. A positive CCI near +100 while RVGI momentum is fading increases the probability of a top. A deep negative CCI with weakening downside momentum suggests a setup for a rebound. Operationally, the system treats CCI as the exhaustion gate. A valid bullish reversal requires CCI to have reached or exceeded −100 and then cross back above −100. A valid bearish reversal requires CCI to have reached or exceeded +100 and then cross back below +100. That “return from extreme” check prevents entries while price is still trapped at the extreme and raises the bar for signal quality.
In our strategy, CCI is never used in isolation. It must align with RVGI momentum and the SMA-defined context. Together they form a three-layer confirmation: SMA defines the structural bias, RVGI confirms the momentum shift, and CCI confirms that price has exhausted its extreme. This dual confirmation—momentum turning plus CCI returning from an extreme—significantly reduces false signals and improves the reliability of every plotted reversal.
bool CheckReversalSignal(int shift, bool &isBuy)
{
   // defensive
   if(iBars(_Symbol,_Period) <= shift + InpCCI_Period + InpRVI_Smooth + 4) return(false);

   // CCI read
   double cciNow = cci_at(shift, InpCCI_Period);
   double cciPrev = cci_at(shift + 1, InpCCI_Period);

   // RVI read
   double rviMainNow = rvi_main_at(shift);
   double rviMainPrev = rvi_main_at(shift + 1);
   double rviSigNow = rvi_signal_at(shift);
   double rviSigPrev = rvi_signal_at(shift + 1);

   // SMA & price
   double smaVal = /* read or compute SMA */;
   double price = EA_Close(shift);
   bool priceAboveSMA = (price > smaVal);
   bool priceBelowSMA = (price < smaVal);

   // flags
   bool cciBuy = (cciPrev <= CCI_LOWER) && (cciNow > CCI_LOWER);
   bool cciSell = (cciPrev >= CCI_UPPER) && (cciNow < CCI_UPPER);
   bool rviUp = (rviMainPrev <= rviSigPrev) && (rviMainNow > rviSigNow);
   bool rviDown = (rviMainPrev >= rviSigPrev) && (rviMainNow < rviSigNow);

   // final combination (mean-reversion style)
   if(priceBelowSMA && cciBuy && rviUp)  { isBuy = true; return(true); }
   if(priceAboveSMA && cciSell && rviDown){ isBuy = false; return(true); }
   return(false);
}
3. Trend Filtering —The Guidance of SMA(30)
The Simple Moving Average with a 30-period setting serves as the structural backbone of this analytical framework. It smooths out market noise and reveals the underlying directional flow of price action. On a broader scale, the SMA acts as a dynamic equilibrium line—when price consistently stays above it, the market is considered to be in a bullish environment, while sustained trading below it reflects a bearish condition. This makes the SMA a simple yet powerful reference point for trend context.
Beyond trend definition, the SMA(30) also plays a key role in timing and confirmation. During trending conditions, it highlights potential exhaustion zones when price moves too far from its mean, signaling that momentum may be overstretched. When price retraces back toward the SMA, it often marks the start of a correction or potential reversal. This natural ebb and flow around the SMA becomes the structure upon which RVGI and CCI can perform more profound analysis.
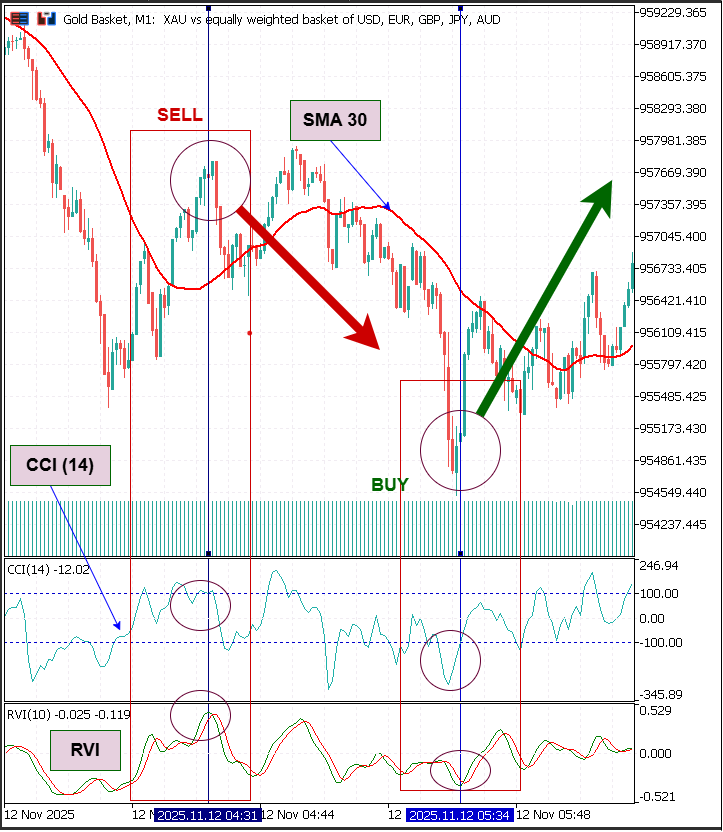
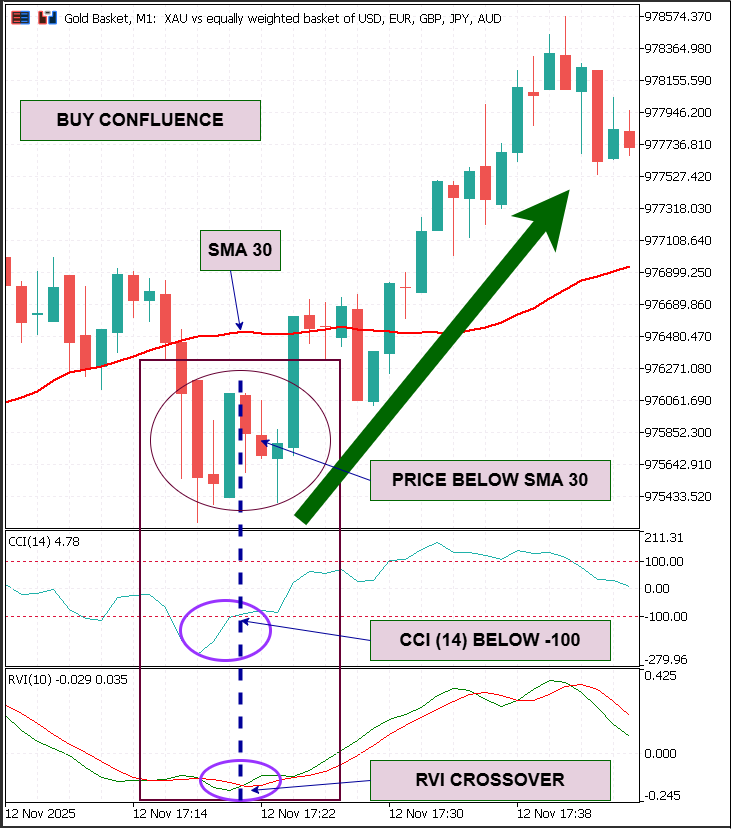
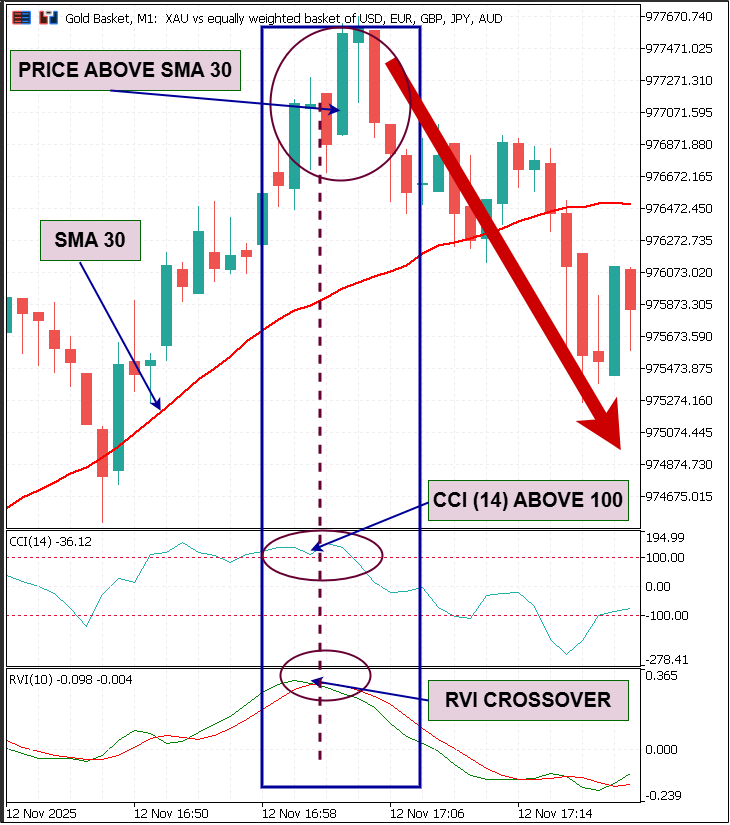
From a strategic perspective, the SMA allows us to categorize market behavior into two actionable states—expansion and reversion. In expansion phases, when the price is well aligned with the SMA and moving with momentum, we avoid counter-trend trades and wait for confirmation of exhaustion. In reversion phases, when price extends too far above or below the SMA and momentum begins to fade, we prepare for reversal signals. In our current setup, the SMA(30) defines these key boundaries. When price is above the SMA, we monitor for a potential bearish reversal, confirmed when CCI crosses above +100 and RVGI shows a momentum crossover to the downside. Conversely, when price is below the SMA, we anticipate a bullish reversal, confirmed when CCI drops to -100 or lower and RVGI crosses upward.
This alignment creates a three-layered confirmation model:
- SMA(30) defines the structural context and price bias.
- CCI(14) identifies overextended market extremes.
- RVGI validates momentum shifts through crossovers.
Together, these components ensure that every signal emerges from a balanced combination of structure, momentum, and exhaustion. The SMA doesn’t just act as a moving average line—it becomes the axis around which the entire system rotates, helping to synchronize timing, direction, and conviction. By combining it with RVGI and CCI, we turn what is usually a static trend filter into a dynamic decision framework that adapts to market rhythm and improves the accuracy of reversal detection.
Unified Signal Formation
The true strength of this system lies in the synchronization of these three components. A signal is deemed valid only when all three layers—momentum (RVGI), market condition (CCI), and trend (SMA)—align cohesively.
- Bullish setup: occurs when RVGI crosses upward, CCI rises from oversold levels, and the price is below the SMA(30).
- Bearish setup: occurs when RVGI crosses downward, CCI drops from overbought levels, and the price is above the SMA(30).
This triple-confirmation logic filters out most false signals, focusing only on points where genuine market energy converges. It emphasizes quality over quantity, aiming for consistent, high-probability trades rather than frequent, unreliable entries. This structured approach provides traders with a disciplined method to interpret market dynamics accurately, reducing emotional reactions and promoting systematic decision-making.
MQL5 Implementation
Setting Up the Basic Framework
First, we begin by establishing the foundation of our Expert Advisor. We include a header comment section where we specify our copyright, version number, and links to relevant resources. This helps us keep our code organized and professional. Then, we use #property directives such as #property copyright, #property link, and #property version to define metadata that MetaTrader uses to identify our script properly. Setting up this structure ensures that our code is well-documented and easily maintainable, especially when sharing or revisiting it later.
//+------------------------------------------------------------------+
//|                                       RVGI_CCI_SMA_Panel_EA.mq5  |
//|                             Copyright 2025, Christian Benjamin.  |
//|                                            https://www.mql5.com  |
//+------------------------------------------------------------------+
#property copyright "Copyright 2025, MetaQuotes Ltd."
#property link      "https://www.mql5.com"
#property version   "1.00"
Defining User Inputs
Next, we add user input parameters to make our system flexible and adaptable. These inputs are crucial because they allow us to tweak the system without rewriting code. For example, we define InpSMA_Period to set how many bars the Simple Moving Average will consider—this influences trend detection. Similarly, InpCCI_Period controls the lookback window for the Commodity Channel Index, which detects overbought and oversold conditions. InpRVI_Smooth determines how many bars we average for the RVGI, smoothing out market noise to better reflect momentum.
We also include parameters for ATR, like InpATR_Period, which defines how many bars the ATR calculation considers, and InpATR_Multiplier, which scales ATR for setting stop-loss and take-profit levels. Additionally, toggles like InpUseATRStop allow us to choose whether to base stops on ATR or swing lows/highs. These inputs give us control over the system’s sensitivity and risk management, enabling us to optimize it for different instruments and timeframes.
// User inputs
input int     InpSMA_Period        = 30;      // SMA period
input int     InpCCI_Period        = 14;      // CCI period
input int     InpRVI_Smooth        = 4;       // RVI smoothing
input int     InpATR_Period        = 14;      // ATR period
input double  InpATR_Multiplier    = 1.5;     // ATR multiplier for stops
input bool    InpUseATRStop        = true;    // Use ATR for stops
input int     InpSL_SwingBars      = 10;      // Swing lookback
input double  InpTarget1_ATR       = 1.0;     // Target 1 ATR multiple
input double  InpTarget2_ATR       = 2.0;     // Target 2 ATR multiple
input int     InpSignalLookback    = 1;       // Bars to look back
input int     InpCheckIntervalMs   = 500;     // Check interval in ms
Initializing Indicator Handles and Variables
Once our inputs are set, we declare internal variables to hold the indicator handles—hSMA for the moving average and hATR for the volatility measure. We initialize these with INVALID_HANDLE to indicate they are not yet created. During the OnInit() function, we create the actual indicator handles using functions like iMA() for the SMA and iATR() for ATR.
// Declare handles
int hSMA = INVALID_HANDLE;
int hATR = INVALID_HANDLE;

// Inside OnInit()
hSMA = iMA(_Symbol, _Period, InpSMA_Period, 0, MODE_SMA, PRICE_CLOSE);
hATR = iATR(_Symbol, _Period, InpATR_Period);
This setup allows us to efficiently access indicator buffers during each tick, rather than recalculating indicators manually each time, which improves performance. We also initialize variables such as lastSignalledShift (to track the last bar where we generated a signal), lastCheckMs (to manage how often we evaluate market conditions), lastSignalText, and lastSignalTime. These variables help us prevent duplicate signals and control the frequency of checks, ensuring our system remains responsive without overloading the CPU.
// Internal variables
int lastSignalledShift = -1;
uint lastCheckMs = 0;
string lastSignalText = "none";
datetime lastSignalTime = 0;
Creating Helper Functions for Clarity
To keep our code clean, manageable, and reusable, we develop helper functions. For example, make_object_name() constructs unique names for chart objects by concatenating a prefix with a timestamp, which is essential when creating multiple graphical objects, so they don’t overwrite each other. Similarly, format_time_dt() converts datetime values into human-readable strings, making labels and comments more understandable. We also create wrapper functions like EA_Close(), EA_Open(), EA_High(), EA_Low(), and EA_Time() that internally call the standard iClose(), iOpen(), etc., but with simplified parameters. These wrappers make accessing the price data more straightforward and consistent throughout the code, reducing errors and improving readability.
// Generate unique object names
string make_object_name(const string prefix, datetime t)
{
    return prefix + IntegerToString((int)t);
}

// Format time for display
string format_time_dt(const datetime t)
{
    return(TimeToString(t, TIME_DATE | TIME_SECONDS));
}

// Wrappers for data retrieval
double EA_Close(int shift) { return(iClose(_Symbol, _Period, shift)); }
double EA_Open(int shift)  { return(iOpen(_Symbol, _Period, shift)); }
double EA_High(int shift)  { return(iHigh(_Symbol, _Period, shift)); }
double EA_Low(int shift)   { return(iLow(_Symbol, _Period, shift)); }
datetime EA_Time(int shift) { return(iTime(_Symbol, _Period, shift)); }
Calculating the RVGI Indicator
Now, let's focus on implementing the core momentum indicator—RVGI. We start with rvi_raw_at_shift(), which calculates a weighted sum of close and open prices over four bars. This function emphasizes recent market activity by giving more weight to the middle bars, which helps capture the current momentum. To normalize the raw value, it divides by the high-low range for each bar, ensuring the indicator is scale-invariant. Importantly, we add a check to prevent division by zero by returning zero if the denominator is too small, which maintains stability.
// Raw RVGI calculation
double rvi_raw_at_shift(int shift)
{
    if(iBars(_Symbol, _Period) <= shift + 3)
        return 0.0;

    double num0 = EA_Close(shift) - EA_Open(shift);
    double num1 = EA_Close(shift + 1) - EA_Open(shift + 1);
    double num2 = EA_Close(shift + 2) - EA_Open(shift + 2);
    double num3 = EA_Close(shift + 3) - EA_Open(shift + 3);
    double num = num0 + 2.0 * num1 + 2.0 * num2 + num3;

    double den0 = EA_High(shift) - EA_Low(shift);
    double den1 = EA_High(shift + 1) - EA_Low(shift + 1);
    double den2 = EA_High(shift + 2) - EA_Low(shift + 2);
    double den3 = EA_High(shift + 3) - EA_Low(shift + 3);
    double den = den0 + 2.0 * den1 + 2.0 * den2 + den3;

    if(MathAbs(den) < DBL_EPSILON)
        return 0.0;

    return num / den;
}
Next, we create rvi_main_at(), which smooths the raw RVGI over the specified number of bars—often four—to reduce market noise and produce a more reliable momentum line.
// Smoothed RVGI (main line)
double rvi_main_at(int shift)
{
    int n = MathMax(1, InpRVI_Smooth);
    double sum = 0.0;
    for(int i=0; i<n; i++)
    {
        sum += rvi_raw_at_shift(shift + i);
    }
    return sum / n;
}
This is done by averaging the raw values over the smoothing window. After that, rvi_signal_at() takes this process further, smoothing the main RVGI line again to generate a signal line, which is essential for detecting crossovers indicating shifts in market momentum. These combined functions give us a robust and responsive momentum indicator that helps identify potential reversals early.
// Signal line (smoothed RVGI)
double rvi_signal_at(int shift)
{
    int n = MathMax(1, InpRVI_Smooth);
    double sum = 0.0;
    for(int i=0; i<n; i++)
    {
        sum += rvi_main_at(shift + i);
    }
    return sum / n;
}
Implementing the CCI Calculation
We then implement the cci_at() function to manually compute the Commodity Channel Index. We start by calculating the typical price for each bar within the lookback window: (high + low + close) divided by 3. We sum these typical prices over the period to find their average, then calculate the mean deviation—how far each typical price deviates from this mean. The current typical price’s deviation from the mean, scaled appropriately, gives us the CCI value. This manual calculation ensures our indicator is precise and consistent, and it allows us to tune parameters easily. The CCI helps us detect when the market is overextended in either direction, which is crucial for timing entries and exits.
double cci_at(int shift, int period)
{
    int totalBars = iBars(_Symbol, _Period);
    if(totalBars <= shift + period - 1)
        return 0.0; // Not enough bars

    double sumTP = 0.0;
    for(int k=0; k<period; k++)
    {
        int idx = shift + k;
        double tp = (EA_High(idx) + EA_Low(idx) + EA_Close(idx)) / 3.0;
        sumTP += tp;
    }
    double smaTP = sumTP / period;

    double meanDev = 0.0;
    for(int k=0; k<period; k++)
    {
        int idx = shift + k;
        double tp = (EA_High(idx) + EA_Low(idx) + EA_Close(idx)) / 3.0;
        meanDev += MathAbs(tp - smaTP);
    }
    meanDev /= period;

    if(meanDev < DBL_EPSILON)
        return 0.0;

    double tp_current = (EA_High(shift) + EA_Low(shift) + EA_Close(shift)) / 3.0;
    double cci = (tp_current - smaTP) / (0.015 * meanDev);
    return cci;
}
Accessing ATR Data
Next, we implement get_atr_current(), which retrieves the latest ATR value using the indicator handle hATR. We use CopyBuffer() to get the most recent ATR reading; if the handle is invalid or data isn't available, we return zero. This value is critical because it allows us to set adaptive stop-loss and take-profit levels that reflect current market volatility. Using ATR ensures our levels are neither too tight nor too loose, maintaining a good risk-reward balance.
double get_atr_current()
{
    if(hATR == INVALID_HANDLE)
        return 0.0;

    double tmp[];
    if(CopyBuffer(hATR, 0, 0, 1, tmp) <= 0)
        return 0.0;

    return tmp[0];
}
Building Trade Levels
With all indicator data in place, we define a Levels structure to hold our entry price, stop-loss, and two take-profit targets, along with additional info such as the trade direction and timestamp. The build_levels() function calculates these levels dynamically. It starts by setting the entry at the current close price. If ATR-based stops are enabled, it calculates stop-loss and TP levels by multiplying ATR by user-defined factors. If ATR is unavailable or disabled, it searches for swing lows or highs within a lookback window to set the stop levels, adding buffers for safety. This approach ensures our levels adapt to the current market environment, balancing risk and potential reward.
struct Levels
{
    double entry;
    double stop;
    double tp1;
    double tp2;
    datetime time;
    bool isBuy;
};

Levels build_levels(bool isBuy, int shift)
{
    Levels L;
    L.entry = EA_Close(shift);
    L.time = EA_Time(shift);
    L.isBuy = isBuy;

    double atr = get_atr_current();
    if(atr <= 0.0)
        atr = SymbolInfoDouble(_Symbol, SYMBOL_POINT) * 10;

    if(InpUseATRStop)
    {
        L.stop = isBuy ? L.entry - atr * InpATR_Multiplier : L.entry + atr * InpATR_Multiplier;
    }
    else
    {
        // Swing low/high search
        double extremePrice = isBuy ? EA_Low(shift) : EA_High(shift);
        for(int i=1; i<=InpSL_SwingBars; i++)
        {
            double v = isBuy ? EA_Low(shift + i) : EA_High(shift + i);
            if(v == WRONG_VALUE)
                continue;
            if(isBuy && v < extremePrice)
                extremePrice = v;
            if(!isBuy && v > extremePrice)
                extremePrice = v;
        }
        // Add buffer
        double buffer = SymbolInfoDouble(_Symbol, SYMBOL_POINT) * 5;
        L.stop = isBuy ? extremePrice - buffer : extremePrice + buffer;
    }

    // Targets
    L.tp1 = isBuy ? L.entry + atr * InpTarget1_ATR : L.entry - atr * InpTarget1_ATR;
    L.tp2 = isBuy ? L.entry + atr * InpTarget2_ATR : L.entry - atr * InpTarget2_ATR;

    return L;
}
Visualizing Signals and Levels
To clearly communicate our signals, we implement draw_signal_objects(). This function creates graphical elements on the chart: arrows indicating the entry point, horizontal lines for stop-loss and TP levels, and labels showing precise prices. Each object gets a unique name by combining a prefix with the timestamp, preventing conflicts when multiple signals are generated. We customize colors, line widths, and arrow shapes for clarity. After creating these objects, we call ChartRedraw() to immediately update the chart. This visual feedback helps us verify signals and levels at a glance, making manual management easier.
void draw_signal_objects(const Levels &L)
{
    string baseName = make_object_name("RVGI_SIG_", L.time);

    // Draw arrow
    string arrowName = baseName + (L.isBuy ? "_BUY_ARR" : "_SELL_ARR");
    if(ObjectFind(0, arrowName) >= 0)
        ObjectDelete(0, arrowName);
    ObjectCreate(0, arrowName, OBJ_ARROW, 0, L.time, L.entry);
    ObjectSetInteger(0, arrowName, OBJPROP_ARROWCODE, L.isBuy ? 233 : 234);
    ObjectSetInteger(0, arrowName, OBJPROP_COLOR, L.isBuy ? InpArrowUpColor : InpArrowDownColor);
    ObjectSetInteger(0, arrowName, OBJPROP_WIDTH, 2);
    ObjectSetInteger(0, arrowName, OBJPROP_BACK, true);

    // Stop line
    string slName = baseName + "_SL";
    if(ObjectFind(0, slName) >= 0)
        ObjectDelete(0, slName);
    ObjectCreate(0, slName, OBJ_HLINE, 0, 0, L.stop);
    ObjectSetDouble(0, slName, OBJPROP_PRICE, L.stop);
    ObjectSetInteger(0, slName, OBJPROP_COLOR, InpSL_Color);
    ObjectSetString(0, slName, OBJPROP_TEXT, "SL: " + DoubleToString(L.stop, _Digits));

    // TP1 line
    string tp1Name = baseName + "_TP1";
    if(ObjectFind(0, tp1Name) >= 0)
        ObjectDelete(0, tp1Name);
    ObjectCreate(0, tp1Name, OBJ_HLINE, 0, 0, L.tp1);
    ObjectSetDouble(0, tp1Name, OBJPROP_PRICE, L.tp1);
    ObjectSetInteger(0, tp1Name, OBJPROP_COLOR, InpTP_Color);
    ObjectSetString(0, tp1Name, OBJPROP_TEXT, "TP1: " + DoubleToString(L.tp1, _Digits));

    // TP2 line
    string tp2Name = baseName + "_TP2";
    if(ObjectFind(0, tp2Name) >= 0)
        ObjectDelete(0, tp2Name);
    ObjectCreate(0, tp2Name, OBJ_HLINE, 0, 0, L.tp2);
    ObjectSetDouble(0, tp2Name, OBJPROP_PRICE, L.tp2);
    ObjectSetInteger(0, tp2Name, OBJPROP_COLOR, InpTP_Color);
    ObjectSetString(0, tp2Name, OBJPROP_TEXT, "TP2: " + DoubleToString(L.tp2, _Digits));

    ChartRedraw();
}
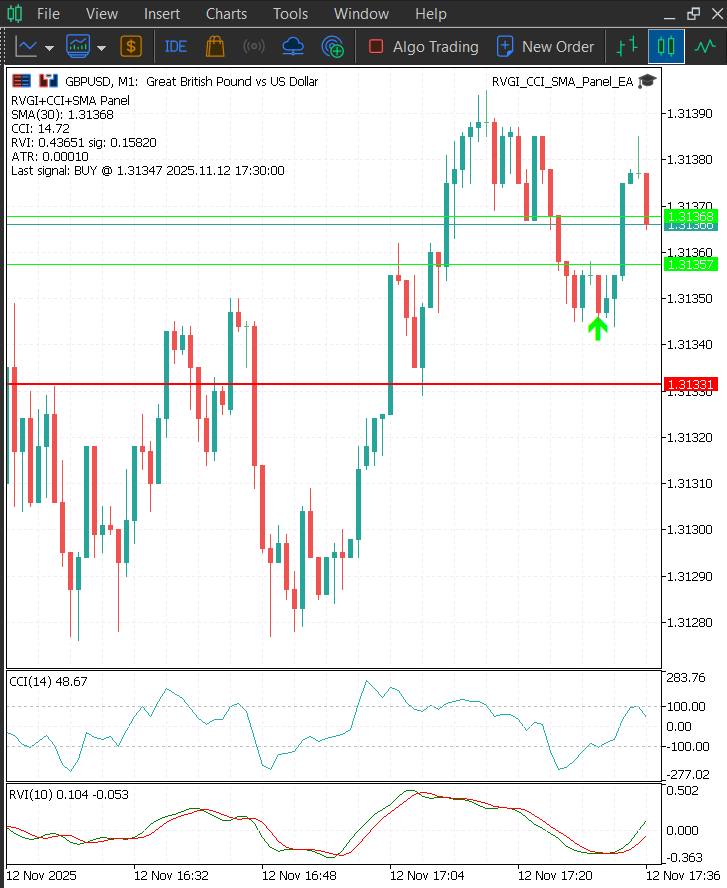
Creating a Real-Time Data Panel
We also add draw_panel() to provide a quick overview directly on the chart. It fetches current indicator values—like SMA, RVGI, CCI, and ATR—either from buffers or by manual calculation if indicator handles are invalid. We format this data into a clear, readable string and display it with Comment(). This panel gives us instant insight into market conditions and the system’s status, helping us make informed decisions and monitor ongoing performance without switching to different screens.
void draw_panel()
{
    string txt = "RVGI + CCI + SMA Panel\n";

    // SMA
    double smaValue = 0;
    if(hSMA != INVALID_HANDLE)
    {
        double tmp[];
        if(CopyBuffer(hSMA, 0, 0, 1, tmp) > 0)
            smaValue = tmp[0];
        else
            smaValue = 0; // fallback
    }
    else
    {
        // manual calculation fallback
        double sum=0;
        int cnt=0;
        for(int i=0; i<InpSMA_Period; i++)
        {
            if(iBars(_Symbol, _Period) <= i)
                break;
            sum += EA_Close(i);
            cnt++;
        }
        if(cnt>0)
            smaValue = sum / cnt;
    }
    txt += "SMA(" + IntegerToString(InpSMA_Period) + "): " + DoubleToString(smaValue, _Digits) + "\n";

    // RVGI & CCI
    double rviM = rvi_main_at(1);
    double rviS = rvi_signal_at(1);
    double cciV = cci_at(1, InpCCI_Period);
    txt += "RVI: " + DoubleToString(rviM,5) + " sig: " + DoubleToString(rviS,5) + "\n";
    txt += "CCI: " + DoubleToString(cciV,2) + "\n";

    // ATR
    double atr = get_atr_current();
    txt += "ATR: " + DoubleToString(atr, _Digits) + "\n";

    // Last signal info
    txt += "Last signal: " + lastSignalText;
    if(lastSignalTime != 0)
        txt += " " + TimeToString(lastSignalTime, TIME_DATE | TIME_SECONDS);

    Comment(txt);
}
Evaluating Market Conditions and Generating Signals
The core decision engine is in check_for_signals(). We implement throttling using GetTickCount() to avoid excessive CPU load by controlling how often evaluations occur. We determine the shift based on our lookback setting and verify that enough bars are loaded for analysis. We then retrieve indicator data from buffers or recalculate if handles are invalid, ensuring our calculations are always current.
void check_for_signals()
{
    uint now = (uint)GetTickCount();
    if(lastCheckMs != 0 && (now - lastCheckMs) < (uint)InpCheckIntervalMs)
        return; // Throttle

    lastCheckMs = now;
    int shift = InpSignalLookback;

    // Verify enough bars loaded
    if(iBars(_Symbol, _Period) <= shift + 6)
        return;

    // Retrieve SMA
    double smaVal = 0;
    if(hSMA != INVALID_HANDLE)
    {
        double tmp[];
        if(CopyBuffer(hSMA, 0, shift, 1, tmp) > 0)
            smaVal = tmp[0];
    }
    else
    {
        // fallback manual SMA
        double sum=0;
        int cnt=0;
        for(int i=shift; i<shift + InpSMA_Period; i++)
        {
            if(iBars(_Symbol, _Period) <= i)
                break;
            sum += EA_Close(i);
            cnt++;
        }
        if(cnt > 0)
            smaVal = sum / cnt;
        else
            return; // Not enough data
    }

    // Get indicator values
    double rviMainNow = rvi_main_at(shift);
    double rviMainPrev = rvi_main_at(shift + 1);
    double rviSigNow = rvi_signal_at(shift);
    double rviSigPrev = rvi_signal_at(shift + 1);
    double cciNow = cci_at(shift, InpCCI_Period);
    double cciPrev = cci_at(shift + 1, InpCCI_Period);
    double price = EA_Close(shift);

    // Trend and momentum analysis
    bool priceAboveSMA = (price > smaVal);
    bool priceBelowSMA = (price < smaVal);
    bool rviCrossUp = (rviMainPrev <= rviSigPrev) && (rviMainNow > rviSigNow);
    bool rviCrossDown = (rviMainPrev >= rviSigPrev) && (rviMainNow < rviSigNow);
    bool cciOverbought = (cciNow >= 100);
    bool cciOversold = (cciNow <= -100);

    // Generate signals based on conditions
    if(priceAboveSMA && cciOversold && rviCrossUp)
    {
        // Buy signal
        if(shift != lastSignalledShift)
        {
            Levels L = build_levels(true, shift);
            draw_signal_objects(L);
            lastSignalledShift = shift;
            lastSignalText = "BUY @ " + DoubleToString(price, _Digits);
            lastSignalTime = EA_Time(shift);
            // Send alerts if enabled...
        }
    }
    else if(priceBelowSMA && cciOverbought && rviCrossDown)
    {
        // Sell signal
        if(shift != lastSignalledShift)
        {
            Levels L = build_levels(false, shift);
            draw_signal_objects(L);
            lastSignalledShift = shift;
            lastSignalText = "SELL @ " + DoubleToString(price, _Digits);
            lastSignalTime = EA_Time(shift);
            // Send alerts if enabled...
        }
    }

    // Update panel info
    draw_panel();
}
Next, we analyze the indicator signals: we check if RVGI has crossed above or below its signal line—indicating momentum shifts—and evaluate if CCI is in overbought or oversold zones. We also compare the current price against the SMA to determine the trend. When all these conditions align—such as RVGI crossing up, CCI in oversold, and price below SMA—we generate a buy signal. The reverse conditions trigger a sell signal. We ensure we don't produce duplicate signals by tracking the last signaled shift. When a new signal is confirmed, we generate trade levels, visualize them on the chart, and update internal variables. We also send alerts or notifications if enabled, keeping us informed.
Managing the EA Lifecycle and Resource Cleanup
Finally, in OnInit(), we create the indicator handles for SMA and ATR, checking for errors and initializing variables. We also draw the information panel for quick status updates.
// In OnInit()
int OnInit()
{
    hSMA = iMA(_Symbol, _Period, InpSMA_Period, 0, MODE_SMA, PRICE_CLOSE);
    hATR = iATR(_Symbol, _Period, InpATR_Period);
    // Initialize variables
    lastSignalledShift = -1;
    lastCheckMs = 0;
    lastSignalText = "none";
    lastSignalTime = 0;

    draw_panel();
    Print("EA initialized");
    return(INIT_SUCCEEDED);
}
During OnDeinit(), we release the indicator handles with IndicatorRelease() to free resources properly. In OnTick(), we simply call check_for_signals() to keep our system running continuously. This structure ensures our expert remains efficient, responsive, and well-managed throughout its operation.
// In OnDeinit()
void OnDeinit(const int reason)
{
    if(hSMA != INVALID_HANDLE)
        IndicatorRelease(hSMA);
    if(hATR != INVALID_HANDLE)
        IndicatorRelease(hATR);
}

// In OnTick()
void OnTick()
{
    check_for_signals();
}
Testing and Outcomes
After implementing the system, we conducted thorough testing to evaluate its effectiveness in real-market conditions. The results clearly demonstrate that the integrated indicators and levels produce reliable entry signals, which are visually confirmed on the chart, ensuring transparency and ease of validation.
Visual Confirmation and Signal Accuracy
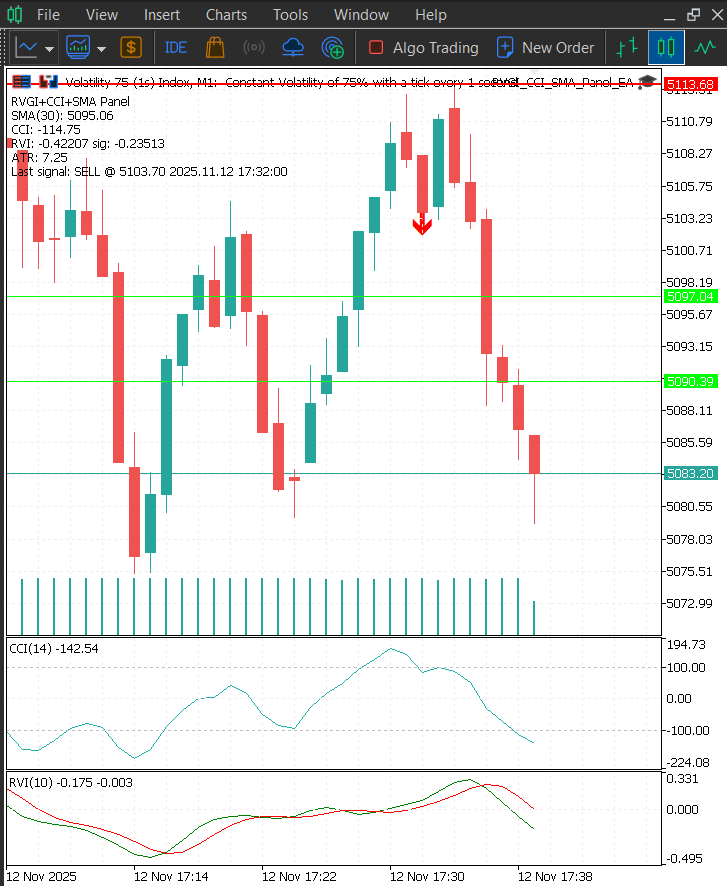
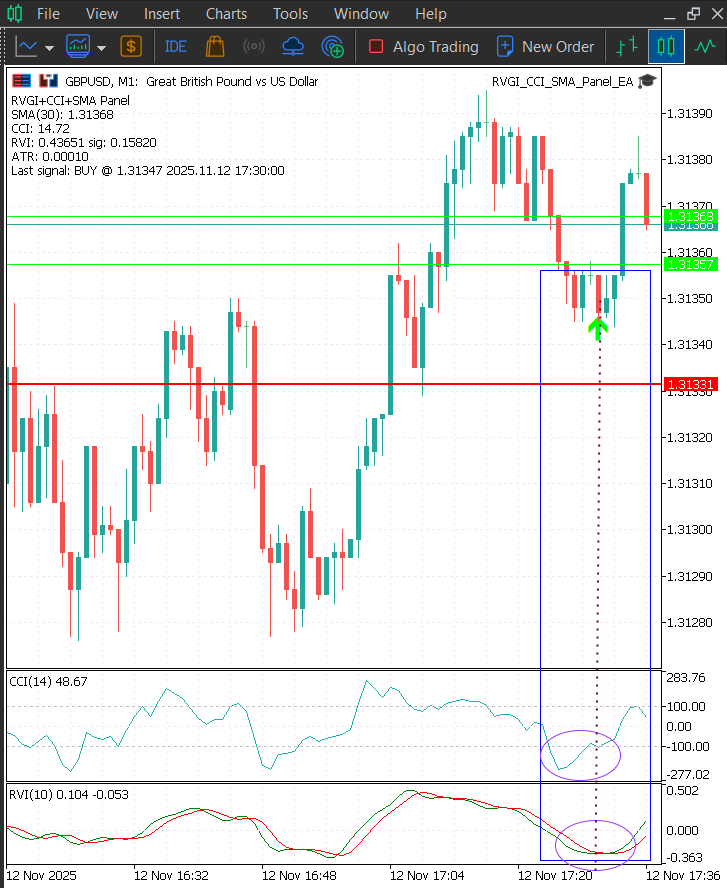
The first outcome observed was the accurate visual signaling on the chart. The system generated buy and sell arrows precisely at moments when RVGI, CCI, and SMA conditions aligned according to our logic. For example, a green upward arrow appeared when RVGI was crossing up, CCI entered oversold territory, and the price was below SMA, indicating a strong buy signal. These signals were accompanied by clearly marked levels for entry, stop-loss, and take-profit, providing instant visual confirmation of the system’s analysis.
Buy Signal: GBPUSD M1
Sell Signal: Volatility 75 (1s) Index M1
Indicator Data Validation
The second key result was the alignment of indicator readings at the time of signals. The detailed data revealed that RVGI was moving upward, confirming increasing momentum. The CCI was in oversold territory (below -100), indicating the market was overextended downward, ready for a reversal. Simultaneously, the price was below the SMA, aligning with a bullish setup. This multi-layer confirmation gave us confidence that the signals were based on solid technical reasoning, reducing false positives.
Trade Execution and Profitability
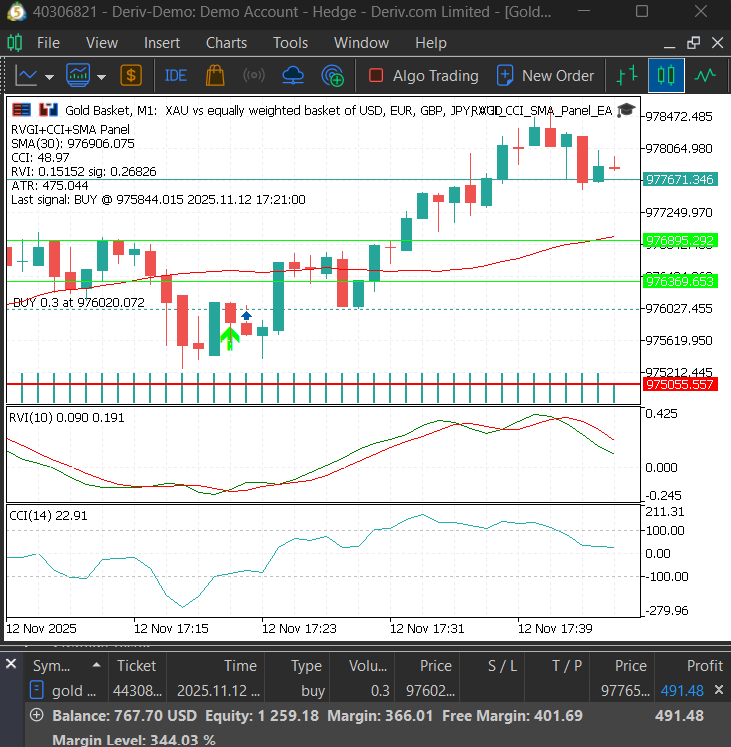
The third and most critical outcome was the successful execution of trades at the designated levels. Orders were triggered accurately at the visual entry points, with stop-loss and take-profit levels precisely set based on ATR or swing lows/highs, as configured. The trades performed as expected, with the system capturing profits efficiently when the market moved favorably. The example shown in the outcomes confirmed the system's capability to identify high-probability entries and manage trades effectively, resulting in profitable trades over the testing period.
Overall Effectiveness
- The combined indicator signals (RVGI, CCI, SMA) provided consistent and reliable entries, validated by visual cues.
- The levels generated for stops and targets were well-placed, allowing for optimal risk-reward management.
- The system’s visual and data outputs allowed for easy manual validation and adjustment, ensuring transparency.
Based on these outcomes, we recommend further fine-tuning of parameters such as indicator periods, ATR multipliers, and signal conditions to optimize performance for specific markets or timeframes. Continuous testing and validation will help enhance accuracy, reduce false signals, and improve overall profitability.
Conclusion
This system brings clarity to one of the hardest problems in trading: reliably identifying reversals. By requiring three independent confirmations—trend, momentum and exhaustion—the engine isolates moments when price structure, directional energy and market fatigue converge. The result is fewer signals, each with clear technical justification and measurable merit on the chart. Treat the Expert Advisor as an analysis engine, not as a plug-and-play solution. Use it to visualize setups, to record signals and to test ideas systematically. Run reproducible backtests with closed-bar logic, log every signal against the underlying structure, and review out-of-sample performance before changing parameters. That discipline prevents curve-fitting and preserves the integrity of your results.
Manage risk deliberately. Use the EA’s suggested stops — swing-based or ATR-scaled — as baseline rules. Size positions to protect capital and prefer partial exits or trailing stops that match your time horizon and risk tolerance. If you later build an execution module, keep the original signal rules intact and design order logic that respects the same confirmations and risk guardrails.
Finally, treat this toolkit as a bridge from observation to action. It converts price behavior into repeatable rules, reduces emotional noise and provides a clear framework for disciplined decision-making. Use it to sharpen your judgement, document what works, and evolve the system from a research engine into a dependable part of your trading workflow.
Please note: The full source code file is attached at the end of this article. Kindly click it to download, then open and compile it in MetaEditor. Test it thoroughly and adjust the parameters according to your preferences and trading conditions.
Warning: All rights to these materials are reserved by MetaQuotes Ltd. Copying or reprinting of these materials in whole or in part is prohibited.
This article was written by a user of the site and reflects their personal views. MetaQuotes Ltd is not responsible for the accuracy of the information presented, nor for any consequences resulting from the use of the solutions, strategies or recommendations described.

- Free trading apps
- Over 8,000 signals for copying
- Economic news for exploring financial markets
You agree to website policy and terms of use