Chart Synchronization for Easier Technical Analysis
One of the common challenges traders face during technical analysis is the inconsistency of chart annotations across different timeframes. While most trading platforms allow graphical objects like trendlines or zones to appear across timeframes as the trader navigates between them, analyzing multiple timeframes side by side can still be inefficient. Traders often open several chart windows for the same symbol each set to a different timeframe to get a broader technical perspective. However, without synchronization, each chart functions independently. This means changes like scrolling, zooming, or switching symbols must be repeated on each individual chart, leading to fragmented analysis, increased workload, and a higher chance of overlooking key confluences.
Chart synchronization addresses this by linking multiple chart windows of the same symbol across different timeframes. Actions such as panning, zooming, or symbol changes are mirrored across all synced charts, allowing traders to seamlessly view and compare the same price action context in multiple timeframes. This unified interaction streamlines the analytical workflow, reduces manual effort, and ensures more consistent and accurate multi-timeframe analysis ultimately enabling faster and more informed trading decisions.
Planning and Logic for Chart Synchronization Indicator
Core Objective
Create a multi-timeframe chart synchronization system where objects drawn on higher timeframes automatically appear on lower timeframes with proper hierarchy and styling.
1. Key Functionality Requirement:
- Base timeframe selection: User selects their preferred base timeframe via input parameter, all other charts synchronize to this symbol but different timeframes.
- Timeframe Hierarchy:
PERIOD_H1 (Highest)
   ↓
PERIOD_M30
   ↓
PERIOD_M15
   ↓
PERIOD_M5 (Lowest)
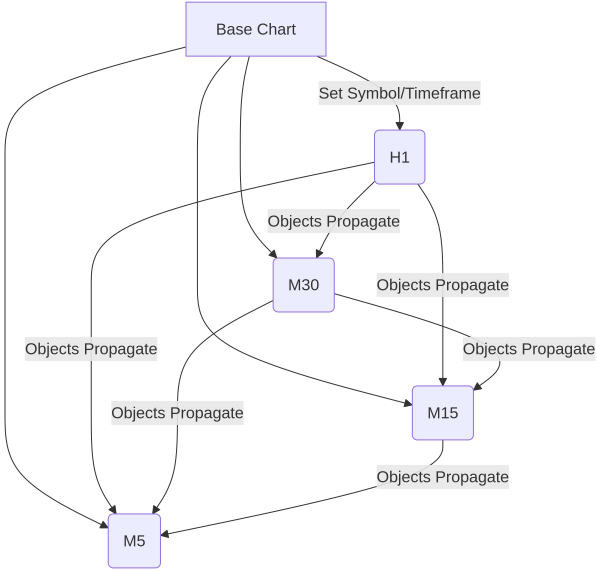
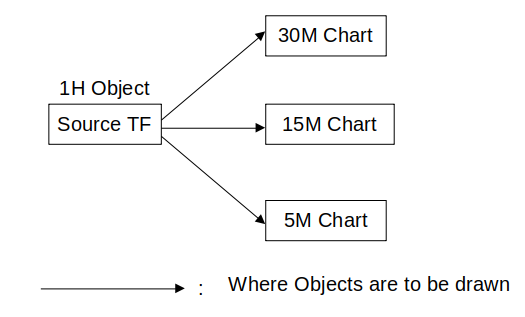
- Object propagation rules: Objects created on any timeframe appear on all lower timeframes (automatic downward propagation), example H1 object visible on M30, M15, and M5.
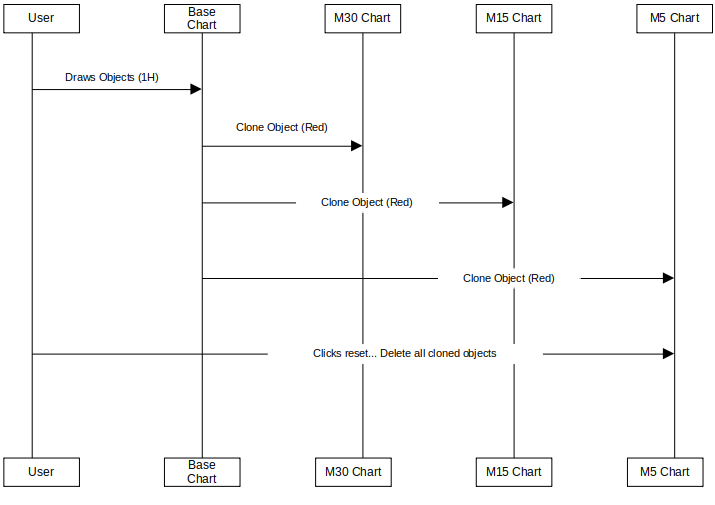
- Reset Functionality: Clears all synchronized charts (preserves price chart).
2. System Architecture:

3. Workflow logic:

4. Propagation logic:

5. Development process:
- Chart initialization: Set base chart to user-selected timeframe. Assign other charts to remaining timeframes (H1/M30/M15/M5), and store chart IDs for synchronization group.
- Object tracking: Tag objects with origin timeframe metadata, and generate clone IDs [OriginalName]_clone_[ChartID].
- Hierarchy management: Maintain timeframe priority list.
const ENUM_TIMEFRAMES timeframes[4] = {PERIOD_H1, PERIOD_M30, PERIOD_M15, PERIOD_M5};
- Reset system: Deletes all objects except price chart elements and the reset button itself.
Getting started
//+------------------------------------------------------------------+
//|                                        ChartSyncIndicator.mq5    |
//|                                  Copyright 2025, MetaQuotes Ltd. |
//|                                             https://www.mql5.com |
//+------------------------------------------------------------------+
#property copyright "GIT under MetaQuotes Ltd."
#property version   "1.01"
#property indicator_chart_window
#property indicator_plots 0

input ENUM_TIMEFRAMES BaseTimeframe = PERIOD_H1;  // Base timeframe for objects
input bool SyncAllTimeframes = false;
input color DefaultObjColor = clrDodgerBlue;
input ENUM_LINE_STYLE DefaultObjStyle = STYLE_SOLID;
input int DefaultObjWidth = 2;
input bool DefaultObjBack = true;
input bool SyncUnlockedObjects = false;
input int   ResetButtonX = 10;
input int   ResetButtonY = 20;
We start by defining user-configurable input parameters for a chart synchronization indicator. The BaseTimeFrame input allows the user to select a primary timeframe (e.g., H1) from which graphical objects will be synchronized to other charts. The `SyncAllTimeFrames` boolean determines whether objects should be synced to all timeframes or only selected ones. Visual properties of the objects, such as their color (DefaultObjColor), line style (DefaultObjStyle), and line width (DefaultObjWidth) are customizable for clear and consistent display. The `DefaultObjBack` decides whether the objects should appear in the background of the chart.
The SyncUnlockedObjects` input specifies whether only unlocked objects should be synced, providing control over editable elements. Finally, ResetButtonX and ResetButtomY determine the on-screen position of a reset button used to clear synced drawings.
#define OBJ_ORIGIN_TF   "OBJ_ORIGIN_TF_"
#define RESET_BUTTON    "resetBtn"

long baseChartID;
string baseSymbol;
string timeframesAssigned[];
ENUM_TIMEFRAMES availableTFs[4] = {PERIOD_H1, PERIOD_M30, PERIOD_M15, PERIOD_M5};
Here we set up some foundational constants and variables used in a chart synchronization system. The #define directives create two string constants OBJ_ORIGIN_TF_, which we use as a prefix to tag objects with their originating timeframe, and resetBtn, which represents the on-screen reset button. The `baseChartID` variable stores the ID of the main chart (or base chart) that serves as the reference point for synchronization. Base symbol holds the trading symbol of that chart. The timeframesAssigned is a dynamic string array meant to store timeframes selected by the user for synchronization. Lastly, `availableTFs` is a fixed array listing four specific timeframes: H1, M30, M15, and M5.
//+------------------------------------------------------------------+
//| Custom indicator initialization function                         |
//+------------------------------------------------------------------+
int OnInit() {
   baseChartID = ChartID();
   baseSymbol = Symbol();

   // Set this chart to user-selected base timeframe
   if(Period() != BaseTimeframe) {
      ChartSetSymbolPeriod(baseChartID, baseSymbol, BaseTimeframe);
   }

   AssignTimeframesToCharts();
   CreateResetButtons();
   return INIT_SUCCEEDED;
}
When the indicator is loaded, it first captures the current chart's ID (baseChartID) and the trading symbol (baseSymbol). It then checks if the current chart's timeframe matches the user-defined BaseTimeFrame. If not, it automatically switches the chart to the specified base timeframe using ChartSetSymbolPeriod(). After ensuring the correct timeframe is set, it calls two helper functions: `AssignTimeFramesToChart()` to assign or track the charts and timeframes that will be part of the synchronization process and CreateResetButtons() to draw a user interface button on the chart that allows users to reset or refresh the synchronized objects.
void AssignTimeframesToCharts() {
   // Create a list of timeframes excluding the base TF
   ENUM_TIMEFRAMES timeframes[3];
   int index = 0;

   for(int i = 0; i < 4; i++) {
      if(availableTFs[i] != BaseTimeframe) {
         timeframes[index] = availableTFs[i];
         index++;
      }
   }

   int tfIndex = 0;
   long currChart = ChartFirst();
   ArrayResize(timeframesAssigned, 0);

   while(currChart != -1 && tfIndex < ArraySize(timeframes)) {
      if(currChart != baseChartID) {
         ChartSetSymbolPeriod(currChart, baseSymbol, timeframes[tfIndex]);
         int size = ArraySize(timeframesAssigned);
         ArrayResize(timeframesAssigned, size + 1);
         timeframesAssigned[size] = (string)currChart;
         tfIndex++;
      }
      currChart = ChartNext(currChart);
   }
}
The assign timeframes to chart function is responsible for preparing and assigning different chart timeframes (excluding the base timeframe) for synchronization. It starts by creating a temporary array timeframes to hold the non-base timeframes from the predefined availableTFs list. It loops through availableTFs and adds any timeframe that does not match the user-selected `BaseTimeFrame into the `timeframes` array. This ensures that only the alternate timeframes (e.g., M30, M15, M5 if H1 is the base) will be assigned to separate chart windows for synchronization.
The function then loops through all open chart windows using ChartFirst() and ChartNext() to find candidate charts for synchronization. It skips the base chart (using baseChartID) and assigns one of the filtered timeframes to each available chart using ChartSetSymbolPeriod(). As each chart is assigned a timeframe, its chart ID is converted to a string and stored in the timeframesAssigend array which tracks which charts are participating in the synchronization. The loop stops once all non-base timeframes are assigned or no more charts are available.
void OnChartEvent(const int id, const long &lparam, const double &dparam, const string &sparam) {
   switch(id) {
      case CHARTEVENT_OBJECT_CREATE:
      case CHARTEVENT_OBJECT_DRAG:
         PropagateObject(sparam, (ENUM_TIMEFRAMES)Period());
         break;
      case CHARTEVENT_OBJECT_DELETE:
         DeleteSyncedInstances(sparam);
         break;
      case CHARTEVENT_OBJECT_CLICK:
         if(sparam == RESET_BUTTON) {
            DeleteAllSyncedObjects();
         }
         break;
   }
}
The OnChartEvent() function handles user interactions with chart objects and responds accordingly to keep synchronization intact. When an object is created or moved (OBJECT_CREATE or OBJECT_DRAG), the PropagateObject() function is called to replicate or update that object across all synchronized charts based on the current timeframe. If an object is deleted (OBJECT_DELETE), the function DeleteSyncedInstances() removes all its synchronized copies from other charts. Additionally, if the user clicks on the reset button (OBJECT_CLICK and sparam == RESET_BUTTON), it triggers DeleteAllSyncedObjects() to clear all synced graphical objects across timeframes. This event-driven logic ensures that any modification made to chart objects is instantly reflected or handled across the entire multi-timeframe setup.
void PropagateObject(string objName, ENUM_TIMEFRAMES srcTF) {
   if(StringFind(objName, "_clone_") != -1) return;
   bool isLocked = ObjectGetInteger(ChartID(), objName, OBJPROP_SELECTABLE);
   if(!SyncUnlockedObjects && !isLocked) return;

   for(int i = 0; i < ArraySize(timeframesAssigned); i++) {
      long targetChart = (long)StringToInteger(timeframesAssigned[i]);
      ENUM_TIMEFRAMES targetTF = (ENUM_TIMEFRAMES)ChartPeriod(targetChart);
      bool shouldPropagate = false;

      if(SyncAllTimeframes) {
         shouldPropagate = true;
      }
      else {
         // Propagate from base timeframe to all others
         if(srcTF == BaseTimeframe) {
            shouldPropagate = true;
         }
         // Propagate from other timeframes only to lower timeframes
         else if(srcTF > targetTF) {
            shouldPropagate = true;
         }
      }

      if(shouldPropagate) {
         CloneObject(objName, ChartID(), targetChart);
      }
   }
}
The PropagateObject() function is responsible for synchronizing graphical objects like trendlines or shapes across different chart timeframes. It first filters out any object that is already a clone (indicated by "clone" in its name) to avoid recursively propagating copies. It then checks if the object is locked (selectable); if the SyncUnlockedObjects setting is false and the object is not locked, the function exits early, ensuring only user-approved or editable objects are propagated. This prevents accidental synchronization of non-interactive objects that may not be intended for replication.
The core of the function iterates through all assigned charts stored in the timeframesAssigned array. For each target chart, it evaluates whether the object should be propagated based on the current synchronization rules. If SyncAllTimeframes is enabled, the object is cloned to all charts regardless of source or target timeframe. Otherwise, it uses a logical rule: if the object originates from the BaseTimeframe, it propagates to all other timeframes; if it originates from a higher timeframe (e.g., H1) and the target is lower (e.g., M15), it is also propagated. Once these conditions are satisfied, CloneObject() is called to replicate the object from the source chart to the target chart, maintaining visual consistency across timeframes.
void CloneObject(string objName, long srcChart, long targetChart) {
   int type = (int)ObjectGetInteger(srcChart, objName, OBJPROP_TYPE);
   string newName = objName + "_clone_" + (string)targetChart;
   if(!ObjectCreate(targetChart, newName, (ENUM_OBJECT)type, 0, 0, 0)) return;

   datetime time1 = (datetime)ObjectGetInteger(srcChart, objName, OBJPROP_TIME, 0);
   double price1 = ObjectGetDouble(srcChart, objName, OBJPROP_PRICE, 0);
   ObjectSetInteger(targetChart, newName, OBJPROP_TIME, 0, time1);
   ObjectSetDouble(targetChart, newName, OBJPROP_PRICE, 0, price1);

   datetime time2 = (datetime)ObjectGetInteger(srcChart, objName, OBJPROP_TIME, 1);
   double price2 = ObjectGetDouble(srcChart, objName, OBJPROP_PRICE, 1);
   if(time2 > 0 || price2 > 0) {
      ObjectSetInteger(targetChart, newName, OBJPROP_TIME, 1, time2);
      ObjectSetDouble(targetChart, newName, OBJPROP_PRICE, 1, price2);
   }

   color objColor = ObjectGetInteger(srcChart, objName, OBJPROP_COLOR, 0);
   ENUM_LINE_STYLE objStyle = (ENUM_LINE_STYLE)ObjectGetInteger(srcChart, objName, OBJPROP_STYLE, 0);
   int objWidth = ObjectGetInteger(srcChart, objName, OBJPROP_WIDTH, 0);
   bool objBack = ObjectGetInteger(srcChart, objName, OBJPROP_BACK, 0);

   ObjectSetInteger(targetChart, newName, OBJPROP_COLOR, objColor != clrNONE ? objColor : DefaultObjColor);
   ObjectSetInteger(targetChart, newName, OBJPROP_STYLE, objStyle);
   ObjectSetInteger(targetChart, newName, OBJPROP_WIDTH, objWidth);
   ObjectSetInteger(targetChart, newName, OBJPROP_BACK, objBack);
   ObjectSetInteger(targetChart, newName, OBJPROP_SELECTABLE, false);
   ObjectSetInteger(targetChart, newName, OBJPROP_HIDDEN, true);

   string originTag = OBJ_ORIGIN_TF + EnumToString((ENUM_TIMEFRAMES)Period());
   ObjectSetString(targetChart, newName, OBJPROP_TOOLTIP, originTag);

   if(type == OBJ_TEXT || type == OBJ_LABEL) {
      string txt = ObjectGetString(srcChart, objName, OBJPROP_TEXT);
      ObjectSetString(targetChart, newName, OBJPROP_TEXT, txt);
   }

   if(type == OBJ_FIBO) {
      int levels = (int)ObjectGetInteger(srcChart, objName, OBJPROP_LEVELS);
      ObjectSetInteger(targetChart, newName, OBJPROP_LEVELS, levels);
      for(int i = 0; i < levels; i++) {
         double level = ObjectGetDouble(srcChart, objName, OBJPROP_LEVELVALUE, i);
         ObjectSetDouble(targetChart, newName, OBJPROP_LEVELVALUE, i, level);
      }
   }
}
The CloneObject() function is responsible for replicating a graphical object from a source chart (srcChart) to a target chart (targetChart). It begins by retrieving the object type (such as trendline, rectangle, or Fibo) and generating a new unique name by appending _clone_ and the target chart ID to the original name. If the object cannot be created on the target chart using ObjectCreate(), the function exits early. It then copies the first coordinate (time and price) from the source object and assigns it to the same position on the cloned object in the target chart. If a second coordinate exists (as is common with trendlines or channels), it is also transferred accordingly.
Next, the function applies visual properties to the cloned object to maintain its appearance. These include the color, style (e.g., solid or dashed), width, and background layering (OBJPROP_BACK). The cloned object is made unselectable (OBJPROP_SELECTABLE = false) and hidden from the object list (OBJPROP_HIDDEN = true) to prevent accidental edits and reduce clutter. Additionally, a tooltip label is added using OBJPROP_TOOLTIP, tagging the object with the original timeframe for reference. This helps traders identify where the object came from, especially when working with multiple synchronized charts.
Lastly, the function handles special object types. If the object is a text label or simple label, it transfers the displayed text content to the clone. If it's a Fibonacci object (OBJ_FIBO), the function copies the number of levels and their respective price levels, ensuring the Fibo structure remains accurate on the target chart. By thoroughly duplicating both coordinates and visual/structural properties, CloneObject() guarantees that the synchronized objects remain faithful to their originals, enabling consistent technical analysis across all selected timeframes.
//+------------------------------------------------------------------+
//| Required OnCalculate function                                    |
//+------------------------------------------------------------------+
int OnCalculate(const int rates_total,
                const int prev_calculated,
                const datetime &time[],
                const double &open[],
                const double &high[],
                const double &low[],
                const double &close[],
                const long &tick_volume[],
                const long &volume[],
                const int &spread[]) {
   return(rates_total);
}
The indicator does not rely on OnCalculate() for its core logic since it operates entirely through chart events and object manipulation. However, the OnCalculate() function is still required in all custom indicators; omitting it causes a compilation error. To satisfy this requirement, a minimal stub is included that simply returns rates_total without performing any calculations.
void DeleteSyncedInstances(string objName) {
   long thisChart = ChartID();
   bool isClone = StringFind(objName, "_clone_") != -1;
   string baseName = isClone ? StringSubstr(objName, 0, StringFind(objName, "_clone_")) : objName;

   // Delete from all charts
   ObjectDelete(thisChart, objName);
   for(int i = 0; i < ArraySize(timeframesAssigned); i++) {
      long chartID = (long)StringToInteger(timeframesAssigned[i]);
      ObjectDelete(chartID, baseName);
      ObjectDelete(chartID, baseName + "_clone_" + (string)thisChart);
   }
}
The DeleteSyncedInstances() function ensures that when a graphical object is deleted from one chart, all of its synchronized counterparts on other charts are also removed. It first determines whether the deleted object is a clone (by checking if its name contains _clone_) and extracts the original base name accordingly. The function then deletes the object from the current chart and iterates through all charts listed in timeframesAssigned, removing both the base object and any associated clone that references the current chart.
void DeleteAllSyncedObjects() {
   long chartIDs[];
   ArrayResize(chartIDs, ArraySize(timeframesAssigned) + 1);
   chartIDs[0] = baseChartID;
   for(int i = 0; i < ArraySize(timeframesAssigned); i++)
      chartIDs[i + 1] = (long)StringToInteger(timeframesAssigned[i]);

   for(int j = 0; j < ArraySize(chartIDs); j++) {
      int total = ObjectsTotal(chartIDs[j]);
      for(int i = total - 1; i >= 0; i--) {
         string name = ObjectName(chartIDs[j], i);
         if(StringFind(name, RESET_BUTTON) == -1)
            ObjectDelete(chartIDs[j], name);
      }
   }
}
The DeleteAllSyncedObjects() function removes all graphical objects across all synchronized charts, except for the reset button itself. It first constructs an array, chartIDs containing the base chart ID and all chart IDs from the timeframesAssigned list. Then, for each of these charts, it iterates through all existing objects in reverse order and deletes them—unless the object’s name contains RESET_BUTTON, ensuring the reset interface remains intact. This function provides a quick way to clear the workspace of all synchronized drawings.
void CreateResetButtons() {
   CreateResetButtonOnChart(baseChartID);
   for(int i=0; i<ArraySize(timeframesAssigned); i++)
      CreateResetButtonOnChart((long)StringToInteger(timeframesAssigned[i]));
}
The CreateResetButtons() function adds a reset button to the base chart and all synchronized charts. It loops through each assigned chart and calls CreateResetButtonOnChart(), allowing users to clear all synced objects from the base chart with a single click.
void CreateResetButtonOnChart(long cid) {
   if(ObjectFind(cid, RESET_BUTTON) >= 0) ObjectDelete(cid, RESET_BUTTON);
   if(!ObjectCreate(cid, RESET_BUTTON, OBJ_BUTTON, 0, 0, 0)) return;
   ObjectSetInteger(cid, RESET_BUTTON, OBJPROP_XDISTANCE, ResetButtonX);
   ObjectSetInteger(cid, RESET_BUTTON, OBJPROP_YDISTANCE, ResetButtonY);
   ObjectSetInteger(cid, RESET_BUTTON, OBJPROP_XSIZE, 80);
   ObjectSetInteger(cid, RESET_BUTTON, OBJPROP_YSIZE, 20);
   ObjectSetInteger(cid, RESET_BUTTON, OBJPROP_BGCOLOR, clrGray);
   ObjectSetInteger(cid, RESET_BUTTON, OBJPROP_COLOR, clrWhite);
   ObjectSetString(cid, RESET_BUTTON, OBJPROP_TEXT, "Reset All");
   ObjectSetInteger(cid, RESET_BUTTON, OBJPROP_SELECTABLE, false);
   ObjectSetInteger(cid, RESET_BUTTON, OBJPROP_HIDDEN, false);
   ChartRedraw(cid);
}
The CreateResetButtonOnChart() function creates a "Reset All" button on a specified chart (cid). It first checks if a button with the same name already exists and deletes it to avoid duplication. Then, it creates a new button (OBJ_BUTTON) and sets its position using ResetButtonX and ResetButtonY, along with fixed dimensions and styling for background color, text color, and label. The button is made non-selectable but visible (HIDDEN = false) so users can interact with it.
void OnDeinit(const int reason) {
   DeleteAllSyncedObjects();
}
Finally, the OnDeinit() function is called when the indicator is removed or the chart is closed. It triggers DeleteAllSyncedObjects() to clean up all synchronized graphical elements, ensuring no residual objects are left behind.
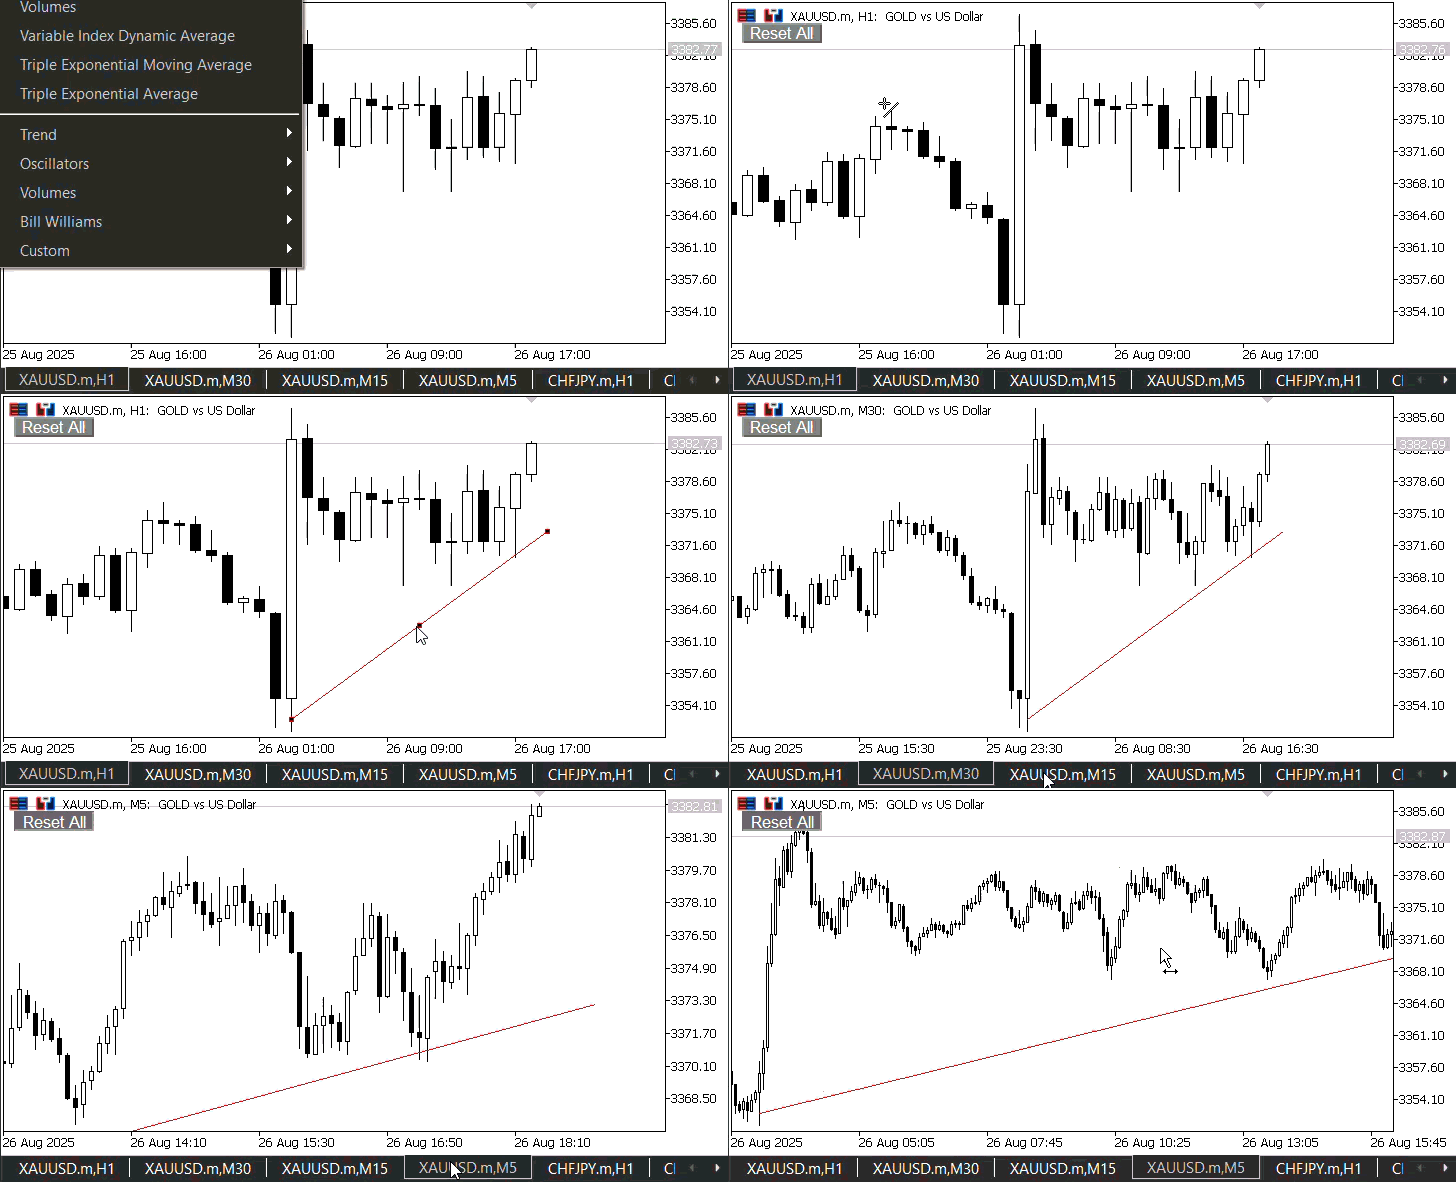
Demonstration:

Conclusion
In summary, we developed a multi-timeframe chart synchronization indicator that enhances technical analysis by automatically replicating graphical objects such as trendlines, rectangles, and Fibonacci levels across selected timeframes. We began by setting up configurable inputs to control object styles, synchronization behavior, and UI components like the reset button. Key functions were implemented to assign timeframes to chart windows, detect and propagate object events (creation, movement, deletion), and maintain clean synchronization through cloning and consistent object naming. Additional utility functions handled reset button creation and full cleanup of objects upon deinitialization or user command.
In conclusion, this indicator provides traders with a powerful and efficient tool for multi-timeframe analysis by eliminating the need to manually redraw or manage objects across charts. It ensures consistency and clarity when working with multiple perspectives of the same symbol, streamlining workflows and reducing cognitive load. With synchronized object visibility and seamless interaction between timeframes, traders can better spot confluences, track key levels, and make more informed decisions.
Warning: All rights to these materials are reserved by MetaQuotes Ltd. Copying or reprinting of these materials in whole or in part is prohibited.
This article was written by a user of the site and reflects their personal views. MetaQuotes Ltd is not responsible for the accuracy of the information presented, nor for any consequences resulting from the use of the solutions, strategies or recommendations described.
 From Novice to Expert: Mastering Detailed Trading Reports with Reporting EA
 Developing a Replay System (Part 77): New Chart Trade (IV)
 MetaTrader Meets Google Sheets with Pythonanywhere: A Guide to Secure Data Flow
 Simplifying Databases in MQL5 (Part 1): Introduction to Databases and SQL
- Free trading apps
- Over 8,000 signals for copying
- Economic news for exploring financial markets
You agree to website policy and terms of use