
Mastering Quick Trades: Overcoming Execution Paralysis
Introduction
This article aims to address both scalpers and traders who need to make quick, fast decisions and trade executions. It will also be excellent for the traders who have execution paralysis or overanalyze when they find a trade entry and hence end up losing the whole trade by not pushing the buttons and taking it. I believe most, if not all, the time, fast trade executions and operations can be the game changer and difference maker between Trader A and Trader B with equal skill and experience. The need for a trader to make quick, instant decisions in trading, especially scalping and short-term trades, is very vital, as a delay of even seconds/minutes can cause heavy losses, and executions on time can result in extra hundreds of dollars, if not thousands, made in profits.
As a trader myself, I know traders are faced with countless challenges, new mental and technical barriers we have to break each time we open or execute a new trade. In-fact most traders face almost similar, if not identical, challenges at some point in their trading careers, but what separates all of them is that different traders handle, react to, and anticipate this challenges differently; hence the difference in trading results, which has proven to be colossal even when traders who are evenly matched and separated by fine margins in skill, experience, composure, decision-making, and technique are different.
One of this prominent mental barriers and issues is that for most, if not all, traders who have been following price, there comes a time when eventually they face this familiar demon whereby they trace, anticipate, analyze, and finally spot a trade opportunity and are sure that it would be a profitable trade, but they have this voice at the back of their head that tells them, what if they are wrong? What if they lose money? And eventually this self-doubt and lack of confidence gets to them, and they have execution paralysis and do not enter the trade, and of course the trade eventually moves in their direction but without them. This causes a series of regrets and blunders.
Hence, they now open trades carelessly and enter trades at bad positions just because of FOMO (Fear Of Missing Out) and revenge trading, which eventually leads to more mistakes and eventually loss of money, and all this is caused by lack of confidence, self-doubt, and the voice at the back of their head whispering negative imaginations.
Now this indicator aims to address this by acting as a voice only that it will be visible on your chart screen, confirming to you that indeed you are right and should execute the trade with no doubts. Also, it can be used as an exit warning to avoid reversals and consolidations.
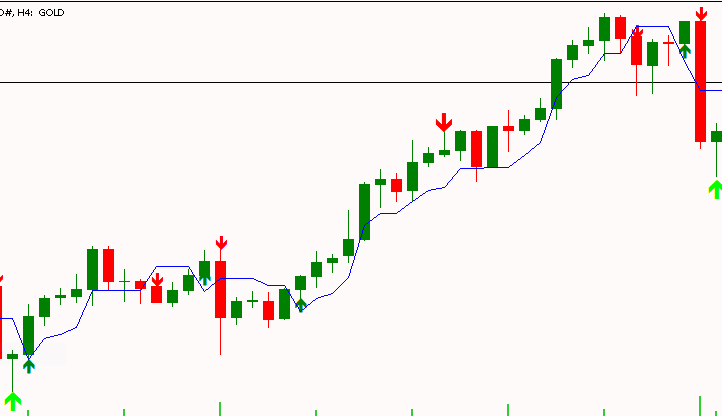
Fig.1 UT B0T illustration plottings on H4 chart timeframe
Introduction to the UT Bot indicator
Now that we have introduced and identified the common problem faced by many traders around the globe at most times, I would like to categorically say that traders should worry less and say no more because today I want to unveil this extraordinary custom indicator that traders who like to scalp trade and make short-term quick executions will benefit most from. This custom indicator generates signals and exit and entry points and even has a trailing stop-loss line that would act as an exit point in case of error or to book profits.
The other beneficiaries of this excellent indicator are those traders who are still in a development phase and are still trying to hone their skill set and technique. This indicator can be used with their technique and trading style and method by acting as an entry and exit confirmation tool. Once the indicator and his trading technique align and offer the same insights, he can execute. Eventually, the trader will develop confidence and trust in himself and his technique. It also could be used as a general confirmation tool for even experienced traders who want a keen, sharp, and watchful eye over them to assist in the weight of their trading decision.
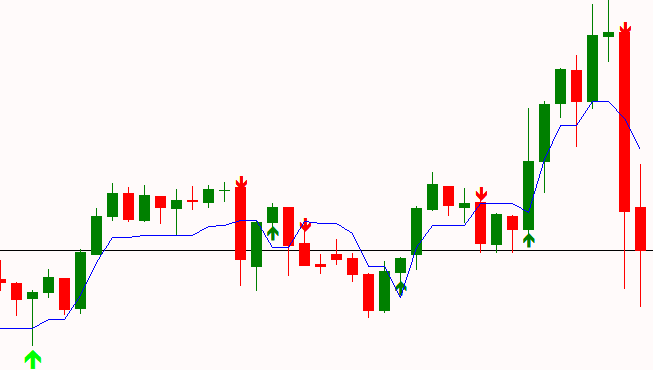
Fig.2 UT BOT plotting on 1 Minute chart
Inner workings of the UT bot indicator
The aim of this article is to make sure the reader gets a personally customizable UT Bot that scans the market and current trading price and offers insight into the trend and best execution one can execute according to average true range and trend, meaning he can make quick trades and quick executions with minimum analysis time and also scalping with instant reaction time and a trailing stop-loss line for exits.
The UT BOT indicator basically is a trend-following indicator designed to work by generating buy and sell signals at potential entry points on the chart based on price action and relative to a volatility-adjusted and dynamic trailing stop-loss. The trailing stop loss is adjusted using average true range (ATR). The UT BOT does not depend on traditional moving averages for its main logic but utilizes a single-period exponential moving average to detect crossover at current prices. The indicator generates the signals at potential entry points using the following. It plots:
- green arrows below bars for buy signals ("UT Long");
- red arrows above bars for sell signals ("UT Short");
- a blue line representing the trailing stop level;
- alerts for real-time notifications when signals occur.
This indicator can be used in any asset class(metals, forex, indices, commodities), and it generates signals at all time frames. The best and most crucial part about the indicator is that it can be personally customized according to a trader's liking. The period, sensitivity, and signal smoothing are some of the adjustable features. The UT BOT uses average true range (ATR), often quoted as a measure of market volatility, to calculate a trailing stop loss, which is the primary technique used by the indicator. Another advantage of average true range (ATR) is that the UT BOT adapts to volatility, avoiding false signals in choppy markets, and has simple, reliable, non-repainting logic.
The UT BOT has a trading logic and signal generation formula that is elementary since it only requires price to cross over the trailing stop and not complex moving average interactions, making it faster and less prone to overfitting.
The UT BOT uses average true range (ATR) to dynamically adjust the distance of the trailing stop from the current trading price, making it responsive to the ever-changing market conditions. Here’s how it works:
- ATR Calculation:
- ATR measures the average price range (high-low) over a trader-defined period (c, default 10 bars).
- It’s multiplied by a sensitivity factor (a, default 1.0) to set the trailing stop loss offset (nLoss = a * ATR).
- Example: If ATR = 0.0010 (10 pips) and a = 1.0, the trailing stop loss is 10 pips from the price.
- Trailing Stop Loss Logic:
- The trailing stop loss (trail) follows the price, adjusting based on whether the price is trending up or down.
- Uptrend: If the current price (src) and previous price (src1) are above the previous trailing stop loss (trail[i-1]), the stop loss moves up to max(trail[i-1], src - nLoss). This locks in profits while trailing below the price.
- Downtrend: If both prices are below the previous stop loss, it moves down to min(trail[i-1], src + nLoss).
- Direction Change:
- If the price crosses above the previous stop (src > trail[i-1]), the stop resets to src - nLoss.
- If it crosses below, it resets to src + nLoss.
- This creates a "stair-step" line that adapts to price movements, staying closer in low-volatility markets and wider in high-volatility ones.
- The trailing stop loss (trail) follows the price, adjusting based on whether the price is trending up or down.
- Price Source:
- By default, the price (src) is the closing price of each bar (close[i]).
- If the Heikin Ashi option (h = true) is enabled, it uses Heikin Ashi close prices, which smooth out price fluctuations for cleaner signals.
- Signal Generation:
- Signals are based on crossovers of the price relative to the trailing stop:
- Buy Signal ("UT Long"): Triggered when the current price crosses above the trailing stop (src > trail_curr && src1 <= trail1).
- Sell Signal ("UT Short"): Triggered when the current price crosses below the trailing stop (trail_curr > src && trail1 <= src1).
- A 1-period EMA (ema = src) is used in the original Pine Script to confirm crossovers, but in practice, it’s equivalent to the close price, so the MQL5 code simplifies this by using src directly.
- Signals are based on crossovers of the price relative to the trailing stop:
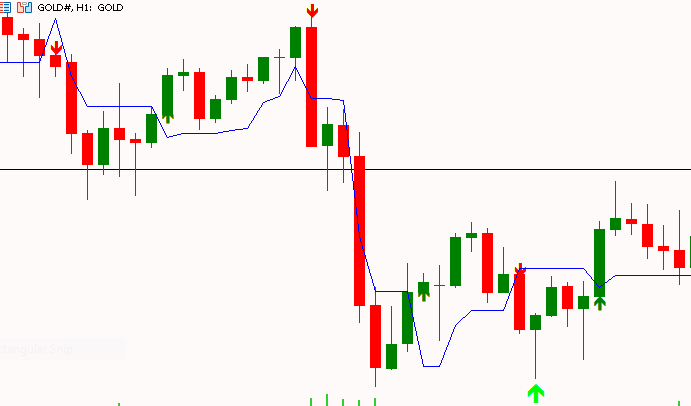
Fig.3 H1 chart showing UT BOT plotting
Automating trading decisions with UT bot in MQL5
To automate, illustrate, and implement this strategy, I have created:
- A UT bot indicator to analyze trends, detect possible trade entry points, and also plot buy/sell signals on the charts.
- A UT indicator + UT bot EA to trade based on trade entry detections, by the UT indicator incorporating ATR and EMA for entries.
Decision-making process
This indicator’s decisions (plotting arrows, drawing the trailing stop line, and triggering alerts) are driven by the following logic:
- Trailing Stop Calculation
- For each bar, the indicator calculates trail[i] based on the current price (src), previous price (src1), and previous trailing stop (trail[i-1]). The ATR-based offset (nLoss) ensures the stop adapts to volatility, reducing false signals in choppy markets.
// Initialize first trailing stop value
   trail[0] = calculate_ha ? ha_close[0] : close[0];

   // Trailing stop and position calculation
   for (int i = 1; i < rates_total; i++)
   {
      double src = calculate_ha ? ha_close[i] : close[i];
      double src1 = calculate_ha ? ha_close[i - 1] : close[i - 1];
      double nLoss = a * atr[i];

      if (src > trail[i - 1] && src1 > trail[i - 1])
         trail[i] = MathMax(trail[i - 1], src - nLoss);
      else if (src < trail[i - 1] && src1 < trail[i - 1])
         trail[i] = MathMin(trail[i - 1], src + nLoss);
      else if (src > trail[i - 1])
         trail[i] = src - nLoss;
      else
         trail[i] = src + nLoss;

      if (src1 < trail[i - 1] && src > trail[i - 1])
         pos_arr[i] = 1.0;
      else if (src1 > trail[i - 1] && src < trail[i - 1])
         pos_arr[i] = -1.0;
      else
         pos_arr[i] = pos_arr[i - 1];

      Print("Bar ", i, ": src=", src, ", trail=", trail[i], ", pos=", pos_arr[i]);
   }

   ArrayResize(BuyBuffer, rates_total);
   ArrayResize(SellBuffer, rates_total);
   ArrayResize(TrailBuffer, rates_total);
   ArrayInitialize(BuyBuffer, EMPTY_VALUE);
   ArrayInitialize(SellBuffer, EMPTY_VALUE);
   ArrayInitialize(TrailBuffer, EMPTY_VALUE);

   // Signal and trailing stop plotting
   for (int i = 1; i < rates_total; i++)
   {
      double src = calculate_ha ? ha_close[i] : close[i];
      double src1 = calculate_ha ? ha_close[i - 1] : close[i - 1];
      double trail_curr = trail[i];
      double trail1 = trail[i - 1];

      bool above = (src > trail_curr) && (src1 <= trail1);
      bool below = (trail_curr > src) && (trail1 <= src1);

      bool buy_signal = above; // Simplified to ensure signals
      bool sell_signal = below;

      if (buy_signal)
      {
         BuyBuffer[i] = low[i] - Point() * 10; // Offset for visibility
         Print("Buy signal at bar ", i, ", time: ", TimeToString(time[i]), ", low: ", low[i]);
      }
      if (sell_signal)
      {
         SellBuffer[i] = high[i] + Point() * 10; // Offset for visibility
         Print("Sell signal at bar ", i, ", time: ", TimeToString(time[i]), ", high: ", high[i]);
      }

      TrailBuffer[i] = trail[i];
      if (trail[i] != EMPTY_VALUE)
         Print("Trailing stop at bar ", i, ": ", trail[i]);
   }
- Position Tracking:
- A pos_arr array tracks the trend direction:
- pos = 1.0 (long) when the price crosses above the trailing stop.
- pos = -1.0 (short) when it crosses below.
- pos = previous pos otherwise, maintaining trend continuity.
- This is not applicable to be used for plotting in the MQL5 version (due to MetaTrader 5’s single-color plot limitation) but helps generate signals.
   double trail[];
   double pos_arr[];
   ArrayResize(trail, rates_total);
   ArrayResize(pos_arr, rates_total);
   ArraySetAsSeries(trail, false);
   ArraySetAsSeries(pos_arr, false);
   ArrayInitialize(trail, EMPTY_VALUE);
   ArrayInitialize(pos_arr, 0.0);
- Signal Detection:
- A buy signal occurs when the price crosses from below to above the trailing stop (above = src > trail_curr && src1 <= trail1).
- A sell signal occurs when the price crosses from above to below (below = trail_curr > src && trail1 <= src1).
- These crossovers ensure signals are generated only on confirmed trend changes, reducing noise.
// Trailing stop and position calculation
   for (int i = 1; i < rates_total; i++)
   {
      double src = calculate_ha ? ha_close[i] : close[i];
      double src1 = calculate_ha ? ha_close[i - 1] : close[i - 1];
      double nLoss = a * atr[i];

      if (src > trail[i - 1] && src1 > trail[i - 1])
         trail[i] = MathMax(trail[i - 1], src - nLoss);
      else if (src < trail[i - 1] && src1 < trail[i - 1])
         trail[i] = MathMin(trail[i - 1], src + nLoss);
      else if (src > trail[i - 1])
         trail[i] = src - nLoss;
      else
         trail[i] = src + nLoss;

      if (src1 < trail[i - 1] && src > trail[i - 1])
         pos_arr[i] = 1.0;
      else if (src1 > trail[i - 1] && src < trail[i - 1])
         pos_arr[i] = -1.0;
      else
         pos_arr[i] = pos_arr[i - 1];

      Print("Bar ", i, ": src=", src, ", trail=", trail[i], ", pos=", pos_arr[i]);
   }

   ArrayResize(BuyBuffer, rates_total);
   ArrayResize(SellBuffer, rates_total);
   ArrayResize(TrailBuffer, rates_total);
   ArrayInitialize(BuyBuffer, EMPTY_VALUE);
   ArrayInitialize(SellBuffer, EMPTY_VALUE);
   ArrayInitialize(TrailBuffer, EMPTY_VALUE);
- Plotting and Alerts:
- Buy: Plots a green arrow below the bar’s low when a buy signal triggers.
- Sell: Plots a red arrow above the bar’s high when a sell signal triggers.
- Trailing Stop: Plots the trail[i] value as a blue line for every bar.
- Alerts: Triggers "UT Long" or "UT Short" alerts on the latest bar when a new signal occurs; this is checked against the bar’s timestamp to avoid duplicates.
// Signal and trailing stop plotting
   for (int i = 1; i < rates_total; i++)
   {
      double src = calculate_ha ? ha_close[i] : close[i];
      double src1 = calculate_ha ? ha_close[i - 1] : close[i - 1];
      double trail_curr = trail[i];
      double trail1 = trail[i - 1];

      bool above = (src > trail_curr) && (src1 <= trail1);
      bool below = (trail_curr > src) && (trail1 <= src1);

      bool buy_signal = above; // Simplified to ensure signals
      bool sell_signal = below;

      if (buy_signal)
      {
         BuyBuffer[i] = low[i] - Point() * 10; // Offset for visibility
         Print("Buy signal at bar ", i, ", time: ", TimeToString(time[i]), ", low: ", low[i]);
      }
      if (sell_signal)
      {
         SellBuffer[i] = high[i] + Point() * 10; // Offset for visibility
         Print("Sell signal at bar ", i, ", time: ", TimeToString(time[i]), ", high: ", high[i]);
      }

      TrailBuffer[i] = trail[i];
      if (trail[i] != EMPTY_VALUE)
         Print("Trailing stop at bar ", i, ": ", trail[i]);
   }

   // Alerts on the latest bar
   if (rates_total > 1)
   {
      int i = rates_total - 1;
      double src = calculate_ha ? ha_close[i] : close[i];
      double src1 = calculate_ha ? ha_close[i - 1] : close[i - 1];
      double trail_curr = trail[i];
      double trail1 = trail[i - 1];

      bool above = (src > trail_curr) && (src1 <= trail1);
      bool below = (trail_curr > src) && (trail1 <= src1);

      bool buy_signal = above;
      bool sell_signal = below;

      static datetime last_time = 0;
      if (time[i] != last_time)
      {
         if (buy_signal)
         {
            Alert("UT Long at ", TimeToString(time[i]));
            Print("UT Long alert triggered at ", TimeToString(time[i]));
         }
         if (sell_signal)
         {
            Alert("UT Short at ", TimeToString(time[i]));
            Print("UT Short alert triggered at ", TimeToString(time[i]));
         }
         last_time = time[i];
      }
   }

   return rates_total;
}
This indicator analyzes, detects, and plots buy/sell arrow signals by looking for trend and moving average crossovers for possible trade entries and also plots a stop-loss line to show exit points.
#property copyright "UT BOT ATR Trailing System"
#property version   "1.00"
#property description "Converted from Pine Script to MQL5 with Trailing Stop Line"
#property indicator_chart_window
#property indicator_buffers 3
#property indicator_plots   3

#property indicator_label1  "Buy"
#property indicator_type1   DRAW_ARROW
#property indicator_color1  clrGreen
#property indicator_style1  STYLE_SOLID
#property indicator_width1  2

#property indicator_label2  "Sell"
#property indicator_type2   DRAW_ARROW
#property indicator_color2  clrRed
#property indicator_style2  STYLE_SOLID
#property indicator_width2  2

#property indicator_label3  "Trailing Stop"
#property indicator_type3   DRAW_LINE
#property indicator_color3  clrBlue
#property indicator_style3  STYLE_SOLID
#property indicator_width3  2

input double a = 1.0;   // Key Value. 'This changes the sensitivity'
input int    c = 10;    // ATR Period
input bool   h = false; // Signals from Heikin Ashi Candles

double BuyBuffer[];
double SellBuffer[];
double TrailBuffer[];

int atr_handle;
double ha_open[], ha_high[], ha_low[], ha_close[];
bool calculate_ha = false;

int OnInit()
{
   SetIndexBuffer(0, BuyBuffer, INDICATOR_DATA);
   PlotIndexSetInteger(0, PLOT_ARROW, 233); // Up arrow
   PlotIndexSetDouble(0, PLOT_EMPTY_VALUE, EMPTY_VALUE);

   SetIndexBuffer(1, SellBuffer, INDICATOR_DATA);
   PlotIndexSetInteger(1, PLOT_ARROW, 234); // Down arrow
   PlotIndexSetDouble(1, PLOT_EMPTY_VALUE, EMPTY_VALUE);

   SetIndexBuffer(2, TrailBuffer, INDICATOR_DATA);
   PlotIndexSetDouble(2, PLOT_EMPTY_VALUE, EMPTY_VALUE);

   atr_handle = iATR(_Symbol, PERIOD_CURRENT, c);
   if (atr_handle == INVALID_HANDLE)
   {
      Print("Failed to create ATR handle");
      return INIT_FAILED;
   }

   calculate_ha = h;
   ArraySetAsSeries(BuyBuffer, false);
   ArraySetAsSeries(SellBuffer, false);
   ArraySetAsSeries(TrailBuffer, false);

   Print("Indicator initialized. Symbol: ", _Symbol, ", Timeframe: ", Period());

   return INIT_SUCCEEDED;
}

void OnDeinit(const int reason)
{
   if (atr_handle != INVALID_HANDLE)
      IndicatorRelease(atr_handle);
}

int OnCalculate(const int rates_total,
                const int prev_calculated,
                const datetime &time[],
                const double &open[],
                const double &high[],
                const double &low[],
                const double &close[],
                const long &tick_volume[],
                const long &volume[],
                const int &spread[])
{
   if (rates_total < c + 2)
   {
      Print("Not enough bars: ", rates_total, " (need ", c + 2, ")");
      return 0;
   }

   ArraySetAsSeries(open, false);
   ArraySetAsSeries(high, false);
   ArraySetAsSeries(low, false);
   ArraySetAsSeries(close, false);
   ArraySetAsSeries(time, false);

   double atr[];
   ArrayResize(atr, rates_total);
   ArraySetAsSeries(atr, false);
   if (CopyBuffer(atr_handle, 0, 0, rates_total, atr) != rates_total)
   {
      Print("Failed to copy ATR buffer");
      return 0;
   }
Installation: Compile in MetaEditor and attach to the chart. Draws green arrows for bullish trend trade entries and red arrows for bearish trend trade entries.
Example of use: On GOLD M15/H1, it plots the arrows and trailing stop line on the main chart for visual analysis and presentation.
Source code of the UT bot expert advisor
This EA detects trade signals from the indicator and interprets them depending on the direction of the trend and signal points to make trade entries, checks for the average true range to determine stop-loss levels, and enters trades. It includes risk management (2% risk per trade).
Customizable settings for the EA
This input parameters section allows traders to customize the expert advisor's behavior without modifying the code. For GBPUSD and GBPJPY trading pairs, I have reduced the RiskPct to 1.0% to limit loss exposure per trade, preventing large drawdowns in these pairs' moderate volatility environments. ATR_Prd is set to 10 for faster calculation of volatility, as GBPUSD and GBPJPY experience shorter-term price swings compared to gold.
The EMA_Prd is shortened to 12 to make trend detection more responsive on the M15 timeframe. NewsPause is extended to 20 minutes to avoid the prolonged volatility often seen in GBP pairs during UK/US economic releases.
The MinBrkStr is increased for both pairs to ensure only strong signals are traded, filtering out noise and improving win rates. useHTF is enabled by default to align trades with higher timeframe trends, reducing false signals. MaxSpreadPips and UseDynamicSpread control spread filtering, crucial for GBPJPY's wider spreads during Asian sessions. Drawdown limits are tightened to 5% daily and 10% overall to enforce strict risk management, halting trading if exceeded to preserve capital.
The following code is where we declare input parameters://+------------------------------------------------------------------+ //| UT BOT EA.mq5 | //| EUGENE MMENE | //| https://EMcapital.com | //+------------------------------------------------------------------+ #property copyright "EUGENE MMENE" #property link "https://EMCAPITAL2022" #property version "2.51" #include <Trade\Trade.mqh> #include <Object.mqh> #include <StdLibErr.mqh> #include <Trade\OrderInfo.mqh> #include <Trade\HistoryOrderInfo.mqh> #include <Trade\PositionInfo.mqh> #include <Trade\DealInfo.mqh> input double RiskPct = 1.0; // Reduced risk per trade input double MaxLossUSD = 100.0; input double RecTgt = 7000.0; input int ATR_Prd = 10; // Faster ATR for GBPUSD/GBPJPY input int Brk_Prd = 10; input int EMA_Prd = 12; // Faster EMA for M15 input string GS_Url = ""; input bool NewsFilt = true; input int NewsPause = 60; // Extended news pause input double MinBrkStr_XAUUSD = 0.3; // Not used input double MinBrkStr_GBPUSD = 0.07; // Increased for stronger breakouts input double MinBrkStr_GBPJPY = 0.1; // Increased for GBPJPY volatility input int Vol_Prd = 3; // Increased for volume confirmation input bool Bypass = false; // Enforce breakout strength input bool useHTF = true; // Enable HTF trend filter input string NewsAPI_Url = "https://www.alphavantage.co/query?function=NEWS_SENTIMENT&apikey="; input string NewsAPI_Key = "pub_3f54bba977384ac19b6839a744444aba"; input double DailyDDLimit = 5.0; // Stricter daily drawdown input double OverallDDLimit = 10.0; // Stricter overall drawdown input double TargetBalanceOrEquity = 9000.0; input bool ResetProfitTarget = false; input double MaxLotSize = 4.0; input double MaxSpreadPips = 30.0; // Adjusted for GBPUSD/GBPJPY input bool UseDynamicSpread = true; // Enable dynamic spread input int SpreadAvgPeriod = 5; // Shorter spread averaging
OnInit Function: Setup and Initialization
The OnInit function is called once when the EA is loaded. It validates the trading pairs (GBPUSD or GBPJPY) and sets the minimum breakout strength according to the pair being traded. This ensures the UT bot adapts dynamically to any of the pair's volatility—which is lower for GBPUSD to capture more opportunities in its tighter ranges higher for GBPJPY to avoid false breakouts in its sharper moves. The timeframe array is designed to focus solely on M15, reducing noise from M5 and lag from H1, which improves signal accuracy for these pairs.
Indicators like ATR (for volatility-based SL/TP), volume (for confirmation), and EMA (for trend) are initialized on M15. Higher timeframe EMAs on D1 and H4 are loaded for trend filtering, a key adaptation from gold trading where lower timeframes suffice due to larger moves. If news filtering is enabled, the FetchNewsCalendar function is called to load upcoming events, preventing trades during high-volatility periods. This setup ensures the bot is ready for profitable trading on GBPUSD/GBPJPY by aligning with their market dynamics.
int OnInit() {
   // Validate symbol and set breakout strength
   string sym = Symbol();
   if(StringFind(TradeSymbol, "GBPUSD") >= 0) {
      MinBrkStr = MinBrkStr_GBPUSD;
   } else if(StringFind(TradeSymbol, "GBPJPY") >= 0) {
      MinBrkStr = MinBrkStr_GBPJPY;
   }
   dynBrkStr = MinBrkStr;

   // Initialize M15 timeframe and indicators
   ArrayResize(tfs, 1); // Focus on M15
   tfs[0].tf = PERIOD_M15;
   tfs[0].h_atr = iATR(TradeSymbol, tfs[0].tf, ATR_Prd);
   tfs[0].h_vol = iVolumes(TradeSymbol, tfs[0].tf, VOLUME_TICK);
   tfs[0].h_vol_ma = iMA(TradeSymbol, tfs[0].tf, Vol_Prd, 0, MODE_SMA, PRICE_CLOSE);
   h_ema_d1 = iMA(TradeSymbol, PERIOD_D1, EMA_Prd, 0, MODE_EMA, PRICE_CLOSE);
   h_ema_h4 = iMA(TradeSymbol, PERIOD_H4, EMA_Prd, 0, MODE_EMA, PRICE_CLOSE);

   if(NewsFilt) FetchNewsCalendar();
   return(INIT_SUCCEEDED);
IsTradingTime Function: Session-Based Trading Restriction
This function restricts trading to the London and New York sessions (8:00–20:00 GMT, Monday to Friday), which are the most liquid and volatile periods for GBPUSD and GBPJPY.
GBPUSD sees significant volume during London (8:00–12:00 GMT) and New York (13:00–20:00 GMT) overlaps, while GBPJPY benefits from London/Tokyo overlap but experiences higher volatility during London/New York.
By limiting trades to these hours, the UT bot avoids low-liquidity periods (e.g., the Asian session) that often lead to false breakouts and wider spreads, improving overall profitability and reducing drawdowns. The MqlDateTime structure is used to extract the current hour and day, ensuring precise control. This adaptation is essential for GBP pairs.
bool IsTradingTime() {
   MqlDateTime time;
   TimeCurrent(time);
   return (time.hour >= 8 && time.hour <= 20 && time.day_of_week >= 1 && time.day_of_week <= 5);
}
CalcLots Function: Dynamic Position Sizing with Risk Control
The CalcLots function calculates the position size based on account equity, risk percentage, and stop-loss distance in pips, ensuring no trade exceeds 1% risk. For GBPJPY, the pip value adjustment is 0.1 to account for its higher pip value due to JPY's scale, preventing overexposure; for GBPUSD, it's 0.5.
The risk amount is capped at MaxLossUSD to avoid catastrophic losses. An iterative reduction loop scales down the lot size if it exceeds available margin (with a 20% buffer), addressing "no money" errors common in volatile pairs like GBPJPY.
Lot size is normalized to comply with broker rules (min/max lot). This method promotes consistent risk management, crucial for long-term profitability on GBPUSD/GBPJPY, where price swings are less extreme than gold.
double CalcLots(double eq, double riskPct, double slPips) {
   double pipVal = SymbolInfoDouble(TradeSymbol, SYMBOL_TRADE_TICK_VALUE);
   double pipValAdjust = StringFind(TradeSymbol, "GBPJPY") >= 0 ? 0.1 : 0.5;
   double riskAmt = MathMin(eq * (riskPct / 100), MaxLossUSD);
   double lots = (riskAmt / (slPips * pipVal)) * pipValAdjust;
   double minLot = SymbolInfoDouble(TradeSymbol, SYMBOL_VOLUME_MIN);
   double maxLot = MathMin(SymbolInfoDouble(TradeSymbol, SYMBOL_VOLUME_MAX), MaxLotSize);
   double freeMarg = AccountInfoDouble(ACCOUNT_MARGIN_FREE);
   while(lots > minLot && freeMarg < (SymbolInfoDouble(TradeSymbol, SYMBOL_MARGIN_INITIAL) * lots * 1.2)) {
      lots *= 0.8; // Reduce lot size iteratively
   }
   lots = NormalizeDouble(MathMax(minLot, MathMin(maxLot, lots)), 2);
   return lots;
}
Installation and backtesting: Compile on MetaEditor and attach to chart. Backtesting on GBPUSD/GBPJPY M15 (2025) with 2% risk.
Strategy testing
The indicator works optimally on any asset class due to its relatively quick moves detection for fast decision-making and adaptation to high volatility, which are beneficial for scalpers and retail intraday trading. We will test this indicator by trading GOLD from January 1, 2025, to April 1, 2025, on the 60-minute (H1) timeframe to show how it plots on the chart. Here are the parameters I have chosen for this strategy.


Strategy testing on UT Bot EA
The strategy works best on most, if not all, pairs due to its relatively quick adaptability to trends and high volatility, which are beneficial for retail intraday trading, especially scalping. We will test this strategy by trading GBPJPY and GBPUSD from January 1, 2025, to April 1, 2025, on the 15-minute (M15) timeframe. Here are the parameters I have chosen for this strategy.
GBPJPY
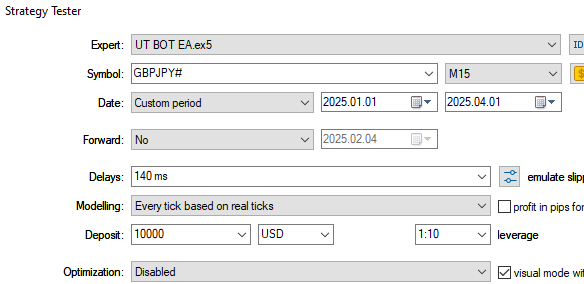
GBPUSD
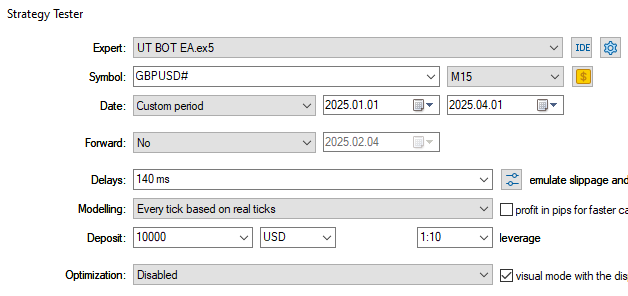
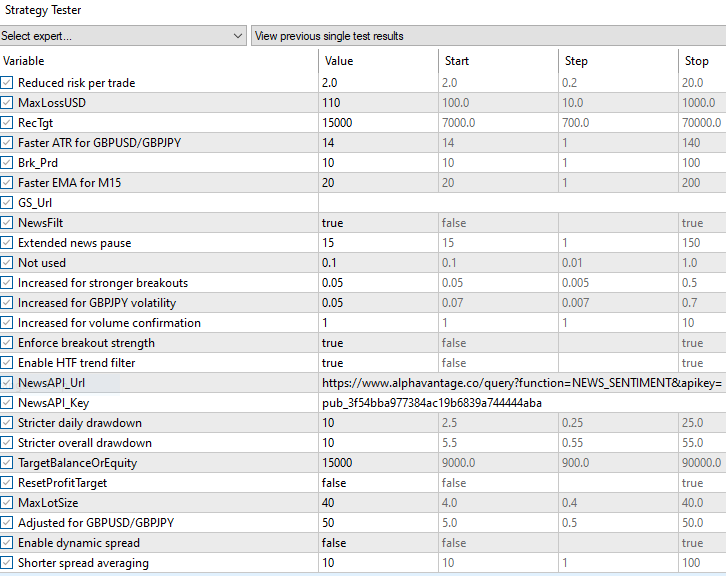
Strategy tester results
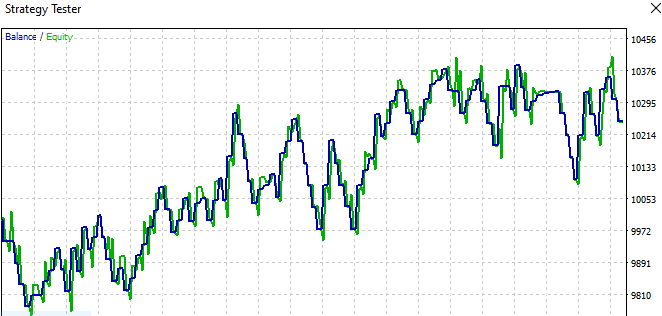
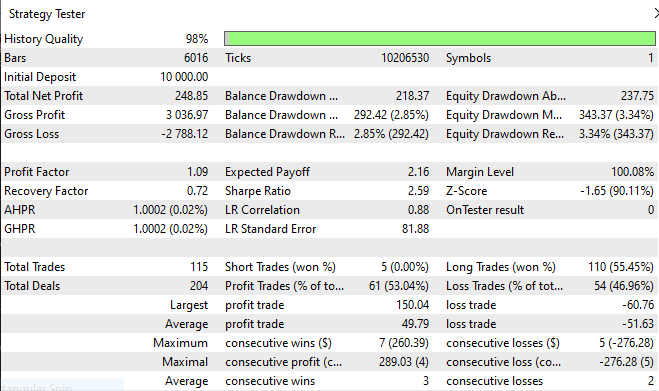
Upon testing on the strategy tester, here are the results of how it works, analyzes, and plots trade entry points using arrows and also stop-loss lines.
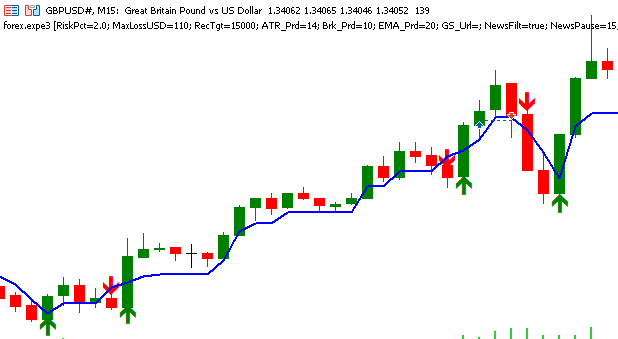
Fig.4 Signal and trailing stop plotting
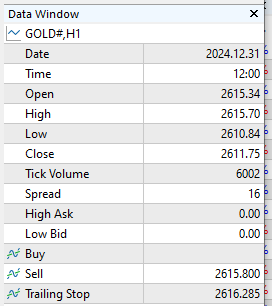
Strategy tester results on UT Bot EA
Balance/Equity graph: GBPJPY
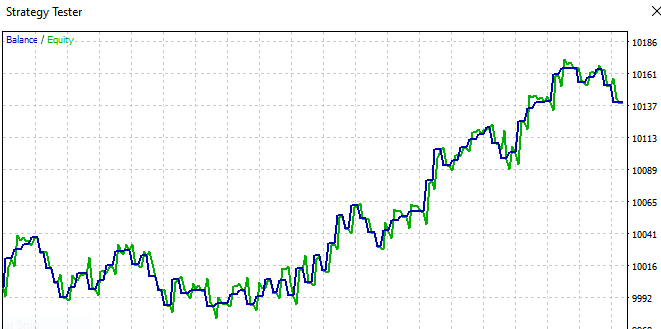
GBPUSD
Backtest results: GBPJPY
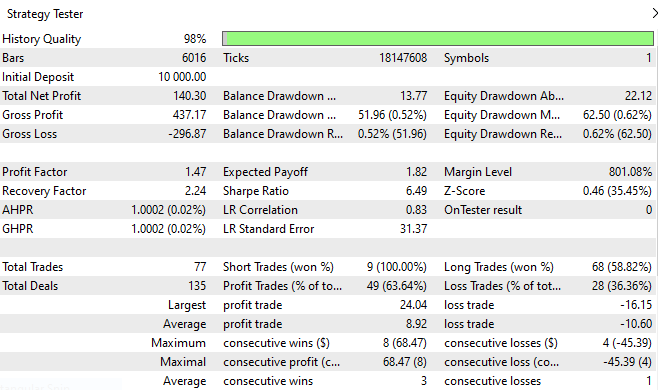
GBPUSD
Summary
I wrote this article to try to explain a MetaTrader 5 indicator that combines the use of average true range (ATR) and an exponential moving average to identify high-probability trading setups on GOLD and also possible exit points, which can either be profit-taking or stop-loss areas. This UT BOT indicator is one of the most valuable and revolutionary trading and signal-generating concepts used to capture possible trade price entries and trend shifts.
I tested the indicator on GOLD, GBPUSD, and GBPJPY, and it revealed its ability to detect possible trade entries efficiently and aptly on any time frame, but the trade entry point detection is only part of the equation because if there is no crossover on the moving average, the indicator does not recognize that as a possible trade entry or scenario, and then trades are not supposed to be executed there, even if there is a sudden spike in price. These moving average crossovers are confirmations that help improve trade accuracy and quality during volatile sessions.
To implement this indicator strategy, configure the input parameters on the indicator as shown below to get desirable results. The indicator is designed to scan for possible trade entries on any timeframe a trader selects to view, from M1 to MN, ensuring the possible trade entry points align with the trend and moving average crossover and the average true range. Interested users should backtest this indicator on their demo accounts with any asset or currency pair. The main agenda and goal for this indicator were to optimize it for quick, fast selections and high-probability setups that occur in lower time frames for scalpers and also incorporate risk management with the implemented trailing stops.
I would also advise users to regularly review performance logs to refine settings and input parameters depending on one's goals, asset class or risk appetite. Disclaimer: Anybody using this indicator should first test and start trading on his demo account to master this scalping idea approach for consistent profits before risking live funds.
Conclusion
The main takeaway and emphasis of this article is to try to clearly explain and solve issues that traders face daily while executing trades. This issue is such as self-doubt, analysis paralysis, and also the need to make quick, fast trade executions and decisions, where they occur, and when they occur. The article clearly states how UT BOT tries to solve this limitations and make the trading process seemingly easier and how it can be ideally used to analyze, understand, confirm, and even make trade executions utilizing its quick and assertive trade signal generation tool.
Most experts, beginner traders, and even some intermediate traders have no clue how to navigate this murky world of scalping and even get frustrated with the technique as they are unable to really grasp what is going on there or even don’t have the discerning eye to understand how price always moves and how it utilizes familiar patterns or moving averages to make classic trades and executions that can actually be profitable for them in the short-term view, which occurs frequently as opposed to long-term trading and position traders. Or even if they don't execute trades based on the indicator signals, traders will be able to validate their own trade ideas, positions, and setups and even the trend and direction regarding what I have shared in this article, and they will find it very interesting how the UT BOT can play a very vital role in signal generation.
By automating this signal-generating indicator with MQL5, traders reduce emotional bias, analysis paralysis, and self-doubt, enabling consistent execution of generated trade signals by this scalping strategy that also works very well for long-term/position trading.
All code referenced in the article is attached below. The following table describes all the source code files that accompany the article.
| File Name | Description |
|---|---|
| UT BOT.mq5 | File containing the full source code for the UT BOT indicator. |
| UT BOT EA.mq5 | File containing the full source code for the fully combined UT BOT EA. |
Warning: All rights to these materials are reserved by MetaQuotes Ltd. Copying or reprinting of these materials in whole or in part is prohibited.
This article was written by a user of the site and reflects their personal views. MetaQuotes Ltd is not responsible for the accuracy of the information presented, nor for any consequences resulting from the use of the solutions, strategies or recommendations described.
 Neural Networks in Trading: A Multimodal, Tool-Augmented Agent for Financial Markets (Final Part)
 Market Simulation (Part 04): Creating the C_Orders Class (I)
 Overcoming The Limitation of Machine Learning (Part 6): Effective Memory Cross Validation
 Introduction to MQL5 (Part 25): Building an EA that Trades with Chart Objects (II)
- Free trading apps
- Over 8,000 signals for copying
- Economic news for exploring financial markets
You agree to website policy and terms of use
Check out the new article: Mastering Quick Trades: Overcoming Execution Paralysis.
Author: Eugene Mmene
Extremely useful Eugene, great adaptation, primo confluence
Great article, ive built something quite similar with pinescript, im not that great with MQL5. I tried loading it up and testing on XAUUSD 1mTF and 15mTF but it doesnt seem to work on backtesting