

Creating a Cairo-Inspired Graphics Library for MetaTrader 5 (Part 1): Why the terminal needs its own 2D-renderer Contents
 918
918
 0
0

Content
- Introduction
- The problem every MQL5 interface hits
- Cairo: the library behind a surprising amount of software
- The drawing model, explained graphically
- A preview of what we are going to build
- Step 1 — one color representation
- Step 2 — a surface: pixels on a chart
- Step 3 — the light demo template
- Our first pixels
- Project structure
- The roadmap
- Conclusion, and what is in Part 2
Introduction
Modern trading interfaces demand more than a grid of rectangles: rounded cards, rings and donuts, semi-transparent layers, smooth gradients, and arbitrary polygons are all standard UI ingredients. MQL5's native chart objects and even the standard CCanvas fall short: corners are square, fills are hard-edged, there is no true alpha in object background colors, geometry is whole-number only, and object counts can quickly affect responsiveness. At the same time, we want to stay entirely inside the terminal—no DLLs, no external tools—and present the result as a single chart object.
This series takes a different route. Instead of inventing a new architecture, we borrow the compact, battle-tested design of Cairo. Its core idea—keeping geometry (paths) separate from paint (sources), then resolving them through a per-pixel coverage mask before compositing onto the destination—provides a common foundation for smooth, scalable rendering across different shapes. Over the coming parts, we will implement that model in pure MQL5, one small, verifiable step at a time.
Part 1 establishes the rendering foundation: a single ARGB color representation and a reusable pixel surface bound to one OBJ_BITMAP_LABEL . From there, the later parts will change how pixels are selected and painted, while the mechanism that delivers them to the chart remains the same.
The problem every MQL5 interface hits
Picture a panel design: rounded cards, a colored status pill, a progress ring, a small equity curve with a soft gradient under it. Nothing unusual. Now try to draw it in MQL5.
Native chart objects
OBJ_RECTANGLE_LABEL, OBJ_LABEL, OBJ_BUTTON, OBJ_EDIT. The terminal draws these for us, fast and with no rendering code on our side. For text and input fields they remain the right tool, and this series does not replace them.
For shapes, they run out almost immediately:
| What you want | Native objects |
|---|---|
| Rectangle | Yes |
| Rounded corners | No — square, always |
| Any polygon you like, in pixels | No |
| Smooth (anti-aliased) edge | No |
| Gradient fill | No |
| Semi-transparent fill | No — OBJPROP_BGCOLOR carries no alpha |
| Thick or styled border | No — a flat one-pixel outline |
| A ring, a donut, any hole at all | No |
There is a second problem, quieter but eventually important: object count. A native object is not a drawing. It is a terminal-owned entity with a name, properties, a hit-test region, and participation in every chart redraw. A forty-row table at six cells per row is already past five hundred objects, and responsiveness drops sharply well before you reach the terminal's own internal limits. Where exactly depends on the build, the machine and the redraw rate, so treat it as an observation rather than a documented threshold.
CCanvas
CCanvas, from the standard library, is a real step up and where most MQL5 GUI work starts. It gives you a pixel buffer, an ARGB format with a working alpha channel, a handful of primitives, and — the important one — a single chart object no matter how much you draw into it. This series uses the same output mechanism: ResourceCreate plus an OBJ_BITMAP_LABEL.
Where it stops:
- Fills have hard edges. This is the limitation that decides the whole question. FillPolygon, FillCircle and their relatives settle each pixel with a yes/no test: is the center of this pixel inside the shape? Every edge that is not horizontal or vertical becomes a staircase. The smoothed outline routines LineAA and PolygonAA paint a thin line on top of a shape; they cannot soften the fill's own boundary, and they cannot help at all when the shape sits on a transparent background — exactly the case for a floating panel with rounded corners.
- No rounded rectangles, so no modern card, chip, tab or button.
- No gradients.
- No fill rules, so no clean ring. A hollow circle is two FillCircle calls and a hope that the seam does not show.
- Whole-number coordinates only, so nothing can sit at x = 10.35. That rules out smooth animation and sub-pixel placement.
This does not make CCanvas a bad library. It targets a different problem space and does it well. For dashboards made of rectangles, text, and straight separators, it is the pragmatic choice and ships with the terminal; a custom renderer would be over-engineering. The case for our own starts where that list of exceptions starts.
So we build one
The third option is to write a real 2D renderer. The output still lands in an OBJ_BITMAP_LABEL; the whole difference is in how the pixels get decided. That is a smaller job than it sounds, as long as the architecture is right — and rather than invent one, we should borrow an architecture that has already survived twenty years of use.
Cairo: the library behind a surprising amount of software
Cairo is a 2D vector graphics library written in C, released in 2003 by Keith Packard and Carl Worth. It has since become one of the most widely installed pieces of graphics software anywhere, and most of the people who use it daily have never heard the name.
Where it is used
- GTK and the whole GNOME desktop. Every GTK widget you have ever clicked was painted by Cairo — by far its largest deployment.
- Inkscape, the SVG editor — an obvious fit, because Cairo's model and SVG's model are nearly the same thing.
- Poppler, the PDF renderer behind most Linux PDF viewers.
- Mozilla Firefox used Cairo as its rendering backend for years, and Matplotlib, WebKit, Scribus and a long tail of scientific and publishing software still do.
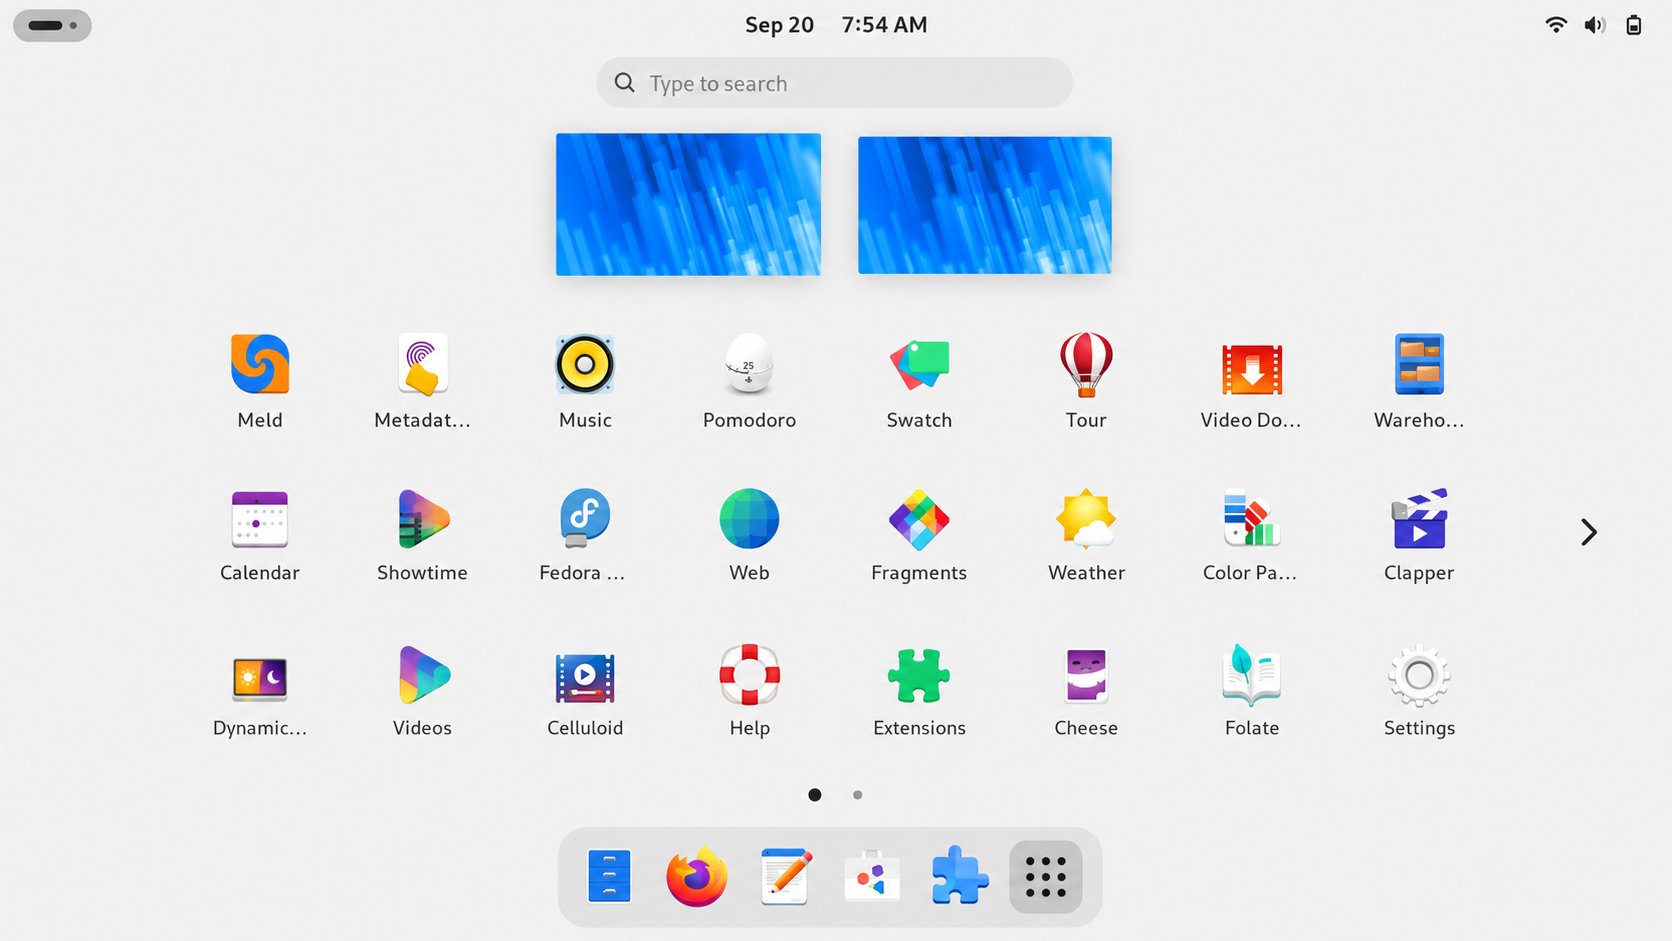
Figure 1. A GNOME desktop: every frame, icon and glyph rasterised by Cairo.
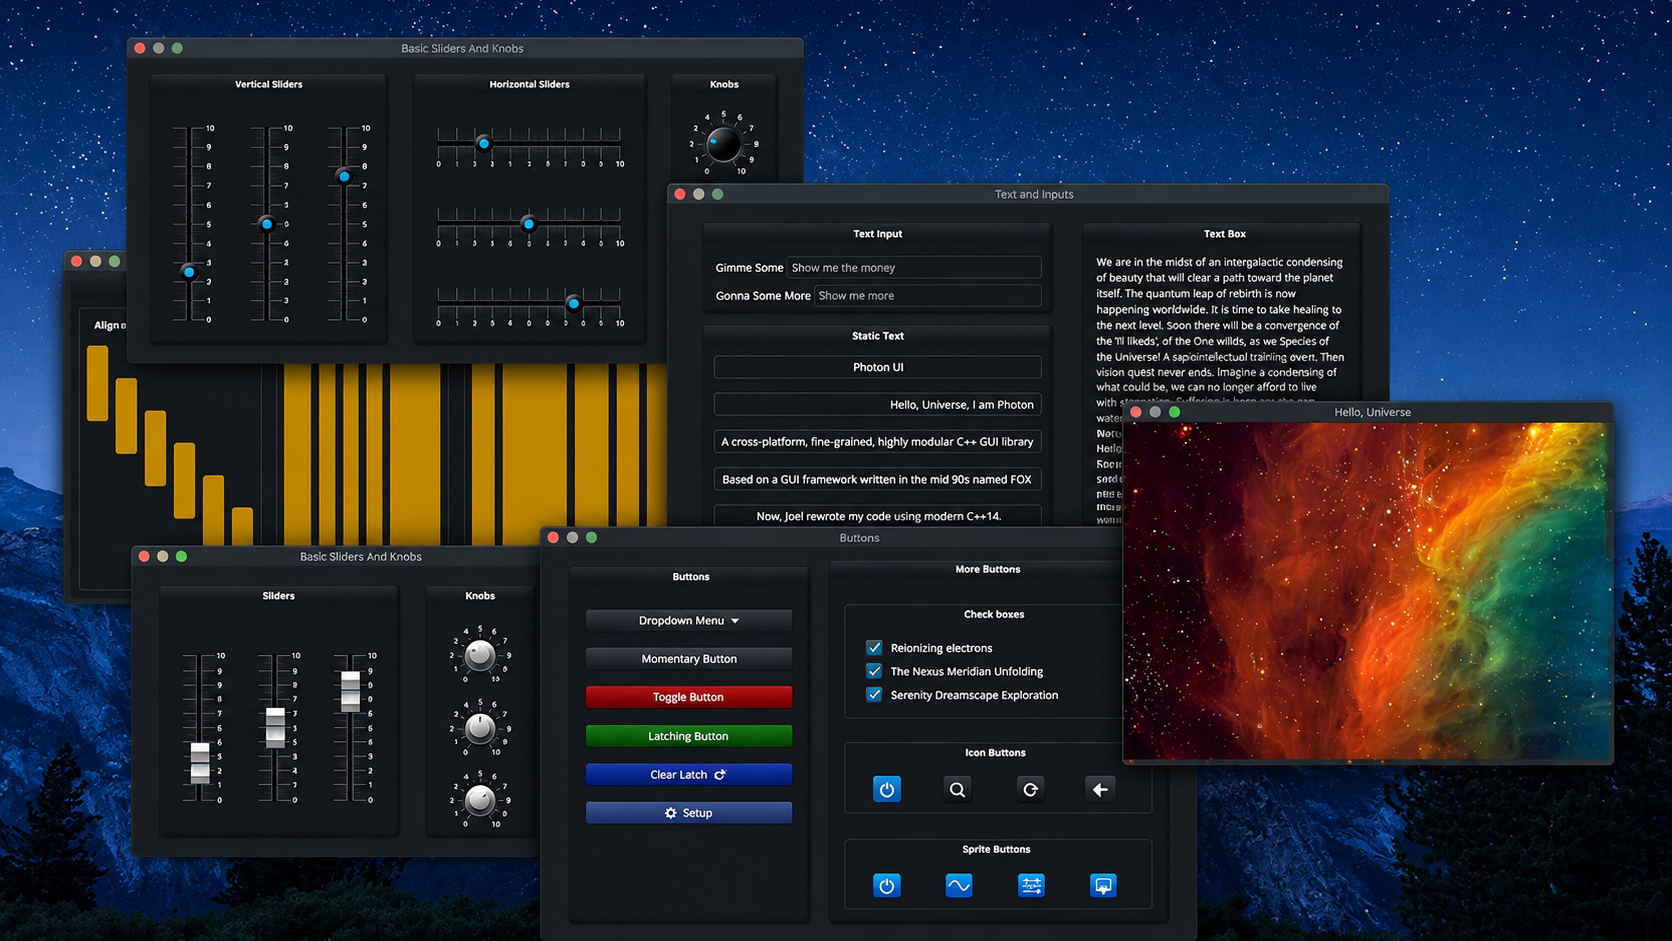
Figure 2. The Elements C++ GUI library, built on the same drawing model.
Why so many projects chose it
Four reasons, and every one of them applies to our situation in MetaTrader.
-
One drawing model, many outputs. Cairo keeps what to draw separate from where it goes. The same drawing code renders to an image in memory, to PDF, to SVG, or to a window; the backend picks the destination. That is why a GNOME application prints a document that looks the same on paper as on screen.
-
It works at any size. A drawing is stored as geometry rather than as pixels, so the same code is sharp at 16 pixels and at 1600 — which matters to us, because a trading panel should look right on a 1080p laptop and on a 4K monitor.
-
Quality without asking for it. Cairo smooths every edge, blends with a real alpha channel, and handles the awkward cases correctly: outlines that cross themselves, holes, translucent shapes stacked on each other. Getting those right is most of the work in a renderer, and most of the reason people abandon their own.
-
A very small set of ideas. This is the one that matters most to us. Cairo's whole API rests on about five concepts, and that is what keeps the core small. Here is a concrete figure: by the end of Part 7, the engine includes paths, edges, scanline filling, anti-aliasing, compositing, both fill rules, Bézier flattening, arcs, and rounded rectangles. Gradients, clipping and the widget layer will grow that; the model itself will not.
Is a software renderer not slow?
The obvious objection: Cairo's image backend does everything on the CPU, one pixel at a time. Surely that is too slow?
In practice, no, and the reason applies directly to a trading panel. GPU acceleration wins when you redraw everything sixty times a second. That is a game. A user interface is the opposite: it is still, almost all of the time. The useful question is not "how many pixels per second" but "how much does a change cost" — and a renderer that only touches the pixels a shape covers is adequate for interface work. Part 9 measures the claim.
The drawing model, explained graphically
Here is the model in Cairo's own terms. It is worth going slowly: every remaining article in this series is a detail hanging off this section.
The pen and the path
Imagine a pen on paper. There are three things you can do with it:
- move_to(x, y) — lift the pen and put it down somewhere else
- line_to(x, y) — drag the pen in a straight line to a new point
- close_path() — drag it back to where this stroke started
Do that a few times and you have traced an outline. That outline is a path, and it is pure geometry: no color, no thickness, no pixels. It is a recipe, not a drawing.
One path, one verb at a time
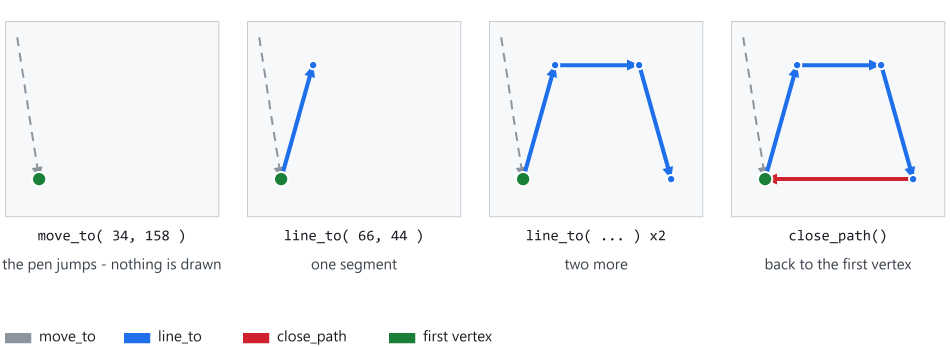
Figure 3. Building a path: move_to jumps, line_to draws, close_path closes.
Follow the arrows in Figure 3 in order and you have the whole idea. The detail worth noticing is the dotted arrow: a move_to leaves no trace. That is what lets one path contain several separate outlines — called contours — which is the trick that later gives us letters with holes in them, rings and donut charts, each as a single drawing operation.
Two more verbs extend this to everything else:
- curve_to(c1, c2, end) — drag the pen along a cubic Bézier curve, bending it towards two control points
- arc(cx, cy, r, a1, a2) — sweep the pen along a circular arc
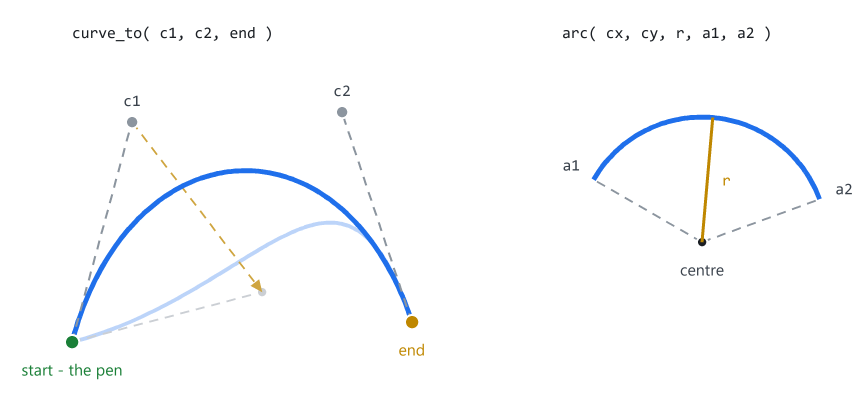
Figure 4. The curved verbs: curve_to bends to two handles, arc sweeps a circle
Figure 4 is the one to come back to in Part 6. The thing to take from it now is that the control points of a Bézier are not on the curve. They are magnets: moving one bends the curve towards it, which is why a designer shapes a curve by dragging handles instead of typing coordinates.
The source, the mask, and the destination
This is Cairo's central idea, and it is neater than it first looks. Cairo does not think "fill this shape with this color". It thinks in three layers:
- the source — an endless plane of color. It might be one flat color everywhere, or a gradient, or a repeating image.
- the mask — a stencil made from the path, saying how much of the source is allowed through at each pixel. Zero means none, one means all, and everything in between is allowed.
- the destination — the pixels that are already there.
Drawing is then one sentence: push the source through the mask, onto the destination.
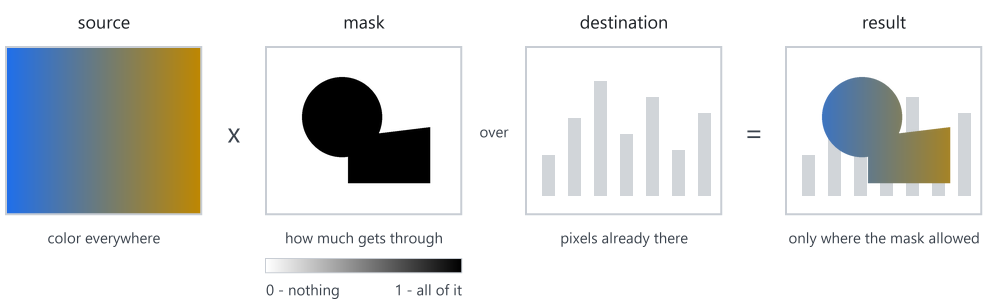
Figure 5. Source, mask and destination — the three layers of every drawing.
Figure 5 is an important diagram in this article, and what it buys us is independence. The mask does not care whether the source is a flat color or a photograph; the source does not care whether the mask is a rectangle or a font glyph. Add one new kind of source — a radial gradient, say — and every shape you have gains it, with no change to the shape code. That is the difference between a library that grows and one that ossifies.
We will build exactly this split: our mask is a per-pixel coverage value, and our source is a paint that answers one question — what color is at (x, y)?
Coverage: what anti-aliasing actually is
The mask is where anti-aliasing comes from. Start with the mismatch. A path is a mathematical outline with infinite precision — a line can pass through (12.3719…, 40.5). A screen is a grid of squares that can each hold one color. Scan conversion is the act of deciding what color each square should be, given an outline that pays no attention to the grid.
The yes/no way. Look at the exact center of the pixel. Is that point inside the outline? If yes, paint it; if no, leave it. The answer is 0 or 1, with nothing in between.
The measuring way. Ask instead: what fraction of this pixel's area lies inside the outline? Now the answer is a number between 0 and 1, and that number is the coverage.
Here it is with real values. Take a pixel the edge slices across, leaving 30% of its area inside. Its coverage is 0.30, and its final color is a mix 30% of the way from the background to the shape:
    shape color        = (31, 111, 235)     a blue
    background color   = (255, 255, 255)    white
    coverage            = 0.30

    red   = 255 + (31  - 255) * 0.30 = 187
    green = 255 + (111 - 255) * 0.30 = 212
    blue  = 255 + (235 - 255) * 0.30 = 249

    result = (187, 212, 249)                 a very pale blue
Do that for every pixel along the boundary and the staircase dissolves. The step that used to be a full pixel tall is spread over the two or three pixels next to it, each carrying a share of the color in proportion to how much of the shape it contains. That is all anti-aliasing is.
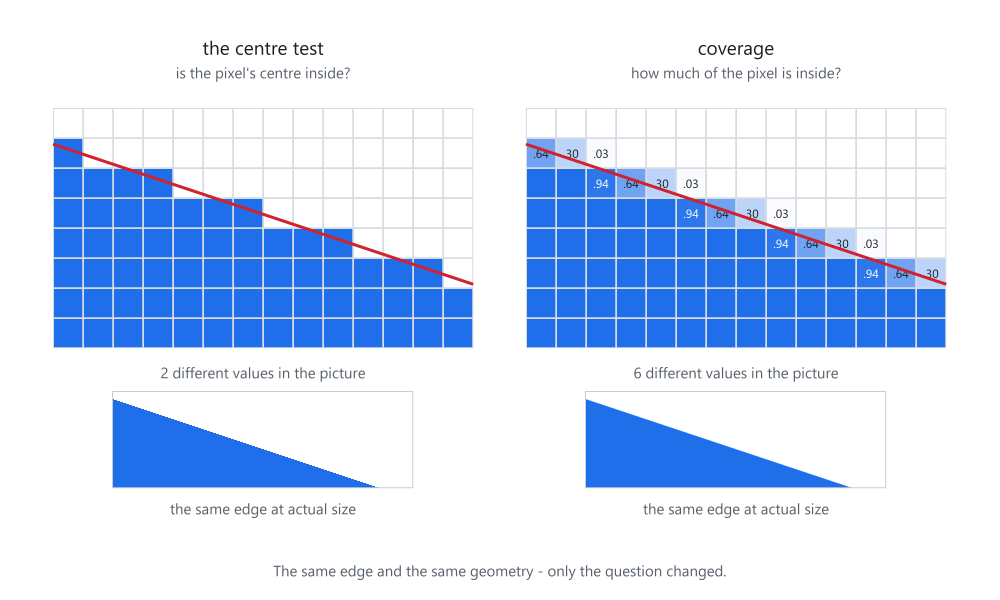
Figure 6. The same edge: a yes/no test on the left, coverage on the right.
Look at the boundary pixels in Figure 6, not the shape as a whole. On the left there are two values in the image; on the right perhaps a dozen, all along the edge, with the interior and exterior untouched.
Putting the model together 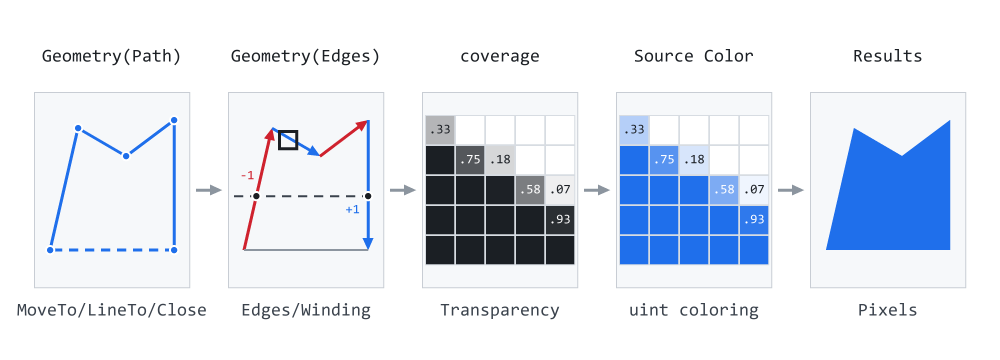
Figure 7. The pipeline, end to end: path, edges, coverage, paint, buffer.
Figure 7 is the map for the next nine articles. This is the key consequence, and the reason the design is worth copying: there is no per-shape rendering code. A rectangle, a circle, a star, a font glyph and a 2,000-edge SVG icon all reduce to the same thing — a list of straight segments — and travel through the same fill loop. Adding a shape means writing a small helper that produces segments; it never means touching the renderer.
A preview of what we are going to build
This is the only section of the series that jumps ahead. The two programs below use the finished library and are attached so you can see them today.
The comparison. Preview_ThreeWays draws the same three elements — a bordered panel, a five-pointed star and two overlapping translucent tiles — three times over: with native objects, with CCanvas, and with the finished engine. All three receive the same vertices for the star, so the comparison is about rendering, not about who drew a nicer star.
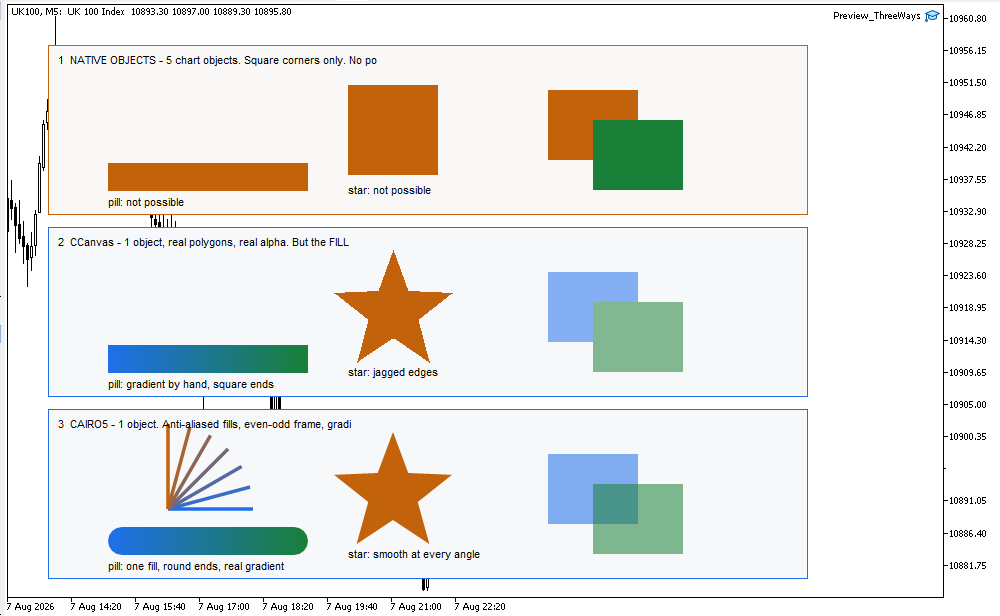
Figure 8. One drawing, three renderers: native objects, CCanvas, this engine.
At panel scale the edges are too small to judge, which is what Figure 9 is for.
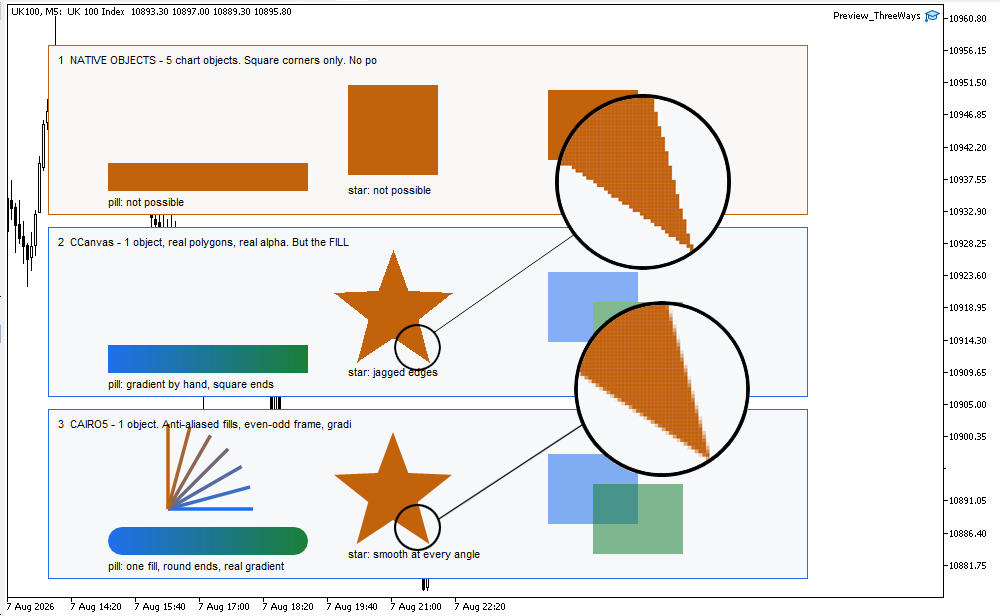
Figure 9. The star's arm magnified: CCanvas steps, the engine fades.
Figure 9 is the image to keep in mind while reading the series: everything from Part 3 to Part 5 exists to turn its left half into its right half. The magnification is nearest-neighbour, so those are the real pixels enlarged.
| Native objects | CCanvas | This series | |
|---|---|---|---|
| Chart objects used | 4 | 1 | 1 |
| Rounded corners | no | no | yes, per corner |
| Any polygon | no | yes | yes |
| Smooth fill edge | no | no | yes |
| Sub-pixel geometry | no | no | yes |
| Translucent overlap | no | yes | yes |
| Gradient | no | no | yes |
The destination. Showcase_Dashboard renders a complete trading dashboard — rounded cards, progress rings, a donut chart with a soft glow, an equity curve with a gradient under it, status pills, a bar chart — in one chart object.
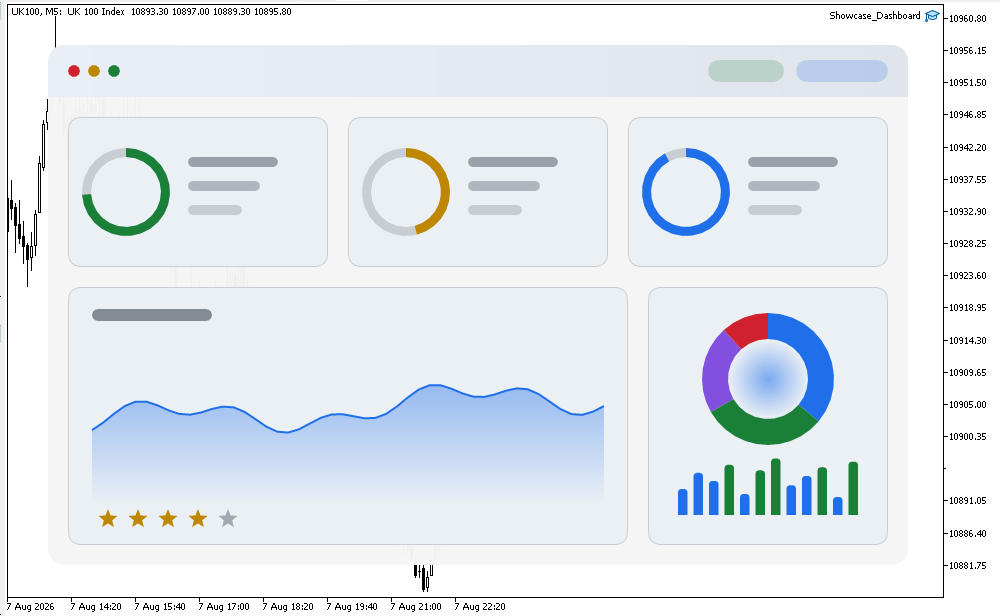
Figure 10. The end of the road: a full dashboard in one OBJ_BITMAP_LABEL.
Figure 10 belongs in Part 1 rather than Part 10 because it makes the budget concrete. Built from native objects, that panel would need several hundred of them and would still be missing the corners, the rings and the gradients. Built this way, the terminal holds one object.
Now let us go back to the start and write some code.
Step 1 — one color representation
Nearly every graphics bug I have chased in MQL5 traces back to color formats, so we settle the question first. The library uses one representation, everywhere:
uint 0xAARRGGBB
Alpha, red, green, blue — one byte each, in that order. 0xFF1F6FEB is alpha 255 (FF), red 31 (1F), green 111 (6F), blue 235 (EB).
This is exactly what ColorToARGB returns, and exactly the pixel layout ResourceCreate expects with COLOR_FORMAT_ARGB_NORMALIZE. A pixel therefore never has to be converted between our renderer and the terminal — not once, anywhere, in the entire series.
MQL5's built-in color type is not this. It is 0x00BBGGRR — blue, green, red, and no alpha at all. Mixing the two is the classic way to swap red and blue silently in a GUI, and it survives review because the code looks correct. The rule for this library: inside it a color is always a uint in ARGB order, and color is accepted only at the boundary.
Here is the top of Color.mqh — the include guard, the transparent constant, and the channel accessors:
#ifndef CAIRO5_COLOR_MQH
#define CAIRO5_COLOR_MQH

//--- A fully transparent color.
#define CAIRO_TRANSPARENT ((uint)0x00000000)

//+-------------------------------------------------------------------+
//| Channel accessors.                                                |
//+-------------------------------------------------------------------+
#define CAIRO_A(c) (((uint)(c) >> 24) & 0xFF)
#define CAIRO_R(c) (((uint)(c) >> 16) & 0xFF)
#define CAIRO_G(c) (((uint)(c) >>  8) & 0xFF)
#define CAIRO_B(c) (((uint)(c)      ) & 0xFF)
Each accessor shifts the byte it wants down to the bottom and masks off the rest: CAIRO_R(0xFF1F6FEB) shifts right by 16 and masks with 0xFF, giving 31.
They are #define macros rather than functions on purpose: from Part 4 they sit in the innermost loop and run once per composited pixel — nearly 300,000 times for one repaint of a 720×400 panel. Being careful about that claim, though: MQL5 does not give us C's control over inlining, and the dominant cost is at least as likely to be memory traffic. Macros are chosen because they are simple and their arguments have no side effects, not because the saving has been proven.
Next, the declarations. MQL5 does not require them for free functions in the same file, but listing them together shows the whole surface of the file in eight lines:
//+-------------------------------------------------------------------+
//| Free functions - declarations                                     |
//+-------------------------------------------------------------------+
uint  CairoArgb(const uint a, const uint r, const uint g, const uint b);
uint  CairoRgb(const uint r, const uint g, const uint b);
uint  CairoHex(const uint bgr, const uint alpha = 0xFF);
uint  CairoFromMql(const color clr, const uint alpha = 255);
color CairoToMql(const uint argb);
uint  CairoWithAlpha(const uint argb, const uint alpha);
uint  CairoWithOpacity(const uint argb, const double opacity);
uint  CairoLerp(const uint from, const uint to, const double t);
The two constructors are the reverse of the accessors — shift each channel up into its slot and combine them:
//+-------------------------------------------------------------------+
//| Pack a, r, g, b (each 0..255) into 0xAARRGGBB.                    |
//+-------------------------------------------------------------------+
uint CairoArgb(const uint a, const uint r, const uint g, const uint b)
  {
   return ((a & 0xFF) << 24) |
          ((r & 0xFF) << 16) |
          ((g & 0xFF) <<  8) |
          (b & 0xFF);
  }

//+-------------------------------------------------------------------+
//| Pack r, g, b as fully opaque. The everyday constructor.           |
//+-------------------------------------------------------------------+
uint CairoRgb(const uint r, const uint g, const uint b)
  {
   return CairoArgb(255, r, g, b);
  }
The & 0xFF on each argument is not decoration. The parameters are uint, so nothing stops a caller passing 300, and without the mask those extra bits would spill into the channel above and change a different component entirely.
One convenience worth explaining
CairoHex looks redundant until you have used it:
//+-------------------------------------------------------------------+
//| Take a literal written in MQL5 `color` (BGR) order plus an alpha, |
//| and return the library's 0xAARRGGBB.                              |
//+-------------------------------------------------------------------+
uint CairoHex(const uint bgr, const uint alpha = 0xFF)
  {
   const uint r = (bgr) & 0xFF;
   const uint g = (bgr >>  8) & 0xFF;
   const uint b = (bgr >> 16) & 0xFF;

   return CairoArgb(alpha, r, g, b);
  }
Read the body carefully and it looks wrong: it pulls the lowest byte out and calls it red. That is the point. MetaEditor draws its color square next to a 0x literal by reading it as an MQL5 color, which is BGR. Write the value in that order and the square shows the true color, while CairoHex swaps the bytes back — so you can pick colors by eye in the editor and still store correct ARGB:
CairoHex( 0x0000FF )         // editor square: red   -> we get red
CairoHex( 0xFF0000 )         // editor square: blue  -> we get blue
CairoHex( 0xF6823B, 0x33 )   // the same color at 20% alpha
Crossing the boundary
Two functions handle traffic between the library and MQL5's own color type. Everything else in the library refuses to deal with color at all:
//+-------------------------------------------------------------------+
//| Boundary conversion: MQL5 `color` (BGR) -> ARGB.                  |
//| Use this for anything arriving from an `input color` parameter.   |
//+-------------------------------------------------------------------+
uint CairoFromMql(const color clr, const uint alpha = 255)
  {
//--- ColorToARGB already performs the BGR -> RGB swap for us
   return ((alpha & 0xFF) << 24) | (ColorToARGB(clr, 255) & 0x00FFFFFF);
  }

//+-------------------------------------------------------------------+
//| Boundary conversion: ARGB -> MQL5 `color` (BGR). Alpha is lost.   |
//| Only needed when feeding a native chart object, which cannot      |
//| express alpha at all.                                             |
//+-------------------------------------------------------------------+
color CairoToMql(const uint argb)
  {
   return (color)((CAIRO_B(argb) << 16) |
                  (CAIRO_G(argb) <<  8) |
                  CAIRO_R(argb));
  }
CairoFromMql is what you call on an input color parameter; it leans on ColorToARGB for the byte swap, then substitutes our own alpha. CairoToMql goes the other way and loses the alpha channel, because a native chart object cannot express transparency. That loss is why the conversion is a named function rather than a cast: it should be visible in the code that it is happening.
Changing the alpha of a color//+-------------------------------------------------------------------+ //| Replace the alpha channel, keep the RGB. | //+-------------------------------------------------------------------+ uint CairoWithAlpha(const uint argb, const uint alpha) { return (argb & 0x00FFFFFF) | ((alpha & 0xFF) << 24); } //+-------------------------------------------------------------------+ //| Scale the EXISTING alpha by `opacity` (0.0 .. 1.0). | //+-------------------------------------------------------------------+ uint CairoWithOpacity(const uint argb, const double opacity) { double o = opacity; if(o < 0.0) o = 0.0; if(o > 1.0) o = 1.0; const uint a = (uint)(CAIRO_A(argb) * o + 0.5); return CairoWithAlpha(argb, a); }
The pair looks like duplication, but CairoWithAlphareplaces the alpha channel while CairoWithOpacityscales the alpha already there. Fade a half-transparent color to 50%: replacing returns it at 50%, which is more opaque than it started; scaling returns 25%. Global fades compose correctly only if the operation is multiplicative.
The + 0.5 before the cast is rounding. MQL5 truncates on conversion, so without it repeated fades drift steadily towards transparent.
And one piece of maths
CairoLerp interpolates between two colors, alpha included:
//+-------------------------------------------------------------------+
//| Linear interpolation between two colors, alpha included.          |
//| t = 0 returns `from`, t = 1 returns `to`.                         |
//+-------------------------------------------------------------------+
uint CairoLerp(const uint from, const uint to, const double t)
  {
   double k = t;

   if(k < 0.0)
      k = 0.0;
   if(k > 1.0)
      k = 1.0;

   const uint a = (uint)(CAIRO_A(from) +
                         (CAIRO_A(to) - (double)CAIRO_A(from)) * k + 0.5);
   const uint r = (uint)(CAIRO_R(from) +
                         (CAIRO_R(to) - (double)CAIRO_R(from)) * k + 0.5);
   const uint g = (uint)(CAIRO_G(from) +
                         (CAIRO_G(to) - (double)CAIRO_G(from)) * k + 0.5);
   const uint b = (uint)(CAIRO_B(from) +
                         (CAIRO_B(to) - (double)CAIRO_B(from)) * k + 0.5);

   return CairoArgb(a, r, g, b);
  }

#endif // CAIRO5_COLOR_MQH
Lerp is short for linear interpolation: from + (to - from) * k walks each channel separately, giving from at k = 0 and to at k = 1.
The cast to double in the middle of each line is doing real work. The accessors produce uint, and unsigned arithmetic does not go below zero — it wraps to about four billion. Any channel that decreases from from to to would produce a nonsense subtraction without it. This is the kind of bug that shows up as one gradient in five coming out fluorescent.
Every gradient in the finished library is built on this one function. What is deliberately missing is alpha compositing — blending a translucent color onto pixels already there. That shares its machinery with anti-aliasing, so both arrive in Part 4. Today we only overwrite pixels.
Step 2 — a surface: pixels on a chart
The second file is the bridge to MetaTrader. A surface owns three things:
- a uint array of pixels — our canvas,
- a dynamic resource holding a copy of them,
- one OBJ_BITMAP_LABEL on the chart, displaying that resource.
Here is the class, in full:
#ifndef CAIRO5_SURFACE_MQH
#define CAIRO5_SURFACE_MQH

#include "Color.mqh"

//+-------------------------------------------------------------------+
//| Build a name that is unique to one surface on one chart.          |
//+-------------------------------------------------------------------+
string CairoSurfaceName(const string base, const long chart_id = 0,
                        const int subwin = 0)
  {
   const long id = (chart_id == 0) ? ChartID() : chart_id;

   return StringFormat("g2d_%s_%I64u_%d", base, (ulong)id, subwin);
  }

//+-------------------------------------------------------------------+
//| CCairoSurface                                                     |
//+-------------------------------------------------------------------+
class CCairoSurface
  {
private:
   int               m_width;
   int               m_height;
   string            m_object;        // chart object name
   string            m_resource;      // dynamic resource name ("::something")
   long              m_chart;
   int               m_subwin;
   bool              m_created;
   bool              m_bound;         // is OBJPROP_BMPFILE already set?

   void              Reset();         // back to the constructed state

public:
   //-----------------------------------------------------------------
   //  THE PIXEL BUFFER IS PUBLIC, ON PURPOSE.
   //-----------------------------------------------------------------
   uint              m_px[];          // the ARGB pixel buffer, row-major

                     CCairoSurface();
                    ~CCairoSurface();

   //--- lifecycle
   bool              Create(const string name, const int x, const int y,
                            const int w, const int h,
                            const long chart_id = 0, const int subwin = 0);
   void              Destroy();

   //--- geometry and state
   int               Width()     { return m_width;  }
   int               Height()    { return m_height; }
   bool              IsCreated() { return m_created; }

   //--- drawing support
   void              Clear(const uint argb = CAIRO_TRANSPARENT);
   void              Move(const int x, const int y);

   //--- push the buffer to the chart
   bool              Flush(const bool redraw = true);
  };
One line in that declaration deserves a defence: m_px is public. MQL5 has no pointer-to-array type, so uint *Pixels() does not compile. The array has to be reached directly and passed by reference to the rasteriser we write in Part 3:
ras.Fill( path, color, surface.m_px, surface.Width(), surface.Height() );
This is the same choice the standard library makes with CCanvas::m_pixels. When the language will not let you hide something, hiding it badly is worse than leaving it visible.
The constructor and destructor are short. The destructor calls Destroy, so a surface declared as a global object cleans itself up even if the program exits through a path that forgot to:
//+-------------------------------------------------------------------+
//| Constructor                                                       |
//+-------------------------------------------------------------------+
CCairoSurface::CCairoSurface()
  {
   m_width   = 0;
   m_height  = 0;
   m_chart   = 0;
   m_subwin  = 0;
   m_created = false;
   m_bound   = false;
  }

//+-------------------------------------------------------------------+
//| Destructor                                                        |
//+-------------------------------------------------------------------+
CCairoSurface::~CCairoSurface()
  {
   Destroy();
  }
Create is mostly bookkeeping, but every line of it has a reason:
//+-------------------------------------------------------------------+
//| Allocate the buffer, create the chart object, and bind the two    |
//| together through a dynamic resource.                              |
//+-------------------------------------------------------------------+
bool CCairoSurface::Create(const string name, const int x, const int y,
                           const int w, const int h,
                           const long chart_id, const int subwin)
  {
   Destroy();

   if(w <= 0 || h <= 0 || name == "")
      return false;

   m_width    = w;
   m_height   = h;
   m_chart    = chart_id;
   m_subwin   = subwin;
   m_object   = name;
   m_resource = "::" + name;

//--- from here on, every failure has to undo what came before it.
//--- Reset() is enough while nothing exists on the chart yet; once
//--- the object is created, only Destroy() will do.
   if(ArrayResize(m_px, w * h) != w * h)
     {
      Reset();
      return false;
     }

   Clear();

   if(!ObjectCreate(m_chart, m_object, OBJ_BITMAP_LABEL, m_subwin, 0, 0))
     {
      Reset();
      return false;
     }

   ObjectSetInteger(m_chart, m_object, OBJPROP_CORNER,     CORNER_LEFT_UPPER);
   ObjectSetInteger(m_chart, m_object, OBJPROP_ANCHOR,     ANCHOR_LEFT_UPPER);
   ObjectSetInteger(m_chart, m_object, OBJPROP_XDISTANCE,  x);
   ObjectSetInteger(m_chart, m_object, OBJPROP_YDISTANCE,  y);
   ObjectSetInteger(m_chart, m_object, OBJPROP_XSIZE,      w);
   ObjectSetInteger(m_chart, m_object, OBJPROP_YSIZE,      h);
   ObjectSetInteger(m_chart, m_object, OBJPROP_BACK,       false);
   ObjectSetInteger(m_chart, m_object, OBJPROP_SELECTABLE, false);
   ObjectSetInteger(m_chart, m_object, OBJPROP_HIDDEN,     true);

//--- Flush() refuses to run on a surface that is not created, so the
//--- flag has to go up before the first upload rather than after it.
//--- If that upload fails we are in a half-built state, and the only
//--- honest answer is to tear the whole thing down again.
   m_created = true;

   if(!Flush(false))
     {
      Destroy();
      return false;
     }

   return true;
  }
Three lines in that function are worth naming:
- The leading "::" is what makes the name a dynamic resource — one living in memory inside the running EX5 rather than in a file on disk.
- ArrayResize allocates width × height entries, one uint per pixel — a little over a megabyte for a 720×400 panel.
- CORNER_LEFT_UPPER and ANCHOR_LEFT_UPPER position the bitmap in pixels from the top-left of the chart window, so the panel does not drift when the chart is scrolled.
- The final Flush( false ) uploads the blank buffer straight away, because an OBJ_BITMAP_LABEL whose resource does not yet exist shows nothing.
Destroy and the two small helpers:
//+-------------------------------------------------------------------+
//| Remove the chart object and release the resource.                 |
//+-------------------------------------------------------------------+
void CCairoSurface::Destroy()
  {
   if(m_created)
     {
      ObjectDelete(m_chart, m_object);

      if(m_resource != "")
         ResourceFree(m_resource);
     }

   Reset();
  }

//+-------------------------------------------------------------------+
//| Drop every field back to the constructed state, and give the      |
//| pixel memory back to the terminal.                                |
//+-------------------------------------------------------------------+
void CCairoSurface::Reset()
  {
   m_width    = 0;
   m_height   = 0;
   m_object   = "";
   m_resource = "";
   m_chart    = 0;
   m_subwin   = 0;
   m_created  = false;
   m_bound    = false;

   ArrayResize(m_px, 0);
  }

//+-------------------------------------------------------------------+
//| Fill the whole buffer with one value.                             |
//+-------------------------------------------------------------------+
void CCairoSurface::Clear(const uint argb)
  {
   ArrayFill(m_px, 0, ArraySize(m_px), argb);
  }

//+-------------------------------------------------------------------+
//| Move the bitmap on the chart. No repaint needed - the pixels are  |
//| unchanged, only the object's position is.                         |
//+-------------------------------------------------------------------+
void CCairoSurface::Move(const int x, const int y)
  {
   if(!m_created)
      return;

   ObjectSetInteger(m_chart, m_object, OBJPROP_XDISTANCE, x);
   ObjectSetInteger(m_chart, m_object, OBJPROP_YDISTANCE, y);
  }
Destroy calls ResourceFree as well as ObjectDelete; deleting the object alone would leave the pixel buffer alive inside the terminal, a leak that is easy to miss because nothing visible remains. Clear defaults to transparent rather than black, because a panel almost always wants the chart visible around its rounded corners. Move repositions the panel without touching a pixel or re-uploading anything, which will matter in Part 10.
The interesting function is the upload:
//+-------------------------------------------------------------------+
//| Upload the buffer to the terminal and point the object at it.     |
//|                                                                   |
//| ResourceCreate copies the array, so the buffer may be modified    |
//| again immediately afterwards.                                     |
//+-------------------------------------------------------------------+
bool CCairoSurface::Flush(const bool redraw)
  {
   if(!m_created)
      return false;

   if(!ResourceCreate(m_resource, m_px, m_width, m_height,
                      0, 0, 0, COLOR_FORMAT_ARGB_NORMALIZE))
      return false;

   if(!m_bound)
     {
      if(!ObjectSetString(m_chart, m_object, OBJPROP_BMPFILE, m_resource))
         return false;

      m_bound = true;
     }

   if(redraw)
      ChartRedraw(m_chart);

   return true;
  }

#endif // CAIRO5_SURFACE_MQH
The color format. COLOR_FORMAT_ARGB_NORMALIZE honors the alpha channel and expects straight, non-premultiplied pixels. Passing COLOR_FORMAT_XRGB_NOALPHA instead would silently discard every transparent pixel, and the panel would come out as an opaque rectangle with no error reported anywhere.
ResourceCreate copies the array, so the buffer may be modified again immediately — which is what makes double buffering unnecessary. The redraw is optional: ChartRedraw is the expensive call here, and a program flushing several surfaces wants to redraw once at the end.
Important: a dynamic resource is scoped to the EX5 program, not to a chart. Two copies of the same EA on two charts that both create "::panel" share one buffer, and whichever uploaded last wins on both. That is what CairoSurfaceName above exists to prevent.
Step 3 — the light demo template
Before the demo itself, one small file that is not part of the library at all. Every demo in this series shares a look: a light panel, dark text, and the trading colors everyone already knows. Neither reason for that is decoration.
So DemoTheme.mqh holds the palette, the chart setup and the caption helpers, in one file:
#ifndef CAIRO5_DEMOTHEME_MQH
#define CAIRO5_DEMOTHEME_MQH

//+-------------------------------------------------------------------+
//| 1. THE PALETTE                                                    |
//+-------------------------------------------------------------------+
#define DEMO_BG        ((uint)0xFFFFFFFF)   // panel background, plain white
#define DEMO_PANEL     ((uint)0xFFF6F8FA)   // a card inside the panel
#define DEMO_BORDER    ((uint)0xFFC8CDD4)   // 1 px frames and separators
#define DEMO_INK       ((uint)0xFF1B1F24)   // headings and anything that reads
#define DEMO_INK_SOFT  ((uint)0xFF57606A)   // secondary labels
#define DEMO_BLUE      ((uint)0xFF1F6FEB)   // positive / buy / the main accent
#define DEMO_GREEN     ((uint)0xFF1A7F37)   // positive, when blue is taken
#define DEMO_RED       ((uint)0xFFCF222E)   // negative / sell / fail
#define DEMO_AMBER     ((uint)0xFFBF8700)   // warning, threshold
#define DEMO_GREY      ((uint)0xFF8C959F)   // no data, disabled, invalid

//--- the caption font, kept in one place so every figure matches
#define DEMO_FONT      "Segoe UI"
#define DEMO_FONT_SIZE 9

#define DEMO_TAG       "g2d_demo_lbl_"

//+-------------------------------------------------------------------+
//| 2. THE CHART                                                      |
//|                                                                   |
//| Put the chart into the scheme the site asks for: white paper,     |
//| black ink, no grid, no volumes, no clutter. Call this once from   |
//| OnInit and the screenshot is already half composed.               |
//+-------------------------------------------------------------------+
void DemoUseLightChart(const long chart = 0)
  {
   ChartSetInteger(chart, CHART_COLOR_BACKGROUND,  clrWhite);
   ChartSetInteger(chart, CHART_COLOR_FOREGROUND,  clrBlack);
   ChartSetInteger(chart, CHART_COLOR_GRID,        clrWhite);
   ChartSetInteger(chart, CHART_COLOR_CHART_UP,    clrBlack);
   ChartSetInteger(chart, CHART_COLOR_CHART_DOWN,  clrBlack);
   ChartSetInteger(chart, CHART_COLOR_CHART_LINE,  clrBlack);
   ChartSetInteger(chart, CHART_COLOR_CANDLE_BULL, clrWhite);
   ChartSetInteger(chart, CHART_COLOR_CANDLE_BEAR, clrBlack);
   ChartSetInteger(chart, CHART_COLOR_BID,         clrWhite);
   ChartSetInteger(chart, CHART_COLOR_ASK,         clrWhite);
   ChartSetInteger(chart, CHART_COLOR_LAST,        clrWhite);
   ChartSetInteger(chart, CHART_COLOR_STOP_LEVEL,  clrWhite);

   ChartSetInteger(chart, CHART_SHOW_GRID,         false);
   ChartSetInteger(chart, CHART_SHOW_VOLUMES,      CHART_VOLUME_HIDE);
   ChartSetInteger(chart, CHART_SHOW_PERIOD_SEP,   false);
   ChartSetInteger(chart, CHART_SHOW_OBJECT_DESCR, false);
   ChartSetInteger(chart, CHART_SHOW_ONE_CLICK,    false);
   ChartSetInteger(chart, CHART_SHOW_TRADE_LEVELS, false);
  }

//+-------------------------------------------------------------------+
//| 3. CAPTIONS                                                       |
//+-------------------------------------------------------------------+
void DemoLabel(const string id, const int x, const int y, const string text,
               const uint argb = DEMO_INK, const int size = DEMO_FONT_SIZE,
               const long chart = 0)
  {
   const string name = DEMO_TAG + id;

   if(ObjectFind(chart, name) < 0)
      ObjectCreate(chart, name, OBJ_LABEL, 0, 0, 0);

//--- OBJ_LABEL takes an MQL5 `color`, which has no alpha channel,
//--- so we hand it the RGB part only
   const color clr = (color)(((argb) & 0xFF) << 16 |
                             ((argb >>  8) & 0xFF) <<  8 |
                             ((argb >> 16) & 0xFF));

   ObjectSetInteger(chart, name, OBJPROP_CORNER,     CORNER_LEFT_UPPER);
   ObjectSetInteger(chart, name, OBJPROP_ANCHOR,     ANCHOR_LEFT_UPPER);
   ObjectSetInteger(chart, name, OBJPROP_XDISTANCE,  x);
   ObjectSetInteger(chart, name, OBJPROP_YDISTANCE,  y);
   ObjectSetInteger(chart, name, OBJPROP_COLOR,      clr);
   ObjectSetInteger(chart, name, OBJPROP_FONTSIZE,   size);
   ObjectSetInteger(chart, name, OBJPROP_SELECTABLE, false);
   ObjectSetInteger(chart, name, OBJPROP_HIDDEN,     true);
   ObjectSetString(chart, name, OBJPROP_FONT,       DEMO_FONT);
   ObjectSetString(chart, name, OBJPROP_TEXT,       text);
  }

//+-------------------------------------------------------------------+
//| Remove every caption this file created.                           |
//+-------------------------------------------------------------------+
void DemoLabelsClear(const long chart = 0)
  {
   ObjectsDeleteAll(chart, DEMO_TAG, -1, -1);
  }

#endif // CAIRO5_DEMOTHEME_MQH
Our first pixels
We now have everything we need to put something on screen, and nothing else. No path, no rasteriser, not even a function to draw a rectangle. So Demo01_FirstPixels.mq5 writes every pixel by hand, starting with the includes, the geometry and the two switches:
#include <CairoG2D/Color.mqh>
#include <CairoG2D/Surface.mqh>
#include <CairoG2D/DemoTheme.mqh>

//--- panel geometry, in chart pixels from the upper-left corner
#define UI_X      40
#define UI_Y      40
#define UI_W     720
#define UI_H     400

//--- captions are annotation for the article figures, not drawing.
//--- Turn them off and the panel is still exactly one chart object.
input bool InpShowCaptions  = true;   // Draw the explanatory captions
input bool InpSetLightChart = true;   // Switch the chart to Black On White

CCairoSurface g_surface;
Then the one function everything else is built on:
//+-------------------------------------------------------------------+
//| Write one pixel, with bounds checking.                            |
//+-------------------------------------------------------------------+
void SetPixel(const int x, const int y, const uint argb)
  {
   if(x < 0 || y < 0 || x >= g_surface.Width() || y >= g_surface.Height())
      return;

   g_surface.m_px[ y * g_surface.Width() + x ] = argb;
  }
y * width + x— this single expression is the foundation of the raster graphics memory model, mapping a two-dimensional pixel coordinate (x, y)to its position in a linear memory buffer. The buffer is one long array laid out row by row, so pixel (0, 0) is at index 0 and pixel (0, 1) at index 720. Finding a pixel is arithmetic, not a search.
The bounds check is not optional. Without it a shape running off the right edge does not vanish — it reappears on the left of the next row down, producing a characteristic diagonal smear. Note also what SetPixel does not do: it overwrites. Blending with what is already there is alpha compositing, and it arrives in Part 4.
A. A rectangle, the honest way//+-------------------------------------------------------------------+ //| A. A SOLID RECTANGLE, THE HONEST WAY | //+-------------------------------------------------------------------+ void RectSolid(const int x, const int y, const int w, const int h, const uint argb) { for(int row = y; row < y + h; row++) for(int col = x; col < x + w; col++) SetPixel(col, row, argb); }
Two nested loops, no cleverness at all. Notice what is missing: any notion of a shape. The buffer does not know a rectangle was drawn, only that some pixels changed. Everything this library eventually does is a better answer to the question these two loops answer crudely: which pixels belong to the thing I am drawing? A one-pixel outline is four thin rectangles, because we have nothing better:
//+-------------------------------------------------------------------+
//| A one-pixel outline, drawn as four thin rectangles because we     |
//| have no better tool yet. In Part 5 this becomes a single path     |
//| filled with the even-odd rule.                                    |
//+-------------------------------------------------------------------+
void RectOutline(const int x, const int y, const int w, const int h,
                 const uint argb)
  {
   RectSolid(x,         y,         w, 1, argb);
   RectSolid(x,         y + h - 1, w, 1, argb);
   RectSolid(x,         y,         1, h, argb);
   RectSolid(x + w - 1, y,         1, h, argb);
  }
Keep that function in mind. In Part 5 it disappears entirely, replaced by one path with two contours and the even-odd fill rule — which also gives us borders of any thickness, rings and holes.
B. A gradient//+-------------------------------------------------------------------+ //| B. A VERTICAL GRADIENT | //+-------------------------------------------------------------------+ void RectGradient(const int x, const int y, const int w, const int h, const uint top, const uint bottom) { if(w <= 0 || h <= 0) return; //--- a one-row gradient has no distance to interpolate ACROSS, and //--- (h - 1) below would be zero. There is no sensible blend of two //--- colors over a single row, so the top color wins. if(h == 1) { RectSolid(x, y, w, 1, top); return; } for(int row = 0; row < h; row++) { const uint c = CairoLerp(top, bottom, (double)row / (h - 1)); for(int col = 0; col < w; col++) SetPixel(x + col, y + row, c); } }
The same two loops, but the color is worked out once per row. ( double )row / ( h - 1 ) walks from 0 at the top row to exactly 1 at the bottom — the - 1 is what makes the last row land on the end color — and the cast is required, or MQL5 does whole-number division and every row gets 0.
This is the seed of the source idea from Figure 5: the color of a pixel can be a function of its position. Right now that function is hard-coded inside the loop. In Part 8 it becomes an object with a name — a paint — and a flat color becomes the special case that returns the same answer everywhere.
C and D. The two shapes that motivate the rest of the series//+-------------------------------------------------------------------+ //| C. A DIAGONAL EDGE, DECIDED PIXEL BY PIXEL | //+-------------------------------------------------------------------+ void TriangleHardEdge(const int x, const int y, const int w, const int h, const uint argb) { if(w < 2 || h < 2) return; //--- rise over run, measured between the two corner pixel centers const double slope = (double)(h - 1) / (double)(w - 1); for(int row = 0; row < h; row++) { for(int col = 0; col < w; col++) { //--- the pixel's CENTER, which is what makes this a //--- yes/no test rather than a measurement const double px = col + 0.5; const double py = row + 0.5; //--- below the diagonal, so inside the lower-left triangle? if(py - 0.5 >= (px - 0.5) * slope) SetPixel(x + col, y + row, argb); } } }
The + 0.5 is the important part. A pixel is not a point; it is a little square. Pixel 7 covers x = 7 to x = 8, so its center is at 7.5. Testing the corner instead would shift the whole shape half a pixel up and to the left — invisible on a rectangle, very visible on a circle.
The box is wider than it is tall, on purpose. At 45 degrees the edge drops one pixel for every pixel sideways, and a one-pixel step reads as a fairly convincing straight line. The demo uses 200 by 68, a slope of about one in three, so the edge runs level for three pixels then drops a whole one. The gentler the angle, the uglier the staircase — which is why long, shallow lines such as an equity curve are where hard-edged rendering looks worst.
The diagonal is measured between pixel centers. That is where the - 0.5 terms come from, and why slope is (h - 1) / (w - 1). Written the obvious way as py >= px * h / w, the line would pass through the outer corners instead and the tip of the triangle would be sliced off.
The circle asks the same kind of question with different arithmetic:
//+-------------------------------------------------------------------+
//| D. A CIRCLE, ALSO PIXEL BY PIXEL                                  |
//+-------------------------------------------------------------------+
void CircleHardEdge(const int cx, const int cy, const int r,
                    const uint argb)
  {
   for(int row = cy - r; row <= cy + r; row++)
     {
      for(int col = cx - r; col <= cx + r; col++)
        {
         const double dx = (col + 0.5) - cx;
         const double dy = (row + 0.5) - cy;

         if(dx * dx + dy * dy <= (double)r * r)
            SetPixel(col, row, argb);
        }
     }
  }
The test is Pythagoras with the square root left off. Comparing dx² + dy² against r² gives the same answer as comparing distance against radius and skips a MathSqrt for every pixel in the bounding box — about 7,700 of them at radius 44. That trick turns up again in Part 7.
E. The alpha channel is real//+-------------------------------------------------------------------+ //| E. THE ALPHA CHANNEL IS REAL | //+-------------------------------------------------------------------+ void AlphaStrip(const int x, const int y, const int w, const int h) { //--- a chequerboard, so the transparency is visible against //--- something rather than guessed at for(int row = 0; row < h; row++) for(int col = 0; col < w; col++) { const bool dark = (((col / 10) + (row / 10)) % 2 == 0); SetPixel(x + col, y + row, dark ? CairoRgb(230, 233, 236) : DEMO_BG); } //--- eight swatches, from fully opaque down to fully transparent for(int i = 0; i < 8; i++) { const double opacity = 1.0 - i / 7.0; const uint c = CairoWithOpacity(DEMO_BLUE, opacity); RectSolid(x + 16 + i * 80, y + 16, 60, h - 32, c); } }
The swatches step from opacity 1.0 down to 0.0 in seven equal steps, and because CairoWithOpacityscales the existing alpha and DEMO_BLUE starts fully opaque, the eighth swatch really is completely invisible.
One distinction is worth stating plainly, because it is the thing most often got wrong: we are not blending anything. Each swatch is written into the buffer with a smaller number in its alpha byte, overwriting whatever was there. The blending happens elsewhere — the terminal does it when it composites our bitmap over the chart.
Composing the frame//+-------------------------------------------------------------------+ //| Compose the frame. | //+-------------------------------------------------------------------+ void Render() { //--- start from a plain white panel: the chart uses the standard //--- Black On White scheme, so the panel must not fight it g_surface.Clear(DEMO_BG); //--- A: five flat rectangles, in the roles every demo agrees on RectSolid(20, 30, 124, 56, DEMO_BLUE); RectSolid(154, 30, 124, 56, DEMO_GREEN); RectSolid(288, 30, 124, 56, DEMO_RED); RectSolid(422, 30, 124, 56, DEMO_AMBER); RectSolid(556, 30, 124, 56, DEMO_GREY); //--- B: a gradient, computed per row RectGradient(20, 130, 280, 88, DEMO_BG, DEMO_BLUE); RectOutline(20, 130, 280, 88, DEMO_BORDER); //--- C and D: hard-edged shapes - the problem to be solved. //--- The triangle is 200 x 68, a slope of about 1 in 3, so each //--- step of the staircase is three pixels long. TriangleHardEdge(330, 140, 200, 68, DEMO_BLUE); CircleHardEdge(610, 174, 44, DEMO_BLUE); //--- E: alpha AlphaStrip(20, 258, 660, 116); RectOutline(20, 258, 660, 116, DEMO_BORDER); //--- a frame around the whole panel, so it reads as one card RectOutline(0, 0, UI_W, UI_H, DEMO_BORDER); //--- one upload: the terminal is left holding ONE object g_surface.Flush(); }
Every drawing call in that function writes into memory. Exactly one line — the final Flush — touches the terminal.
The captions are set out separately, positioned by adding the panel origin to a panel-relative coordinate, so each label always follows its region:
//+-------------------------------------------------------------------+
//| The captions. Positions are panel coordinates plus the panel      |
//| origin, so a caption always sits where its region is.             |
//+-------------------------------------------------------------------+
void Captions()
  {
   DemoLabel("a", UI_X +  20, UI_Y +  10,
             "A. Solid fill - one color written into every pixel");

   DemoLabel("a1", UI_X +  20, UI_Y +  90, "BLUE / buy",    DEMO_INK_SOFT, 8);
   DemoLabel("a2", UI_X + 154, UI_Y +  90, "GREEN / pass",  DEMO_INK_SOFT, 8);
   DemoLabel("a3", UI_X + 288, UI_Y +  90, "RED / sell",    DEMO_INK_SOFT, 8);
   DemoLabel("a4", UI_X + 422, UI_Y +  90, "AMBER / limit", DEMO_INK_SOFT, 8);
   DemoLabel("a5", UI_X + 556, UI_Y +  90, "GREY / no data", DEMO_INK_SOFT, 8);

   DemoLabel("b", UI_X +  20, UI_Y + 112,
             "B. Color as a function of position");
   DemoLabel("c", UI_X + 330, UI_Y + 112, "C. Triangle, slope 1 in 3");
   DemoLabel("d", UI_X + 566, UI_Y + 112, "D. Circle");

   DemoLabel("cd", UI_X + 330, UI_Y + 228,
             "both edges decided by a yes/no test - look for the steps",
             DEMO_INK_SOFT, 8);

   DemoLabel("e", UI_X +  20, UI_Y + 238,
             "E. Real transparency - 100% opaque on the left, 0% on the right");
  }
And the three event handlers that hold it together:
//+-------------------------------------------------------------------+
//| Expert initialization function                                    |
//+-------------------------------------------------------------------+
int OnInit()
  {
   if(InpSetLightChart)
      DemoUseLightChart();

//--- NOT a bare "demo01". A dynamic resource belongs to the PROGRAM,
//--- not to the chart, so two copies of this EA on two charts would
//--- otherwise fight over one buffer. CairoSurfaceName folds the
//--- chart id and the subwindow in for us.
   const string surface = CairoSurfaceName("demo01");

   if(!g_surface.Create(surface, UI_X, UI_Y, UI_W, UI_H))
     {
      Print("Cairo G2D: failed to create the surface");
      return INIT_FAILED;
     }

//--- GetMicrosecondCount, never GetTickCount: the latter has a
//--- 15.625 ms resolution on Windows and would report this entire
//--- frame as either 0 ms or 15 ms, which tells you nothing
   const ulong t0 = GetMicrosecondCount();

   Render();

   const ulong t1 = GetMicrosecondCount();

   if(InpShowCaptions)
      Captions();

   ChartRedraw();

   PrintFormat("Cairo G2D Part 1: %d x %d = %d pixels written in %d us, "
               "using %d chart object for the drawing",
               UI_W, UI_H, UI_W * UI_H, (int)(t1 - t0), 1);

   return INIT_SUCCEEDED;
  }

//+-------------------------------------------------------------------+
//| Expert deinitialization function                                  |
//+-------------------------------------------------------------------+
void OnDeinit(const int reason)
  {
   g_surface.Destroy();
   DemoLabelsClear();
   ChartRedraw();
  }

//+-------------------------------------------------------------------+
//| Expert tick function                                              |
//+-------------------------------------------------------------------+
void OnTick()
  {
  }
//+-------------------------------------------------------------------+
The timing uses GetMicrosecondCount rather than GetTickCount: on Windows the latter advances in steps of about 15.6 milliseconds, so a frame taking two milliseconds would be reported as either 0 or 15, and neither means anything.
What the demo shows
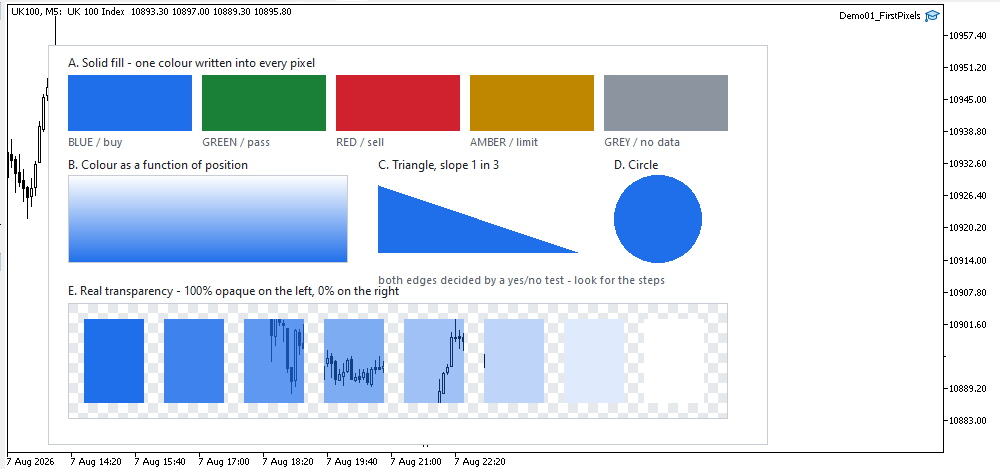
Figure 11. Demo01_FirstPixels on a Black On White chart: regions A to E.
Figure 11 is the context shot — this really is running in MetaTrader, on a normal chart, with the panel in front of the candles. At this size you cannot judge the edges, and you are not meant to.
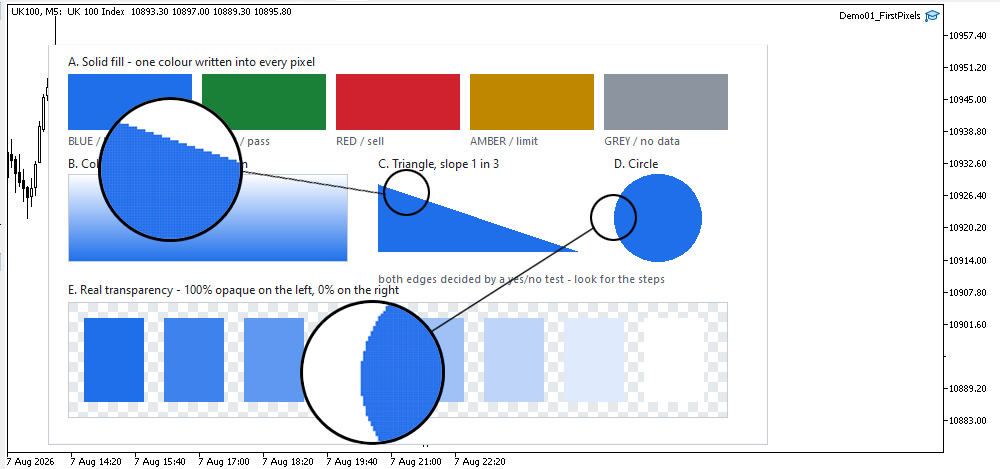
Figure 12. Triangle and circle enlarged: every pixel is fully on or fully off.
Figure 12 is the picture the series tries to change. Compare it with Figure 6 — its left half and the whole of Figure 12 are the same thing, one drawn as a diagram and one produced by real code — and then with Figure 9, which is where we are going. First, the edges are staircases: the yes/no test has no middle ground, so neither does the picture, and Part 4 replaces it with the measuring question.
Second — and this is the structural lesson — those two functions share nothing. Not one line. TriangleHardEdge and CircleHardEdge have different loops, different bounds and different tests, and neither could help draw the other. A rounded rectangle would need a third function, an ellipse a fourth, each with its own boundary bugs. That is the trap the Cairo model avoids, and in Part 3 we replace all of them with one function that fills any outline whatsoever.
The alpha strip in region E makes one more point: each swatch is stored with a smaller alpha and the chequerboard shows through — something no OBJ_RECTANGLE_LABEL can do at any setting, because OBJPROP_BGCOLOR has nowhere to put an alpha value.
Project structure
Everything for this part is in the attached archive. Unpack it into your terminal's MQL5/ folder keeping the structure as it is, and compile Demo01_FirstPixels.mq5. No paths need editing.
MQL5/
├── Include/
│   └── CairoG2D/
│       ├── Color.mqh          // the ARGB color type
│       ├── Surface.mqh        // pixel buffer bound to one chart object
│       └── DemoTheme.mqh      // the demos' shared palette - NOT library code
└── Experts/
    └── CairoG2D/
        └── Article 01/
            └── Demo01_FirstPixels.mq5
The same layout is used by every part of the series: the library lives in Include/CairoG2D/ and grows as we build it, and each part's demo gets its own folder under Experts/CairoG2D/. The include paths never change from one part to the next.
| # | File | Directory | What it holds |
|---|---|---|---|
| 1 | Color.mqh | MQL5/Include/CairoG2D | the ARGB color type, constructors, interpolation |
| 2 | Surface.mqh | MQL5/Include/CairoG2D | CCairoSurface — pixel buffer to chart bitmap |
| 3 | DemoTheme.mqh | MQL5/Include/CairoG2D | palette, chart setup, captions — not library code |
| 4 | Demo01_FirstPixels.mq5 | MQL5/Experts/CairoG2D/Article 01/ | every pixel written by hand |
| 5 | Cairo Style Library - Part 01.zip | archive containing all the attached files and their paths relative to the terminal's root folder. |
Note: the two programs Preview_ThreeWays and Showcase_Dashboard are included only as previews of the finished library. They are not what Part 1 builds. We return to them once the series has reached the features they use.
Zip Archive: You can download the codes using the attached .zip file.
The roadmap
Here is the whole series, so you know where each piece fits.
| Part | Subject | What the engine can do afterwards |
|---|---|---|
| 1 | Why, Cairo's model, color and surface | put hand-written pixels on a chart |
| 2 | Points, contours and the path | describe geometry: MoveTo, LineTo, Close, contours |
| 3 | Edges and the first filled shape | fill any outline — solid, jagged, one function |
| 4 | Anti-aliasing: coverage instead of yes/no | smooth edges at any angle, alpha compositing |
| 5 | Fill rules: holes, rings and borders | true frames, donuts, and strokes built from fills |
| 6 | Curves | CurveTo, adaptive flattening, QuadTo |
| 7 | Arcs, circles and rounded rectangles | the shapes an interface is actually made of |
| 8 | Paint: from solid colors to gradients | linear and radial gradients on every shape |
| 9 | Performance | clipping, the active edge table, benchmarks |
| 10 | A widget toolkit | panels, buttons, tables, icons — a real dashboard |
Conclusion, and what is in Part 2
What this part delivers is a concrete, reusable foundation you can run and extend immediately.
- A single in‑library color format: 0xAARRGGBB (Alpha, Red, Green, Blue) and helpers for conversion, alpha manipulation and interpolation (Color.mqh). This is the contract the engine honors throughout.
- A Surface abstraction that owns an ARGB pixel buffer, a dynamic in‑memory resource and exactly one OBJ_BITMAP_LABEL on the chart (Surface.mqh). The surface uploads the buffer once per frame, so the terminal sees one object regardless of how much you draw.
- A runnable demo (Demo01_FirstPixels) that writes every pixel by hand, proves alpha is preserved, and exposes the jagged edges that the rest of the series exists to fix.
Practically: you now control each pixel and its alpha on a real chart while remaining entirely inside MQL5. The current renderer simply overwrites pixels — anti‑aliasing, compositing and generic shape filling are deliberately left for the next steps. In Part 2 we build the first engine piece that matters: the path. We will define points (with double precision), implement MoveTo()/LineTo()/Close(), support multiple contours in one path, and add simple shape helpers so you can see geometry before we fill it in Part 3.
The project is supported on MQL5 Algo Forge. Each part of this series has its own release, frozen at exactly the code that part explains, so whichever article you are reading, its release is the one to download.
Part 1 is here: https://forge.mql5.io/SandroBegashvil/CairoG2D/releases/tag/part-01
Warning: All rights to these materials are reserved by MetaQuotes Ltd. Copying or reprinting of these materials in whole or in part is prohibited.
This article was written by a user of the site and reflects their personal views. MetaQuotes Ltd is not responsible for the accuracy of the information presented, nor for any consequences resulting from the use of the solutions, strategies or recommendations described.

 Price Action Analysis Toolkit Development (Part 80): Building a History Navigator for MetaTrader 5
 Neural Networks in Trading: An End-to-End Multivariate Time Series Forecasting Model (Conclusion)
 Building a Hull Moving Average Momentum Oscillator in MQL5
 Dendritic Cell Algorithm (DCA)

- Free trading apps
- Over 8,000 signals for copying
- Economic news for exploring financial markets
You agree to website policy and terms of use