

Building a Hull Moving Average Momentum Oscillator in MQL5
 2 531
2 531
 0
0

Introduction
Momentum indicators are widely used to evaluate the strength and direction of price movements, but raw momentum values often contain short-term fluctuations that can make changes in momentum difficult to interpret. This article demonstrates how to build a Hull Moving Average Momentum Indicator in MQL5 by combining a traditional momentum calculation with Hull Moving Average smoothing to produce a more responsive and smoother oscillator.
The indicator can help track momentum behavior and reduce short-term fluctuations in the momentum series. It can also provide directional information for discretionary analysis or as part of a broader trading strategy. To achieve this, we will calculate the momentum series and smooth it with the Hull Moving Average. We will then visualize the result with a color-coded oscillator and zero-line filling and implement the indicator step by step in MQL5. We will also discuss behavior around the zero line and limitations in flat market conditions.
Project Overview and Implementation Plan
Developing an indicator becomes much easier when its calculation process is understood before implementation begins. Rather than writing code immediately, we will first examine how the Hull Moving Average Momentum Indicator processes momentum data, applies smoothing, and produces its final output. This section presents the overall design and the implementation plan that will guide the development process.
What We Are Building
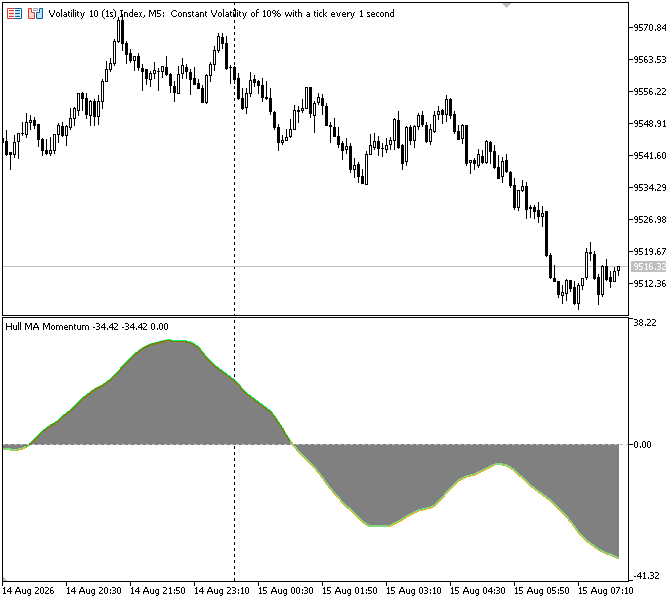
In this project, we will develop a custom momentum indicator that combines traditional momentum calculation with Hull Moving Average smoothing to produce a smoother momentum series. Instead of displaying raw momentum values that may fluctuate significantly with short-term price changes, the indicator applies the Hull Moving Average algorithm to reduce these fluctuations while maintaining sensitivity to changes in price movement. By analyzing the position of the smoothed momentum values relative to the zero level, the indicator helps identify positive and negative momentum conditions.
To improve visual interpretation, the indicator displays a color-coded momentum line with a consistent gray filling between the oscillator and the zero level. These components provide a clearer view of momentum conditions around the zero level, making the indicator useful for momentum analysis and as an additional analytical component when developing broader trading strategies.
Implementation Plan
Before we start writing the MQL5 code, let’s examine the steps required to calculate, smooth, and display the Hull Moving Average Momentum Indicator.
1. Setting up the Indicator Structure and Buffers
Before calculating the momentum values, we first need to define the basic structure of the indicator and prepare the required buffers for storing calculation results and visual elements. The implementation begins by defining the indicator framework: the display layout, the plots, and the buffers for calculation and display data.
During this step, we will:
- define the indicator properties, including the separate window display mode, number of buffers, and the required graphical plots for the momentum line and filling area;
- create the necessary buffers to store the smoothed momentum values, color information, filling boundaries, zero reference level, raw momentum values, and intermediate calculations required for the Hull Moving Average;
- organize the buffers according to their purpose, separating displayed data from internal calculation values to ensure efficient indicator operation;
- configure the indicator display settings, including the zero reference level, indicator name, precision, and colors used to distinguish positive and negative momentum conditions;
- prepare the visual components that will allow the indicator to display a color-changing momentum line and a consistent gray filling area around the zero level.
2. Configuring Indicator Inputs, Warm-Up Handling, and Recalculation Logic
After setting up the indicator structure and buffers, we configure the input parameters and calculation settings that control how the Hull Moving Average Momentum Indicator operates.
This includes:
- input parameters that allow users to adjust the momentum calculation length, smoothing period, visual colors, and historical calculation range;
- validation conditions that ensure enough historical data is available before performing the indicator calculations;
- subwindow detection to identify the indicator's own display area within the MetaTrader 5 chart;
- calculation period settings that determine the number of bars processed during the first calculation and subsequent updates;
- initialization handling that prepares the indicator buffers and prevents invalid values from being displayed before sufficient data is available.
3. Calculating Raw Momentum
After configuring the indicator inputs and calculation parameters, the next step is to calculate the raw momentum values that will be used as the foundation for the Hull Moving Average smoothing process. The purpose of this calculation is to measure the difference between the current closing price and the closing price from a selected number of periods in the past.
The raw momentum value is calculated by comparing the current candle's closing price with the closing price from InpLength bars ago. The resulting momentum value indicates the direction of the net price movement over the selected momentum period. Values below zero indicate that the current closing price is lower than the closing price of InpLength bars ago, whereas values above zero indicate that the current closing price is higher. Let's take an example where InpLength is set to 50 candles, the most recent closing price is 1.2500, and the closing price was 1.2400 fifty candles earlier. The resulting momentum value is calculated as:
Momentum = 1.2500 - 1.2400 = 0.0100
A price increase over the selected momentum period produces a positive momentum value. Conversely, if the current closing price is lower than the price recorded in InpLength bars ago, for example, 1.2300 compared with 1.2400 when InpLength is 50, the calculation produces a negative momentum value as follows:
Momentum = 1.2300 - 1.2400 = -0.0100
This negative value indicates that the price has moved downward compared to the previous period.
4. Implementing the Weighted Moving Average Calculation
With the raw momentum values prepared, the next stage focuses on creating a function to calculate the Weighted Moving Average (WMA). Since the same averaging process is required at different stages of the Hull Moving Average, we will develop a separate function that performs the WMA calculation using a specified data array, smoothing period, and ending index. This approach keeps the code organized and allows the function to be reused for calculating both the Fast WMA and Slow WMA components. While SMA treats all values equally, WMA prioritizes recent momentum values, helping the indicator capture new market movements more effectively.
The Hull Moving Average uses multiple Weighted Moving Average calculations. To construct the Hull Moving Average, the indicator calculates two WMA values with different periods. The shorter FWMA period improves responsiveness by capturing recent momentum changes, whereas the longer SWMA period reduces noise and represents the broader momentum trend. These two weighted averages will later be combined to generate the intermediate values required by the Hull Moving Average algorithm.The Fast Weighted Moving Average is calculated using the following formula:
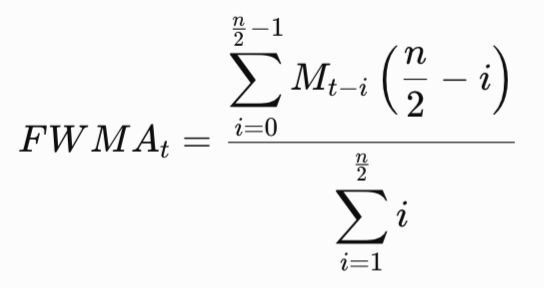
Figure 2. Fast Weighted MA
Similarly, the Slow Weighted Moving Average is calculated over the full smoothing period using the following formula:
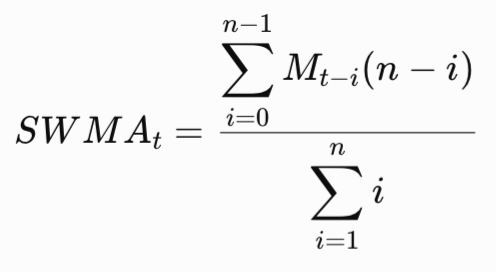
Figure 3. Slow Weighted MA
5. Calculating and Visualizing the Hull Moving Average Momentum
The next step is to combine these components to create the Hull Moving Average (HMA). The Hull Moving Average is designed to reduce lag while maintaining smoothness by combining two Weighted Moving Averages and applying an additional smoothing stage. To achieve this, we will create a dedicated function that calculates the Hull Moving Average from the raw momentum values using the Weighted Moving Average function developed in the previous step.
The Hull Moving Average begins by calculating a faster and slower Weighted Moving Average. The fast version uses a shorter period to capture recent momentum changes, while the slow version uses the full smoothing period to maintain stability. The difference between these two values is then calculated by multiplying the FWMA by two and removing the influence of the SWMA. This removes some of the lag introduced by traditional moving averages and creates an intermediate Hull Moving Average value.
The intermediate Hull Moving Average value is calculated using the following formula:

Figure 4. Raw HMA
After calculating the intermediate value, a final Weighted Moving Average is applied using the square root of the selected smoothing period. This additional smoothing stage produces the final Hull Moving Average momentum value used by the indicator. The complete Hull Moving Average momentum calculation can be represented by the following formula:
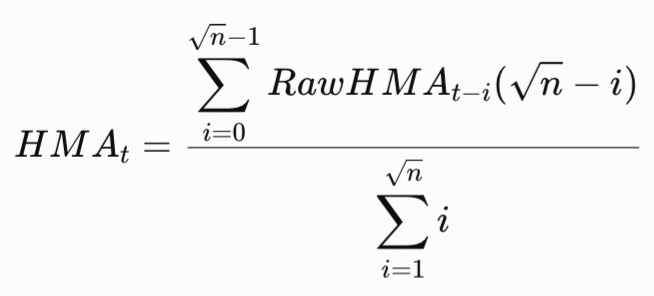
Figure 5. Final HMA
In the MQL5 implementation, MathRound() is used to convert the half-period and square-root period into integer values required by the WMA function. This rounding is an implementation choice.
Implementation in MQL5
Following the previously defined implementation plan, we will now create the Hull Moving Average Momentum Indicator in MQL5 by developing each required function, calculation process, and display element individually.
Setting up the Indicator Structure and Buffers
First, set up the indicator structure and buffers.
Example:
#property indicator_separate_window
#property indicator_buffers 6
#property indicator_plots   2

#property indicator_label1  "Momentum"
#property indicator_type1   DRAW_COLOR_LINE
#property indicator_color1  clrOrange,clrSpringGreen
#property indicator_width1  2

#property indicator_label2  "Fill"
#property indicator_type2   DRAW_FILLING
#property indicator_color2 clrGray,clrGray

//--- indicator buffers
double momBuf[];       // Stores the final Hull Moving Average momentum values
double colorIdxBuf[];  // Stores the color index for bullish and bearish momentum
double fillTopBuf[];   // Stores the upper boundary of the filling area
double zeroBuf[];      // Stores the zero reference level for the filling plot
double diffBuf[];      // Stores raw momentum values (current close - close[InpLength bars ago])
double rawBuf[];       // Stores the intermediate HMA values before final smoothing

//+------------------------------------------------------------------+
//| Custom indicator initialization function                         |
//+------------------------------------------------------------------+
int OnInit()
  {
//--- Validate input parameters
   if(InpLength < 1 || InpSmooth < 1)
      return(INIT_PARAMETERS_INCORRECT);

//--- Map indicator buffers to their corresponding data and calculation purposes
   SetIndexBuffer(0,momBuf,INDICATOR_DATA);
   SetIndexBuffer(1,colorIdxBuf,INDICATOR_COLOR_INDEX);
   SetIndexBuffer(2,fillTopBuf,INDICATOR_DATA);
   SetIndexBuffer(3,zeroBuf,INDICATOR_DATA);
   SetIndexBuffer(4,diffBuf,INDICATOR_CALCULATIONS);
   SetIndexBuffer(5,rawBuf,INDICATOR_CALCULATIONS);

//--- Set all indicator buffers to process data from oldest to newest bar
   ArraySetAsSeries(momBuf,false);
   ArraySetAsSeries(colorIdxBuf,false);
   ArraySetAsSeries(fillTopBuf,false);
   ArraySetAsSeries(zeroBuf,false);
   ArraySetAsSeries(diffBuf,false);
   ArraySetAsSeries(rawBuf,false);

//--- Configure general indicator display settings
   IndicatorSetInteger(INDICATOR_LEVELS,1);
   IndicatorSetDouble(INDICATOR_LEVELVALUE,0,0.0);
   IndicatorSetString(INDICATOR_SHORTNAME,"Hull MA Momentum");

//---
   return(INIT_SUCCEEDED);
  }
Explanation:
The first step is to define the basic structure of the Hull Moving Average Momentum Indicator using the indicator properties. The indicator is configured to run in a separate window below the main price chart, allowing the momentum values to be displayed independently from price movements. We also specify that the indicator will use six buffers to store both visual and calculation data, while two plots will be used to display the momentum line and the filling area.
Before configuring the indicator buffers and plots, the input parameters are validated to ensure that InpLength and InpSmooth are greater than zero. If either parameter contains an invalid value, the function returns INIT_PARAMETERS_INCORRECT and stops the initialization process. This prevents invalid smoothing or momentum periods from being passed to the subsequent calculations.
Next, we configure the visual components of the indicator by defining the properties of each plot. The first plot represents the momentum line, which uses a color-changing line display to show positive and negative momentum conditions. Two colors are assigned to the momentum line, and the appropriate color is later selected according to the momentum value through the color index buffer. The second plot creates a consistent gray filling area between the momentum line and the zero reference level, providing additional visual emphasis around the baseline.
After defining the indicator plots, we create the required buffers that will store the data used by the indicator. Each buffer has a specific purpose: the main momentum buffer stores the final Hull Moving Average momentum values displayed on the chart, the color index buffer controls the line color changes, the filling buffer stores the upper boundary of the filled area, and the zero buffer provides the reference level for the filling plot. Additional calculation buffers are created to store the raw momentum values and intermediate Hull Moving Average values before the final smoothing stage.
Once the buffers are declared, we map each buffer to its role in the indicator. This allows MetaTrader 5 to understand which buffers are responsible for displaying data, controlling colors, or performing internal calculations. We also configure the buffer indexing direction so that calculations are processed from the oldest candle to the newest candle, ensuring that the momentum and smoothing calculations are performed in the correct chronological order. Finally, we configure the general display settings of the indicator. A zero reference level is added to help identify positive and negative momentum regions, and the indicator name is defined for display in the MetaTrader 5 interface. These settings complete the initial indicator configuration before the momentum and HMA calculations are performed.Configuring Indicator Inputs, Warm-Up Handling, and Recalculation Logic
Next, set up the indicator inputs and calculation parameters.
Example:
//--- inputs
input int    InpLength   = 50;                 // Momentum calculation length
input int    InpSmooth   = 50;                 // Hull Moving Average smoothing period
input color  InpColUp    = clrSpringGreen;     // Color for positive momentum
input color  InpColDn    = clrOrange;          // Color for negative momentum

//+------------------------------------------------------------------+
//| Custom indicator initialization function                         |
//+------------------------------------------------------------------+
int OnInit()
  {
//--- Validate input parameters
   if(InpLength < 1 || InpSmooth < 1)
      return(INIT_PARAMETERS_INCORRECT);

//--- Map indicator buffers to their corresponding data and calculation purposes
   SetIndexBuffer(0,momBuf,INDICATOR_DATA);
   SetIndexBuffer(1,colorIdxBuf,INDICATOR_COLOR_INDEX);
   SetIndexBuffer(2,fillTopBuf,INDICATOR_DATA);
   SetIndexBuffer(3,zeroBuf,INDICATOR_DATA);
   SetIndexBuffer(4,diffBuf,INDICATOR_CALCULATIONS);
   SetIndexBuffer(5,rawBuf,INDICATOR_CALCULATIONS);

//--- Set all indicator buffers to process data from oldest to newest bar
   ArraySetAsSeries(momBuf,false);
   ArraySetAsSeries(colorIdxBuf,false);
   ArraySetAsSeries(fillTopBuf,false);
   ArraySetAsSeries(zeroBuf,false);
   ArraySetAsSeries(diffBuf,false);
   ArraySetAsSeries(rawBuf,false);

//--- Configure general indicator display settings
   IndicatorSetInteger(INDICATOR_LEVELS,1);
   IndicatorSetDouble(INDICATOR_LEVELVALUE,0,0.0);
   IndicatorSetString(INDICATOR_SHORTNAME,"Hull MA Momentum");

//--- Plot 1 (the line) - 2-color palette, index 0 = down color, index 1 = up color
   PlotIndexSetInteger(0,PLOT_LINE_COLOR,0,InpColDn);
   PlotIndexSetInteger(0,PLOT_LINE_COLOR,1,InpColUp);

//--- Plot 2 (the fill)
   PlotIndexSetInteger(1,PLOT_LINE_COLOR,0,clrGray);
   PlotIndexSetInteger(1,PLOT_LINE_COLOR,1,clrGray);

//--- Set the first drawable bar after the HMA warm-up period
   int sqrtPeriod = MathMax(1,(int)MathRound(MathSqrt(InpSmooth)));
   int drawBegin = InpLength + InpSmooth + sqrtPeriod;

   PlotIndexSetInteger(0,PLOT_DRAW_BEGIN,drawBegin);
   PlotIndexSetInteger(1,PLOT_DRAW_BEGIN,drawBegin);

//---
   return(INIT_SUCCEEDED);
  }
//+------------------------------------------------------------------+
//| Custom indicator iteration function                              |
//+------------------------------------------------------------------+
int OnCalculate(const int rates_total,
                const int prev_calculated,
                const datetime &time[],
                const double &open[],
                const double &high[],
                const double &low[],
                const double &close[],
                const long &tick_volume[],
                const long &volume[],
                const int &spread[])
  {
//---
   int sqrtPeriod = MathMax(1,(int)MathRound(MathSqrt(InpSmooth)));

   if(rates_total < InpLength+InpSmooth+sqrtPeriod+5)
      return(0);

   int safety = InpLength+InpSmooth+sqrtPeriod;
   int start;

   if(prev_calculated==0)
     {
      start = safety;

      //--- blank out anything before "start" so no flat line / stray objects appear there
      for(int i=0;i<start;i++)
        {
         momBuf[i]      = EMPTY_VALUE;
         zeroBuf[i]     = EMPTY_VALUE;
         fillTopBuf[i]  = EMPTY_VALUE;
         colorIdxBuf[i] = 0;
        }
     }
   else
      start = MathMax(InpLength, prev_calculated-safety);

//--- return value of prev_calculated for next call
   return(rates_total);
  }
Explanation:
The indicator uses several input parameters to control the momentum calculation, smoothing behavior, and visual appearance. InpLength defines the number of candles used to measure the raw momentum by comparing the current closing price with the closing price from the selected number of periods earlier. InpSmooth controls the smoothing period used in the Hull Moving Average calculation, where larger values produce a smoother momentum line while smaller values make the indicator respond faster to price changes. InpColUp and InpColDn define the colors used for positive and negative momentum conditions.
Before configuring the indicator buffers and plots, the input parameters are validated to ensure that InpLength and InpSmooth are greater than zero. If either parameter contains an invalid value, the function returns INIT_PARAMETERS_INCORRECT and stops the initialization process. This prevents invalid momentum or smoothing periods from being passed to the subsequent calculations.
After defining the input parameters, we configure the colors used by the indicator plots. The first plot represents the momentum line and uses a two-color palette, where color index 0 corresponds to the negative momentum color and color index 1 corresponds to the positive momentum color. The appropriate index is assigned later during the main momentum calculation. The second plot represents the filling area between the momentum line and the zero level and uses a consistent gray color. This provides additional visual emphasis around the zero level without relying on dynamic color changes for the filling area.
The PLOT_DRAW_BEGIN property is also configured for both plots so that MetaTrader 5 begins drawing them only after the defined warm-up range. Before setting this value, the indicator calculates the square root of the smoothing period using MathRound() to obtain an integer period for the final HMA smoothing stage. The warm-up range is then calculated from InpLength , InpSmooth , and the rounded square-root period.
A conservative warm-up range is used to provide additional historical data for the HMA calculation and help ensure that sufficient intermediate values are available before plotting begins. This range is stored in drawBegin and applied to both plots through PLOT_DRAW_BEGIN . It should be considered a safe reserve rather than a strict mathematical minimum required by the HMA formula.
In OnCalculate() , the indicator first calculates the same rounded square-root period and checks whether enough historical candles are available for the required calculations. If the available history is insufficient, the function returns without proceeding. The safety range is then calculated, and during the first calculation, start is set to this safety position. Values before this position are assigned EMPTY_VALUE in the display buffers so that incomplete data is not shown.
During subsequent calculations, the indicator uses prev_calculated and the safety range to determine the restart point. This allows the required historical values to be recalculated without processing the entire available history on every update. At this stage, the code prepares the calculation range, warm-up handling, and recalculation logic; the actual momentum and HMA calculations are added in the following implementation step.Calculating Raw Momentum
Next, calculate the raw momentum.
Example:
if(prev_calculated==0)
  {
   start = safety;

//--- blank out anything before "start" so no flat line / stray objects appear there
   for(int i=0;i<start;i++)
     {
      momBuf[i]      = EMPTY_VALUE;
      zeroBuf[i]     = EMPTY_VALUE;
      fillTopBuf[i]  = EMPTY_VALUE;
      colorIdxBuf[i] = 0;
     }
  }
else
   start = MathMax(InpLength, prev_calculated-safety);

for(int i=start;i<rates_total;i++)
  {
//--- momentum
   diffBuf[i] = close[i]-close[i-InpLength];
  }
Explanation:
After preparing the calculation range, the indicator begins calculating the raw momentum values for each candle. On the first calculation, start is set to the conservative safety position, while on subsequent calculations it is determined using prev_calculated and the safety range. The loop then processes the available bars from start to rates_total, ensuring that the required historical data is available before the momentum calculation begins.
For each candle, the indicator accesses the current closing price and compares it with the closing price from a specified number of candles earlier, based on the value of InpLength. The difference between these two closing prices is calculated using close[i] - close[i-InpLength] and stored in the diffBuf calculation buffer.
The diffBuf buffer is used to store the raw momentum values before they are smoothed. It does not represent the final indicator output; instead, it provides the input data that will be used by the Hull Moving Average calculation in the next stage. This separation allows the indicator to calculate the price-based momentum first and apply the HMA smoothing separately. For example, when InpLength is set to 50, the indicator compares the closing price of the current candle with the closing price from 50 candles earlier.
If the current closing price is higher than the closing price from InpLength bars ago, the resulting momentum value is positive. If it is lower, the momentum value is negative. The resulting values are stored in diffBuf and will be passed to the HMA calculation in the following implementation step.
Implementing the Weighted Moving Average Calculation
The next stage focuses on implementing the Weighted Moving Average calculation that will serve as the foundation for the different smoothing stages of the Hull Moving Average.
Example:
//--- inputs
input int    InpLength   = 50;                 // Momentum calculation length
input int    InpSmooth   = 50;                 // Hull Moving Average smoothing period
input color  InpColUp    = clrSpringGreen;     // Color for positive momentum
input color  InpColDn    = clrOrange;          // Color for negative momentum

//+------------------------------------------------------------------+
//| Weighted Moving Average ending at index "endIdx" (non-series)    |
//+------------------------------------------------------------------+
double WMA(const double &src[],int endIdx,int period)
  {
   if(endIdx < period-1 || period<=0)
      return(EMPTY_VALUE);

   double sum=0,wsum=0;

   for(int k=0;k<period;k++)
     {
      //--- stop if any required value is invalid
      if(src[endIdx-k]==EMPTY_VALUE)
         return(EMPTY_VALUE);

      int w=period-k;
      sum += src[endIdx-k]*w;
      wsum += w;
     }

   return(sum/wsum);
  }
Explanation:
The WMA() function is created to calculate the Weighted Moving Average for a given data series. The function accepts three parameters: src[] , which contains the data series being averaged; endIdx , which identifies the ending array index for the calculation; and period , which determines the number of data points included in the WMA calculation. The calculation first checks whether the selected period is valid and whether enough historical values are available to complete the WMA calculation. If insufficient data is available, the function returns EMPTY_VALUE rather than attempting to calculate an incomplete WMA. This prevents the function from using unavailable data and ensures that valid WMA values are only produced when the required historical data exists.
After confirming that enough data is available, two variables are initialized: sum stores the total of all data values after applying their respective weights, while wsum stores the total of all assigned weights. The function then processes each value within the selected period and checks whether the required source value is EMPTY_VALUE . If an invalid value is encountered, the function immediately returns EMPTY_VALUE instead of including it in the calculation. This prevents invalid intermediate values from propagating through the WMA and subsequent HMA calculations. For valid values, the function applies a different weight to each one. Recent values receive larger weights, while older values receive smaller weights, allowing the WMA to place more emphasis on recent values.
During each loop iteration, the current data value is multiplied by its assigned weight and added to sum . At the same time, the weight itself is added to wsum . After completing the weighting process, the function returns the calculated WMA value by dividing the weighted total by the combined weights. This approach keeps the calculation organized and allows the same WMA function to be reused when constructing the intermediate and final stages of the Hull Moving Average.
The WMA implementation recalculates the weighted values for each candle, keeping the code simple and easy to understand. While this approach is suitable for the tutorial and moderate smoothing periods, it may require more computation with huge datasets, long periods, or multiple symbols. More optimized WMA methods can be considered for performance-sensitive applications.
Calculating and Visualizing the Hull Moving Average Momentum
Next, calculate the Hull Moving Average momentum values and prepare the data required to display the momentum line and filling area on the indicator window.
Example:
#property indicator_separate_window
#property indicator_buffers 6
#property indicator_plots   2

#property indicator_label1  "Momentum"
#property indicator_type1   DRAW_COLOR_LINE
#property indicator_color1  clrOrange,clrSpringGreen
#property indicator_width1  2

#property indicator_label2  "Fill"
#property indicator_type2   DRAW_FILLING
#property indicator_color2 clrGray,clrGray

//--- indicator buffers
double momBuf[];       // Stores the final Hull Moving Average momentum values
double colorIdxBuf[];  // Stores the color index for bullish and bearish momentum
double fillTopBuf[];   // Stores the upper boundary of the filling area
double zeroBuf[];      // Stores the zero reference level for the filling plot
double diffBuf[];      // Stores raw momentum values (current close - close[InpLength bars ago])
double rawBuf[];       // Stores the intermediate HMA values before final smoothing

//--- inputs
input int    InpLength   = 50;                 // Momentum calculation length
input int    InpSmooth   = 50;                 // Hull Moving Average smoothing period
input color  InpColUp    = clrSpringGreen;     // Color for positive momentum
input color  InpColDn    = clrOrange;          // Color for negative momentum

//+------------------------------------------------------------------+
//| Weighted Moving Average ending at index "endIdx" (non-series)    |
//+------------------------------------------------------------------+
double WMA(const double &src[],int endIdx,int period)
  {
   if(endIdx < period-1 || period<=0)
      return(EMPTY_VALUE);

   double sum=0,wsum=0;

   for(int k=0;k<period;k++)
     {
      //--- stop if any required value is invalid
      if(src[endIdx-k]==EMPTY_VALUE)
         return(EMPTY_VALUE);

      int w=period-k;
      sum += src[endIdx-k]*w;
      wsum += w;
     }

   return(sum/wsum);
  }

//+------------------------------------------------------------------+
//| Hull MA ending at index "endIdx"                                 |
//+------------------------------------------------------------------+
double HMA(const double &src[], double &rawArr[], int endIdx, int period)
  {
   int half = MathMax(1,(int)MathRound(period/2.0));
   double wma1 = WMA(src, endIdx, half);
   double wma2 = WMA(src, endIdx, period);
   if(wma1==EMPTY_VALUE || wma2==EMPTY_VALUE)
      return(EMPTY_VALUE);
   rawArr[endIdx] = 2.0*wma1 - wma2;
   int sqrtPeriod = MathMax(1,(int)MathRound(MathSqrt(period)));
   return(WMA(rawArr, endIdx, sqrtPeriod));
  }

//+------------------------------------------------------------------+
//| Custom indicator initialization function                         |
//+------------------------------------------------------------------+
int OnInit()
  {
//--- Validate input parameters
   if(InpLength < 1 || InpSmooth < 1)
      return(INIT_PARAMETERS_INCORRECT);

//--- Map indicator buffers to their corresponding data and calculation purposes
   SetIndexBuffer(0,momBuf,INDICATOR_DATA);
   SetIndexBuffer(1,colorIdxBuf,INDICATOR_COLOR_INDEX);
   SetIndexBuffer(2,fillTopBuf,INDICATOR_DATA);
   SetIndexBuffer(3,zeroBuf,INDICATOR_DATA);
   SetIndexBuffer(4,diffBuf,INDICATOR_CALCULATIONS);
   SetIndexBuffer(5,rawBuf,INDICATOR_CALCULATIONS);

//--- Set all indicator buffers to process data from oldest to newest bar
   ArraySetAsSeries(momBuf,false);
   ArraySetAsSeries(colorIdxBuf,false);
   ArraySetAsSeries(fillTopBuf,false);
   ArraySetAsSeries(zeroBuf,false);
   ArraySetAsSeries(diffBuf,false);
   ArraySetAsSeries(rawBuf,false);

//--- Configure general indicator display settings
   IndicatorSetInteger(INDICATOR_LEVELS,1);
   IndicatorSetDouble(INDICATOR_LEVELVALUE,0,0.0);
   IndicatorSetString(INDICATOR_SHORTNAME,"Hull MA Momentum");

//--- Plot 1 (the line) - 2-color palette, index 0 = down color, index 1 = up color
   PlotIndexSetInteger(0,PLOT_LINE_COLOR,0,InpColDn);
   PlotIndexSetInteger(0,PLOT_LINE_COLOR,1,InpColUp);

//--- Plot 2 (the fill)
   PlotIndexSetInteger(1,PLOT_LINE_COLOR,0,clrGray);
   PlotIndexSetInteger(1,PLOT_LINE_COLOR,1,clrGray);

//--- Set the first drawable bar after the HMA warm-up period
   int sqrtPeriod = MathMax(1,(int)MathRound(MathSqrt(InpSmooth)));
   int drawBegin = InpLength + InpSmooth + sqrtPeriod;

   PlotIndexSetInteger(0,PLOT_DRAW_BEGIN,drawBegin);
   PlotIndexSetInteger(1,PLOT_DRAW_BEGIN,drawBegin);

//---
   return(INIT_SUCCEEDED);
  }

//+------------------------------------------------------------------+
//| Custom indicator iteration function                              |
//+------------------------------------------------------------------+
int OnCalculate(const int rates_total,
                const int prev_calculated,
                const datetime &time[],
                const double &open[],
                const double &high[],
                const double &low[],
                const double &close[],
                const long &tick_volume[],
                const long &volume[],
                const int &spread[])
  {
//---
   int sqrtPeriod = MathMax(1,(int)MathRound(MathSqrt(InpSmooth)));

   if(rates_total < InpLength+InpSmooth+sqrtPeriod+5)
      return(0);

   int safety = InpLength+InpSmooth+sqrtPeriod;
   int start;

   if(prev_calculated==0)
     {
      start = safety;

      //--- blank out anything before "start" so no flat line / stray objects appear there
      for(int i=0;i<start;i++)
        {
         momBuf[i]      = EMPTY_VALUE;
         zeroBuf[i]     = EMPTY_VALUE;
         fillTopBuf[i]  = EMPTY_VALUE;
         colorIdxBuf[i] = 0;
        }
     }
   else
      start = MathMax(InpLength, prev_calculated-safety);

   for(int i=start;i<rates_total;i++)
     {
      //--- momentum
      diffBuf[i] = close[i]-close[i-InpLength];

      momBuf[i]  = HMA(diffBuf, rawBuf, i, InpSmooth);
      fillTopBuf[i] = momBuf[i];
      zeroBuf[i] = 0.0;
      colorIdxBuf[i] = (momBuf[i] >= 0.0) ? 1 : 0;
     }

//--- return value of prev_calculated for next call
   return(rates_total);
  }
Explanation:
The `HMA()` function is created to calculate the final Hull Moving Average value from the raw momentum data stored in the input array. The function uses the Weighted Moving Average calculation implemented in the previous step and combines multiple WMA calculations to produce the final smoothed momentum value. The function receives four parameters: `src[]`, which contains the raw momentum values to be smoothed; `rawArr[]`, which stores the intermediate HMA calculation results; `endIdx`, which defines the current array index being calculated; and `period`, which represents the selected smoothing period.
The calculation begins by creating two Weighted Moving Average values with different periods. The first WMA uses half of the selected period, while the second WMA uses the full selected period. Because WMA periods must be integer values, the half-period is rounded to the nearest integer using `MathRound()`. These two weighted averages provide the foundation for the next stage of the Hull Moving Average calculation. If either WMA returns `EMPTY_VALUE` because sufficient valid data is not available, the `HMA()` function also returns `EMPTY_VALUE` without producing an intermediate result.
Once both WMA values are available, they are combined to produce the intermediate Hull Moving Average value. By doubling the shorter-period WMA and subtracting the longer-period WMA, the calculation gives greater emphasis to recent values. The resulting value is stored in the `rawArr` buffer because it is required for the final smoothing stage. The HMA calculations are performed sequentially from the oldest bar toward the newest bar, ensuring that the preceding `rawArr` values required by the final WMA have already been calculated when they are accessed.
Next, the function calculates the square root of the selected period. This value determines the final smoothing length used in the Hull Moving Average calculation. Because the WMA period must be an integer, the square-root value is also rounded to the nearest integer using `MathRound()`. The intermediate HMA values stored in `rawArr` are then passed through another Weighted Moving Average using this rounded square-root period. This rounding is an implementation choice used to obtain valid integer periods for the WMA calculation. The final WMA result returned by the function represents the completed Hull Moving Average momentum value.
After the Hull Moving Average value has been calculated, the indicator stores the result for visualization. The returned HMA value is assigned to the `momBuf` buffer, which serves as the main data buffer for plotting the momentum line in the indicator window. The calculated value is also copied into the `fillTopBuf` buffer, which is used together with the `zeroBuf` buffer to create the filling area between the momentum line and the zero level.
The `zeroBuf` buffer is assigned a constant value of zero for every calculated candle, creating the baseline that separates positive and negative momentum regions. The filling area uses a consistent gray color to provide additional visual emphasis around this baseline. Finally, the indicator assigns the color index based on the HMA value. When the momentum value is greater than or equal to zero, the index is set to `1`, which selects the positive momentum color specified by `InpColUp`. If the value is below zero, the index is set to `0`, which selects the negative momentum color defined by `InpColDn`. This allows the indicator to visually distinguish positive and negative momentum conditions directly on the momentum line.
Conclusion
By completing this article, we have developed a Hull Moving Average Momentum Indicator in MQL5 that combines raw price momentum calculation with HMA smoothing to create a responsive momentum analysis tool. The focus was on understanding how price movement data can be transformed into a smoother momentum series while maintaining sensitivity to market changes. Throughout this implementation, we have learned how to:
- calculate raw momentum values using historical closing price differences;
- implement the Weighted Moving Average function required for Hull Moving Average calculations;
- construct the Hull Moving Average using multiple smoothing stages;
- display momentum conditions using a color-changing line and a consistent gray filling area;
- organize indicator calculations using multiple buffers for efficient data management.
This project demonstrates how momentum analysis can be implemented in MQL5 by combining mathematical smoothing techniques with practical chart visualization. The resulting oscillator can help assess the current momentum state, but zero-line crossings can occur frequently during flat market conditions and should not be treated as standalone trading signals. The knowledge gained from this article can serve as a foundation for developing custom oscillators and broader trading strategies in which momentum information is combined with additional confirmation and risk-management logic.
Warning: All rights to these materials are reserved by MetaQuotes Ltd. Copying or reprinting of these materials in whole or in part is prohibited.
This article was written by a user of the site and reflects their personal views. MetaQuotes Ltd is not responsible for the accuracy of the information presented, nor for any consequences resulting from the use of the solutions, strategies or recommendations described.

 MetaTrader 5 Machine Learning Blueprint (Part 20): Denoising, Detoning, and Clustering the Feature Correlation Matrix
 Price Action Analysis Toolkit Development (Part 80): Building a History Navigator for MetaTrader 5
 From Basic to Intermediate: Navigating the Sandbox
 Creating a Cairo-Inspired Graphics Library for MetaTrader 5 (Part 1): Why the terminal needs its own 2D-renderer Contents

- Free trading apps
- Over 8,000 signals for copying
- Economic news for exploring financial markets
You agree to website policy and terms of use