Technische Indikatoren für den MetaTrader 5 - 9

Benutzerdefinierter Spread-Indikator *Bitte schreiben Sie eine Bewertung, danke!
Auch eine MT4-Version ist verfügbar
Spread-Indikator zeigt den aktuellen Spread in Pips mit Farbcodes an. Behandelt 3 Stufen, Niedrig, Mittel, Hoch. Sie können Ebenen und Farben für jede Ebene (z. B. Low: Grün, Medium: Orange, High: Rot), und können wählen, Anzeigeposition auf dem Chart.
Es gibt zwei Spread-Berechnungsmodi: -> Server-Spread-Wert -> Ask - Bid Wert
Sie können die Deckkraft für eine bessere Anpassu
FREE

Candle Counter ist ein Indikator, der die Anzahl der Kerzen ab der ersten Kerze des Tages druckt. Die erste Kerze des Tages ist die Nummer 1 und jede neue Kerze wird in dieser Zählung um 1 erhöht.
Eingabeparameter Wählen Sie aus gerade, ungerade oder alle Entfernung von Kerze zum Drucken der Zahl Schriftgröße des Textes Schriftfarbe des Textes
Wenn Sie noch Fragen haben, kontaktieren Sie mich bitte per Direktnachricht: https://www.mql5.com/de/users/robsjunqueira/
FREE

Sonic R Indicator Beschreibung Überblick Der Sonic R-Indikator für MT5 wurde entwickelt, um Händlern bei der Analyse von Markttrends mithilfe von gleitenden Durchschnitten und Volumenanalysen zu helfen. Dieses Tool hilft bei der Identifizierung potenzieller Kursbewegungen, indem es Trendzonen und Volumenstärke anzeigt, wodurch es sich für verschiedene Handelsstrategien eignet. Hauptmerkmale Duale EMA-Trendkanäle - Verwendet exponentielle gleitende Durchschnitte (EMA) mit 34 Perioden zur Visuali

Bar Countdown ist ein einfacher Indikator für MetaTrader 5, der die verbleibende Zeit einer jeden Kerze anzeigt. Er kann in einer beliebigen Ecke des Charts oder in der Nähe des Schlusskurses platziert werden und hilft Ihnen,
zu wissen, ob die aktuelle Kerze endet. Wählen Sie das Zählerformat zwischen HR:MIN:SEC und MIN:SEC Es ist so einfach zu bedienen, konfigurieren Sie die Farbe, die Größe und die Position des Zählers auf dem Chart und das war's!!! Der Countdown beginnt jetzt!
Aktualisierun
FREE

Trend Battle Indikator
Übersicht Der Trend Battle Indicator ist ein professionelles technisches Analyseinstrument, das den Kampf zwischen Käufern (Bullen) und Verkäufern (Bären) auf dem Markt durch ein umfassendes Dashboard aufzeigt. Mit Hilfe einer intuitiven visuellen Schnittstelle bietet der Indikator eine einzigartige Perspektive auf die Dynamik der Marktmacht, indem er die letzten zwanzig Balken analysiert, um präzise Einblicke in das Momentum und die Richtungsstärke zu geben. Darüber hina

HINWEIS: Pattern Scan EINschalten
Dieser Indikator identifiziert Swing Points, Break of Structure (BoS), Change of Character (CHoCH), Kontraktions- und Expansionsmuster, die auf den Charts eingezeichnet werden. Der Indikator verfügt außerdem über Alarme und mobile Benachrichtigungen, damit Sie keinen Handel verpassen. Es kann für alle Handelsinstrumente und alle Zeitrahmen verwendet werden. Die Eigenschaft, dass die Charts nicht neu gezeichnet werden, macht sie besonders nützlich für das Backte
FREE

Advanced Stochastic Scalper ist ein Oszillator mit dynamischen überkauften und überverkauften Niveaus, während diese Niveaus im Standard-Stochastic-Oszillator statisch sind und sich nicht ändern. Dadurch kann sich Advanced Stochastic Scalper an den sich ständig ändernden Markt anpassen.
Wenn ein Kauf- oder Verkaufssignal erscheint, wird ein Pfeil auf dem Chart gezeichnet und eine Warnung ausgelöst, die es Ihnen ermöglicht, rechtzeitig eine Position zu eröffnen und nicht ständig an Ihrem PC zu si
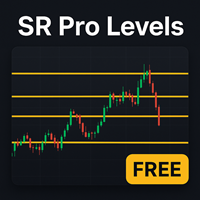
Erhalte glasklare Marktstruktur in Sekunden – ohne manuelles Zeichnen!
Der HTF Auto Support & Resistance Indikator markiert automatisch die entscheidenden Unterstützungs- und Widerstandslevel direkt auf deinem Chart. Diese Levels basieren auf höherer Zeiteinheit (HTF) und sind daher deutlich zuverlässiger als kurzfristige Zufallslinien. Hauptfunktionen: Automatische Erkennung der stärksten Support- & Resistance-Zonen Multi-Timeframe-Analyse : Wähle die höhere Zeiteinheit für präzisere Levels Kla
FREE

Dies ist eine Ableitung des "TTM Squeeze"-Volatilitätsindikators von John Carter, der in seinem Buch "Mastering the Trade" (Kapitel 11) beschrieben wird.
Der graue Punkt auf der Mittellinie zeigt, dass der Markt gerade in einen Squeeze eingetreten ist (die Bollinger Bänder befinden sich im Keltner-Kanal). Dies bedeutet, dass die Volatilität gering ist und der Markt sich auf eine explosive Bewegung (nach oben oder unten) vorbereitet. Ein blauer Punkt bedeutet "Squeeze Release".
Mr. Carter emp
FREE

Ichimoku Trend Alert ist der Ichimoku Kinko Hyo Indikator mit Alerts und Signalfiltern.
Ichimoku Trend Alert Funktionen: Optionale Überprüfung von Ichimoku-Wolke, Tenkan sen (Umkehrlinie), Kijun sen (Basislinie), Senkou-Spanne A, Senkou-Spanne B und Chikou-Spanne relativ zum Preis und mehr. Popup-, E-Mail- und Telefon-Benachrichtigungen für ausgewählte Symbole und Zeitrahmen.
Es gibt 9 klassische Ichimoku-Trendfilter, die Sie in den Einstellungen aktivieren/deaktivieren können : Price/Cloud Or
FREE

Dieser Indikator findet und zeigt die technischen Analysemuster Double Bottom und Double Top an. Signalisiert (zeigt eine Meldung auf dem Bildschirm an), wenn die Form vor kurzem geformt wurde. Nach dem Auftreten dieser Muster kehrt sich der Trend oft um oder es kommt zu einer Korrektur. Um nicht selbst nach ihnen zu suchen oder ihr Aussehen nicht zu verpassen, reicht es aus, dem Diagramm einen Indikator hinzuzufügen. Der Indikator kann für verschiedene Zeitrahmen und Währungspaare verwendet we
FREE

Vorstellung von Koala FVG für MT5: Ihr professioneller Fair Value Gap (FVG) Pattern Indikator. Koala FVG: Ihr Weg zu präzisem Trading auf MT5 Entdecken Sie die Kraft des Fair Value Gap (FVG) Patterns mit Koala FVG – einem hochmodernen Indikator, entwickelt für MetaTrader 5. Für eine begrenzte Zeit haben Sie kostenlosen Zugang zu diesem professionellen Tool, bevor es zu einem Premium-Indikator wird. Hauptmerkmale: FVG Pattern Erkennung: Koala FVG identifiziert intelligent qualifizierte FVG Patter
FREE
VM Breakout BB: Wahrscheinlichkeitsbasierter Breakout-Indikator mit Bollinger-Bändern VM Breakout BB ist ein Breakout-Erkennungsindikator, der Bollinger-Bänder mit statistischer Wahrscheinlichkeitsanalyse (Z-Score und die kumulative Verteilungsfunktion der Normalverteilung, CDF) kombiniert und intelligente Bestätigungsfilter wie RSI, ADX und Volume SMA verwendet. Der Indikator soll Signale mit klarer statistischer Grundlage liefern, Rauschen reduzieren und Breakouts bestätigen, die eine höhere E
FREE

Dieser Indikator zeigt die Wellenstruktur des Marktes in Form von mehreren ineinander verschachtelten Wellenebenen an. Für jedes dieser Niveaus wird eine automatische vorläufige Markierung der Wellen im Elliott-Stil (123..., ABC... usw.) erstellt. Diese Markierung ist völlig automatisch und absolut eindeutig. Der Indikator ist besonders für Wellenanalytiker-Anfänger nützlich, da er es ermöglicht, unter allen möglichen Versionen der Wellenmarkierung sofort die geeignetste Version als Grundlage zu
Der Pin Bar Tracker ist ein Indikator, der entwickelt wurde, um Muster von Pin Bars in Devisencharts, Gold und Bitcoin in jeder Zeitspanne zu finden. Er enthält ein Tool, das automatisch das Risiko-Ertrags-Verhältnis, die Losgröße und die möglichen Stop-Loss- und Take-Profit-Punkte berechnet. Eigenschaften: - Funktioniert in jeder Zeitspanne - Berechnet Losgrößen automatisch - Zeigt Stop-Loss - und Take-Profit-Niveaus an - Sendet eine Benachrichtigung wenn ein Pin Bar erkannt wird.
FREE

ICT Silberkugel
Wenn Sie auf der Suche nach einem zuverlässigen Indikator für den Handel mit dem ICT Silver Bullet-Konzept oder ICT-Konzepten, Smart Money Concepts oder SMC sind, wird dieser Indikator Ihre Bedürfnisse erfüllen! Before version 2.2, this indicator was focused only on ICT Silver Bullet, but moving forward, we will include the different elements for smart money concept trading. Dieser Indikator hilft Ihnen bei der Identifizierung der folgenden Punkte: FVG - Fair Value Gaps Marktstr

Dieser Indikator wurde entwickelt, um Fraktale auf dem Kursdiagramm anzuzeigen und Händlern zu helfen, wichtige lokale Extrempunkte zu identifizieren. Fraktale sind besondere Punkte im Diagramm, die der klassischen Definition entsprechen: Ein lokales Hoch wird gebildet, wenn die zentrale Kerze höher ist als die beiden benachbarten Kerzen auf beiden Seiten, und ein lokales Tief entsteht, wenn die zentrale Kerze niedriger ist als die beiden benachbarten. Weitere Produkte -> HIER Hauptfunktionen u
FREE
Professionelles VWAP-Handelssystem mit fortschrittlicher Signal-Erkennung Verändern Sie Ihren Handel mit dem umfassendsten VWAP-Indikator, der für MetaTrader 5 verfügbar ist. Magic VWAP Key Levels Pro kombiniert mehrere Zeitrahmenanalysen, intelligente Signalerkennung und professionelle Visualisierung, um Ihnen einen Vorteil auf den modernen Märkten zu verschaffen. KERNFUNKTIONEN: Multi-Timeframe VWAP-Analyse Session-, wöchentliche und monatliche VWAP-Berechnungen Frühere 10-Tage-VWAP-Unterstütz

Dies ist die geglättete Version des Heiken Ashi, bei der Sie wählen können, auf welcher Art von Glättung Sie Ihre Strategie aufbauen möchten. Sie können wählen zwischen EMA oder MA, auf den Zeitraum, den Sie wollen. Und Sie können Farben wählen.
Definition:
Bei der Heikin-Ashi-Technik werden Preisdaten gemittelt, um ein japanisches Candlestick-Diagramm zu erstellen, das Marktstörungen herausfiltert. Heikin-Ashi-Diagramme, die von Munehisa Homma in den 1700er Jahren entwickelt wurden, haben ein
FREE

Ghost Renko Overlay-Indikator Überblick Der Ghost Renko Overlay-Indikator zeigt Renko-Bausteine direkt auf dem Hauptpreisdiagramm als halbtransparentes Overlay an.
Im Gegensatz zu herkömmlichen Renko-Charts, die ein separates Offline-Fenster erfordern, können Händler mit diesem Indikator die Standard-Candlestick-Preisaktion und die Renko-Struktur gleichzeitig auf demselben Diagramm anzeigen. Das Overlay hilft bei der Identifizierung von Trendrichtung, Preisrauschen und Konsolidierungsphasen, ohn
FREE

Der Indikator zeigt eine bullische und bärische Divergenz. Der Indikator selbst (wie die normale Stochastik) wird in einem Unterfenster angezeigt. Grafische Oberfläche : Im Hauptfenster werden grafische Objekte „Trendlinie“ erstellt – vom „Tief“-Preis zum „Tief“-Preis (für bullische Divergenz) und vom „Hoch“-Preis zum „Hoch“-Preis (für bärische Divergenz). ). Der Indikator zeichnet sein Fenster ausschließlich mit grafischen Puffern: „Main“, „Signal“, „Dot“, „Buy“ und „Sell“. Die Puffer „Kauf“
Erhöhen Sie Ihre Trading-Strategie mit dem Nadaraya Watson Envelope Alert MT5 , einem innovativen Indikator, der nicht-parametrische Kernel-Regression nutzt, um eine glatte, adaptive Trendanalyse zu liefern. Inspiriert vom Nadaraya-Watson-Schätzer, wendet dieses Tool Gaussian Kernel-Glättung auf Preisdaten an, um dynamische Envelopes zu erzeugen, die sich an die Markvolatilität anpassen, ohne die übermäßige Verzögerung traditioneller gleitender Durchschnitte. Weit anerkannt auf Plattformen wie

Indikator-Leitfaden: Wichtige Kursniveaus & Strukturverschiebungen 1. Beschreibung Der Indikator ist ein technisches Analyseinstrument für die MetaTrader 5 Plattform. Er wurde entwickelt, um bestimmte Kursbewegungen automatisch zu erkennen und die entsprechenden Kurszonen auf der Grundlage der vorangegangenen Kursbewegung hervorzuheben. Dies ermöglicht eine Visualisierung der wichtigsten Kursbereiche gemäß der internen Logik des Indikators. 2. Visuelle Elemente und ihre Identifizierung Der Indik
FREE

Was ist der volumengewichtete Durchschnittspreis (VWAP)? Der volumengewichtete Durchschnittspreis (VWAP) ist eine von Händlern verwendete Handelsbenchmark, die den Durchschnittspreis angibt, zu dem ein Instrument im Laufe des Tages gehandelt wurde, und zwar auf der Grundlage von Volumen und Preis. Er ist wichtig, weil er Händlern einen Einblick in den Trend und den Wert des Instruments gibt.
Was ist der Unterschied zwischen VWAP und AVWAP? Während der VWAP als Ausgangspunkt den Anfang des Tag

ZigZag-Indikator für mehrere Zeitrahmen. Er zeigt die horizontalen Unterstützungs-/Widerstandslinien und ihre Ausbrüche an und zeichnet die aktuellen Ziele des Marktes ein. Er kann auch Linien des Fractals-Indikators und Kerzen aus anderen Zeiträumen (bis zu vierteljährlich) anzeigen, so dass Sie die Angebots- und Nachfrageebenen tatsächlich sehen können. Indikator - verbindet wichtige Tiefs und Hochs, um Trendlinien anzuzeigen. Sie können ihn auch als Indikator für den Break of Structure (BOS)

Der Indikator stellt einen Trendkanal nach der Technik von Gilbert Raff dar. Die Kanalachse ist eine Regression erster Ordnung. Die obere und untere Linie zeigen die maximale Entfernung der Close-Linie von der Achsenlinie an. Daher können die obere und die untere Linie als Widerstands- bzw. Unterstützungslinien betrachtet werden. Eine ähnliche Version des Indikators für das MT4-Terminal
In der Regel finden die meisten Kursbewegungen innerhalb eines Kanals statt, wobei die Unterstützungs- oder W
FREE

Der gleitende Hull-Durchschnitt ist in Anfängern und vielleicht auch in fortgeschrittenen Handelskreisen nicht sehr bekannt, aber er ist eine sehr schöne Lösung, die von dem Händler Alan Hull entwickelt wurde - bitte besuchen Sie www.AlanHull.com für alle Einzelheiten seiner Kreation. Der Zweck dieses gleitenden Durchschnitts ist es, beide Probleme zu lösen, die alle bekannten und üblichen gleitenden Durchschnitte haben: Lag und Choppiness . Die Implementierung, die wir gemacht haben, hat neben
FREE

Lieben Sie VWAP? Dann werden Sie die VWAP Cloud lieben. Was ist das? Es handelt sich um den sehr bekannten VWAP-Indikator plus 3 Stufen der Standardabweichung, die auf Ihrem Chart angezeigt werden und von Ihnen vollständig konfiguriert werden können. Auf diese Weise können Sie echte Preisunterstützung und Widerstandsniveaus haben. Um mehr darüber zu erfahren, suchen Sie einfach im Internet nach "VWAP Bands" "VWAP und Standardabweichung".
EINSTELLUNGEN VWAP-Zeitrahmen: Stündlich, Täglich, Wöchen
FREE
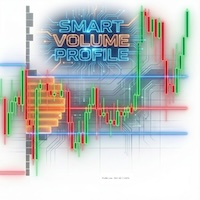
German Scan nach "Smart Money" (Volume Markers): Pfeile zeigen abnormales Volumen (über dem Durchschnitt) mit klarer grün/rot Unterscheidung an. Dies hilft, den Einstieg von Großinvestoren zu erkennen und Fehlsignale zu filtern. Entscheidende Alarme (Alerts): Kein ständiges Beobachten des Bildschirms nötig. Das System benachrichtigt Sie sofort, wenn der Preis die POC-Linie (Point of Control) kreuzt, was oft ein entscheidender Punkt für Fortsetzung oder Umkehr ist. Aktuelle Marktstruktur (Develop

Beschreibung. Die Grundlage für die Bildung des Renko-Charts ist die Preisspanne. Wenn der Preis über seine Grenzen hinausgeht, zeigt das Diagramm eine Box über oder unter der vorherigen. Als Ergebnis sehen wir die Kursbewegung ohne zusätzlichen "Lärm" und wichtige Unterstützungs- und Widerstandsniveaus. Merkmale.
Für die Verwendung in Verbindung mit dem Expert Advisor ist ein zusätzlicher Puffer implementiert - ein Box-Zähler. Zur Vereinfachung und zur Erhöhung der Testgeschwindigkeit kann der
FREE
Volume Profile Density V2.40 Zeigt die Volumenverteilung nach Preisniveau und offenbart Zonen institutionellen Interesses.
Im Gegensatz zum klassischen Volumen (über Zeit) zeigt es, wo tatsächlich gehandelt wurde. Grundprinzipien: Horizontale Balken = gehandelte Volumen pro Preis Längerer Balken → höheres Volumen Rote Zonen = wichtige Unterstützungen / Widerstände Hauptzwecke: Echte Unterstützungs- und Widerstandszonen erkennen POC (Point of Control) bestimmen Value Area (70 % des Volumens) defi
FREE

wenn Sie es testen wollen: private Nachricht an mich (MT5-Demotest funktioniert nicht ) Entwickelt, um Händlern zu helfen, ein tieferes Verständnis für die tatsächliche Dynamik des Auftragsflusses am Markt zu erlangen . Durch die Visualisierung der " Fußabdrücke ", die von den Kerzen hinterlassen werden, zeigt dieser Indikator, wie sich das Delta ( die Differenz zwischen Kauf- und Verkaufsdruck ) während der Kerzenbildung verändert und wie das Volumen bei verschiedenen Kursniveaus schwankt. Dies

Der Indikator sucht nach einer Konsolidierung (Flat) im Markt zu einem bestimmten Zeitpunkt, bildet einen Box-Kanal und markiert von diesem eingerückte Niveaus für einen Breakdawn. Nach dem Überschreiten eines dieser Niveaus markiert der Indikator die Zone für die Gewinnmitnahme und berechnet den entsprechenden Gewinn oder Verlust in Richtung dieses Eintrags auf dem Panel. Auf diese Weise findet der Indikator, der sich an den Markt anpasst, einen flachen Bereich des Marktes, in dem eine Trendbew
FREE
Der "Breakout Finder" ist ein technischer Indikator, der dazu dient, potenzielle Kursausbrüche und -durchbrüche auf einem Chart automatisch zu erkennen. Der Clou dieses Indikators ist sein robustes Signalfiltersystem, das Händlern hilft, falsche Signale (Fakeouts) zu vermeiden und sich auf Handelsmöglichkeiten mit höherer Wahrscheinlichkeit zu konzentrieren. Hauptmerkmale Automatische Pivot-Punkt-Erkennung: Der Indikator identifiziert automatisch signifikante Pivot-Hochs und -Tiefs auf dem Chart
FREE

Der Heikin Ashi-Indikator ist unsere Version des Heikin Ashi-Charts. Im Gegensatz zu Konkurrenzprodukten bietet dieser Indikator umfangreiche Optionen zur Berechnung von Heikin Ashi-Kerzen. Darüber hinaus kann er als klassische oder geglättete Version angezeigt werden.
Der Indikator kann Heikin Ashi mit gleitendem Durchschnitt nach vier Methoden berechnen: SMA - Einfacher gleitender Durchschnitt SMMA - Geglätteter gleitender Durchschnitt EMA - Exponentieller gleitender Durchschnitt LWMA - Linea
FREE

Projective SR – Echtzeit-projizierte Unterstützung und Widerstände Projective SR ist ein fortschrittlicher Indikator, der automatisch wichtige Unterstützungs- und Widerstandspunkte im Chart erkennt und diese diagonal und dynamisch in die Zukunft projiziert . Er antizipiert somit mögliche Zonen, in denen der Preis reagieren könnte. Im Gegensatz zu traditionellen Indikatoren, die nur feste Niveaus anzeigen, analysiert Projective SR die Preisgeometrie , identifiziert die relevantesten Pivots und ze
FREE

Swing-Trading-Logik und professionelle MQL5-Entwicklung auf den ersten Blick. Das Kerzenchart in der Mitte stellt die reale Marktstruktur dar und zeigt sowohl bärische (rot) als auch bullische (grün) Bewegungen. Dies unterstreicht die Fähigkeit des Indikators, mittelfristige Kursschwankungen und nicht nur kurze Scalps zu erfassen. Der Übergang von roten Kerzen auf der linken Seite zu grünen Kerzen auf der rechten Seite vermittelt visuell die Trendumkehr und -fortsetzung , die den Kern des Swing
FREE
REVERSAL POWER PRO
Der EINZIGE Indikator, der Ihnen zeigt, wo die Märkte umkehren werden - BEVOR sie sich bewegen
WILLKOMMEN AUF DER NÄCHSTEN STUFE DER HANDELSPRÄZISION
Haben Sie es satt zu raten, wohin der Markt drehen wird ? Verpassen Sie den Einstieg, weil Sie nicht wissen, wo Unterstützung/Widerstand WIRKLICH ist ? Werden Sie bei "falschen" Niveaus ausgestoppt ? Fragen Sie sich, ob Ihr Bias richtig ist, bevor Sie einsteigen?
Was wäre, wenn Sie Folgendes hätten : Kristallklare Angebots-/
FREE

RBC Range Bar Chart ist ein klassischer Range Bar Chart Indikator. Der Indikator bietet Preisbereiche für die Chartanalyse: High/Low Preisbereich ist eine klassische Option für die Analyse. Er verfügt auch über Eröffnungs-, Hoch-, Tief- und Schlusskurse. Bei der ersten Option werden zwei Preiswerte gleichzeitig analysiert, während die anderen Optionen nur einen Preis verwenden. Konventionell werden Range-Balken unter Verwendung von Tick-Daten gezeichnet, aber da Tick-Daten auf dem Server nicht z

MT5 Version : Pre Hinweis : Der Indikator verwendet den Wert des Eröffnungskurses für die Berechnungen.
Dieser Indikator ist ein echter Momentum-Oszillator im Sinne der wahren Definition des Begriffs "Momentum", wie er durch die Technik der digitalen Filter realisiert wird. Wissenschaftliche Arbeiten des aktuellen Entwicklers zu diesem Thema finden Sie hier und hier , aber in dieser Beschreibung werden wir nur das Minimum an konzeptionellem und mathematischem Rahmen verwenden. Dabei entlarven w
FREE

Торговля пивотами:
1.pp pivot
2. r1 r2 r3, s1 s2 s3 Necessary for traders: tools and indicators Waves automatically calculate indicators, channel trend trading Perfect trend-wave automatic calculation channel calculation , MT4 Perfect trend-wave automatic calculation channel calculation , MT5 Local Trading copying Easy And Fast Copy , MT4 Easy And Fast Copy , MT5 Local Trading copying For DEMO Easy And Fast Copy , MT4 DEMO Easy And Fast Copy , MT5 DEMO
Empfehlen dringend Trendindikatoren,
FREE

Platzieren Sie Preiswarnungen auf erweiterten Rechtecken und Trendlinien - Risiko-Lohn-Indikator MT5 Erweitern Sie Rectangles & Trendlines bis zum rechten Rand Markieren Sie Ihre Angebots-Nachfrage-Zonen mit erweiterten Rechtecken und zeichnen Sie Unterstützungs-Widerstandslinien mit erweiterten Trendlinien. Ausführliche Anleitungen finden Sie hier , Kontakte finden Sie auf meinem Profil . Der MT4 Rectangle Extender Indikator vereinfacht und erleichtert es Ihnen, die Märkte zu analysieren und üb

TB5 Channel ist ein Multi-Timeframe-Kanalindikator. Er generiert Eingangspunkte auf verschiedenen Zeitfenstern. Es gibt 2 Methoden, um einen Indikator zu erstellen. Die erste Methode besteht darin, den Indikator auf dem aktuellen Zeitrahmen zu installieren. In diesem Fall haben Sie einen Kanal auf diesem Zeitrahmen, den Sie auf MT5 haben. Die zweite Methode zur Installation eines Indikators besteht darin, ihn mit dem Index des Zeitrahmens zu multiplizieren. Der Sinn der zweiten Methode besteht

Dieser Indikator gehört zu der Familie der Kanalindikatoren. Diese Kanalindikatoren wurden auf der Grundlage des Prinzips entwickelt, dass der Markt immer in einem schwankungsähnlichen Muster gehandelt wird. Das schwankungsähnliche Muster wird durch die Existenz von Bullen und Bären in einem Markt verursacht. Dies führt dazu, dass ein Markt in einem dynamischen Kanal gehandelt wird. Der Indikator wurde entwickelt, um dem Käufer zu helfen, die Niveaus zu identifizieren, auf denen die Bullen kaufe

Professioneller Indikator für Orderflow- und Volumenanalyse Überblick Dieser fortschrittliche TradingView/MT5-Indikator bietet eine Orderflow- und Volumenanalyse auf institutionellem Niveau, die durch eine ausgefeilte Volumen-Delta-Analyse und die Erkennung der Marktmikrostruktur Smart-Money-Bewegungen, Liquiditätsengpässe und hochwahrscheinliche Handelsmöglichkeiten identifiziert.
Hauptmerkmale Kerzen-Analyse-Engine Analysieren Sie mehrere historische Kerzen mit anpassbaren Rückblickzeiträ

Das Marktprofil wurde von Peter Steidlmayer in der zweiten Hälfte des letzten Jahrhunderts entwickelt. Es ist ein sehr effektives Instrument, wenn Sie die Art und Verwendung verstehen. Es ist nicht wie die üblichen Instrumente wie EMA, RSI, MACD oder Bollinger Bands. Es arbeitet unabhängig vom Preis, basiert nicht auf dem Preis, sondern sein Kern ist das Volumen. Das Volumen ist normal, denn das Instrument wird überall gesungen. Aber das Besondere ist, dass das Marktprofil das Volumen auf jedem

Der Super Trend ist einer der besten Trendfolgeindikatoren für MT5-Plattformen. Es funktioniert gut für Echtzeit-Trend-Warnungen und genaue Signale und es helfen, die besten Markt Einstieg und Ausstiegspositionen zu identifizieren. Dieser Indikator ist das Werkzeug, das Sie auf einen Trend folgenden Overlays beziehen können. Er enthält zwei wichtige Parameter: die Periode und den Multiplikator. Außerdem sollten Händler Standardwerte berücksichtigen, die 10 für jeden wahren Bereich aтd 3 für den
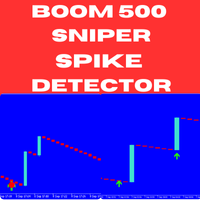
Wir stellen Ihnen den Boom 500 Sniper Spike Detector vor - einen fortschrittlichen, nicht nachmalenden Indikator, der speziell entwickelt wurde, um Ihnen zu helfen, Spikes im Boom 500 Markt mit Präzision zu erfassen. Egal, ob Sie ein erfahrener Trader sind oder gerade erst anfangen, dieser Indikator liefert zuverlässige Signale, die den Spike-Handel vereinfachen und ihn zu einer unverzichtbaren Ergänzung Ihres Handelsarsenals machen. Hauptmerkmale: Nicht wiederholende Signale : Der Boom 500 Snip

Dies ist ein einfacher Candle Stick Pattern Indikator, der in jeder Zeiteinheit funktioniert und nach standardmäßigen Paramtern automatisch entsprechende Pattern im Chart anzeigt, sobald die Bedingungen erfüllt sind. Folgende Candle Stick Pattern sind derzeit implementiert: Bullish Hammer | Bearish Hammer Bullish Inverted Hammer | Bearish Inverted Hammer Bullish Engulfing | Bearish Engulfing Piercing | Dark Cloud Cover Bullish 3 Inside | Bearish 3 Inside Die Formationen werden automatisch berech
FREE

Dieses wunderbare Tool funktioniert bei jedem Paar und gibt Warnungen aus, sobald der Markt in die überkauften und überverkauften Zonen des Marktes eintritt. Die Signale werden als KAUFEN oder VERKAUFEN ausgegeben, was aber nicht unbedingt bedeutet, dass Sie einen Auftrag ausführen sollten, sondern dass Sie beginnen sollten, das Diagramm auf eine mögliche Umkehr zu untersuchen. Für fortgeschrittene Signal-Tools sehen Sie sich einige unserer Premium-Tools wie Dual Impulse an.
FREE

Farbiger ROC mit gleitendem Durchschnitt und Alerts - Fortgeschrittener Momentum-Indikator Verbesserter Rate of Change (ROC)! Dieser benutzerdefinierte Indikator für MetaTrader 5 bietet eine klare und intuitive Ansicht des Marktmomentums, ideal für Trader, die präzise Signale für Beschleunigung oder Verlangsamung von Trends suchen. Was ist ROC und seine Vorteile? Der Rate of Change (ROC) ist ein reiner Momentum-Oszillator, der die prozentuale Preisveränderung im Vergleich zu einer vorherigen Per
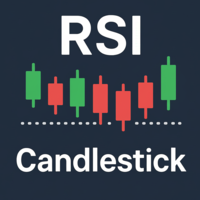
Haven RSI Candlestick ist ein innovativer technischer Indikator, der das traditionelle Liniendiagramm des Relative Strength Index (RSI) in ein intuitives Candlestick-Chartformat umwandelt.
Dieses Tool wurde für Trader entwickelt, die sich auf die technische Analyse verlassen und das Marktmomentum sowie potenzielle Umkehrpunkte schneller und tiefgehender interpretieren möchten. Weitere Produkte -> HIER . Hauptmerkmale: RSI-Visualisierung als Candlesticks: Die Kernfunktion. Sie können jetzt direkt
FREE
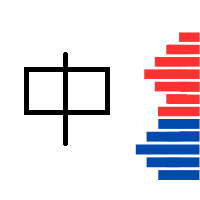
Entfesseln Sie tiefgreifende Markteinblicke mit diesem Indikator, der ein visuelles Orderbuch auf dem Chart anzeigt, inspiriert vom Visual Book von Nelogicas Profit. Er zeigt horizontale Balken für Kaufvolumen (blau) und Verkaufsvolumen (rot), mit gelber Hervorhebung für große Volumen, um hochliquide Zonen leicht zu erkennen. Der Preis tendiert dazu, sich in Richtung der Bereiche mit den höchsten Orderkonzentrationen zu bewegen, was ihn zu einem unverzichtbaren Werkzeug für die Identifikation vo
FREE

Der VR Donchian -Indikator ist eine verbesserte Version des Donchian-Kanals. Die Verbesserungen betrafen fast alle Funktionen des Kanals, der Hauptbetriebsalgorithmus und die Kanalkonstruktion blieben jedoch erhalten. Je nach aktuellem Trend wurde dem Ball-Indikator eine Änderung der Farbe der Niveaus hinzugefügt – dies zeigt dem Händler deutlich eine Trendänderung oder eine Seitwärtsbewegung an. Es wurde die Möglichkeit hinzugefügt, den Händler über den Ausbruch einer von zwei Kanalebenen per S
FREE

Ultimativer Boom- und Crash-Indikator
Der ultimative Boom- und Crash-Indikator ist ein von Coetsee Digital entwickeltes, hochmodernes Tool zur Identifizierung potenzieller Spike-Gelegenheiten auf dem Markt. Dieser Indikator wurde für Händler entwickelt, die sich auf synthetische Deriv- und Weltrade-Märkte konzentrieren. Er ist optimiert, um ausschließlich auf den 3-Minuten- (M3), 5-Minuten- (M5), 15-Minuten- (M15), 30-Minuten- (M30) und 1-Stunden-Zeitrahmen (H1) zu funktionieren und unterstützt

MACD Intraday Trend PRO ist ein Indikator, der durch eine Adaption des ursprünglichen MACD von Gerald Appel in den 1960er Jahren entwickelt wurde.
Im Laufe der Jahre des Handels wurde beobachtet, dass wir durch die Änderung der Parameter des MACD mit Fibonacci-Proportionen eine bessere Darstellung der Kontinuität der Trendbewegungen erreichen, wodurch es möglich ist, den Beginn und das Ende eines Preistrends effizienter zu erkennen.
Aufgrund seiner Effizienz bei der Erkennung von Kurstrends i
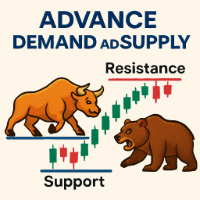
Der Demand & Supply Zone Indicator mit Volume Filtering ist ein technisches Analysetool für MetaTrader, das wichtige Preiszonen identifiziert, in denen sich der Kauf- (Nachfrage) oder Verkaufsdruck (Angebot) konzentriert. Er nutzt Fraktale, Volumenanalyse und Preisaktionen, um diese Zonen auf dem Chart zu erkennen und hervorzuheben. Hauptmerkmale: Zonenerkennung auf der Grundlage von Fraktalen Identifiziert Nachfrage- (Unterstützung) und Angebotszonen (Widerstand) anhand von Fraktalmustern ( lok
FREE

Smart Volume Box wurde entwickelt, um MetaTrader-Benutzern ein leistungsfähiges Analysewerkzeug an die Hand zu geben, mit dem sie die versteckte Dynamik des Marktes aufdecken können. Dieses präzisionsgefertigte Tool mit benutzerfreundlichen Einstellungen integriert wichtige Einblicke in das Volumen und fortschrittliche Funktionen wie Volumenprofil, VWAP (volumengewichteter Durchschnittspreis) und Point of Control (POC)-Level. Im Gegensatz zu typischen Indikatoren liefert Smart Volume Box keine

Phoenix Trend Strength Meter (MT5)
Marktregime- und Trendstärke-Analysator für MetaTrader 5. Kombiniert ADX, RSI und Directional Movement in einem einzigen Panel, um Marktbedingungen in Echtzeit zu klassifizieren.
Zweck
Die meisten Trader scheitern nicht aufgrund schlechter Einstiegspunkte, sondern weil sie die falsche Strategie auf das falsche Marktregime anwenden. Der Phoenix Trend Strength Meter hilft Tradern, sofort zu erkennen, ob sich der Markt in einer Seitwärtsbewegung befindet, einen
FREE

Boom und Crash Gold Miner v2 Handelsindikator basierend auf Marktmomentum funktioniert auf dem Zeitrahmen M1 für Boom und Crash 1000 und M5 für normale Handelspaare Warten Sie auf das Erscheinen des blauen Pfeils und die Änderung der Kerzenfarbe, und die Kerzen müssen über den 2 modifizierten gleitenden Durchschnitten liegen dann können Sie den Markt kaufen. Warten Sie auf das Erscheinen des orangefarbenen Pfeils und den Farbwechsel des Kerzenständers, und die Kerzen müssen unter den 2 modifizie

Divergence Force Divergenz-Indikator Beschreibung Divergence Force ist ein Indikator, der entwickelt wurde, um Divergenzen zwischen dem Preis eines Vermögenswerts und dem MACD (Moving Average Convergence Divergence) zu identifizieren. Dieser Indikator zeichnet automatisch die Trendlinien auf den Hoch- und Tiefpunkten des Preises und des MACD und hebt potenzielle Handelsmöglichkeiten hervor. Hauptfunktionen Automatische Divergenz-Erkennung : Der Indikator erkennt automatisch bullische und bärisch
FREE

ملاحظة هامة: تظهر لقطات الشاشة مؤشرين "Suleman Levels" و"RSI Trend V". مؤشر مستويات سليمان هو أداة تحليل احترافية متطورة ومتكاملة. بفضل ما يقارب 9800 سطر من التعليمات البرمجية، يجعل مخططات تحليلك أوضح من أي وقت مضى. إنه ليس مجرد مؤشر. الميزات القوية لـ Suleiman Levels: المربعات الصفراء (كشف التدفقات المالية) - ملاحظة حول المربعات الصفراء: "ميزة مبتكرة وحصرية للمؤشر - طُوّرت من الصفر" : تكشف تدفقات رأس المال من البنوك والمؤسسات المالية في شموع محددة. تُمثّل هذه المربعات الأنشطة المال
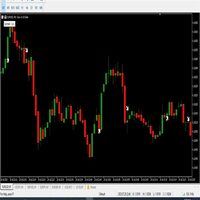
Hallo,
König binäre Sureshot mt5 binäre Indikator,
1 Minute Kerze
1 Minute ablaufen
In Ordnung. Dieser Indikator funktioniert auf MT5 und ist sehr einfach zu bedienen. Wenn Sie ein Signal von ihm erhalten, warten Sie, bis die Kerze mit dem Signal geschlossen ist, und Sie gehen zu Beginn der nächsten neuen Kerze in den Handel. Ein roter Pfeil bedeutet Verkauf und ein grüner Pfeil bedeutet Kauf. Alle Pfeile sind mit einer langen gepunkteten Linie versehen, damit Sie das Handelssignal leicht erk
FREE

Renko ist ein zeitloses Diagramm, dh es berücksichtigt nicht den Zeitraum, sondern die Preisänderung, wodurch die Preisänderung auf dem Diagramm klarer wird.
Hyper Renko ist der Indikator, der dies liefert.
Zum Konfigurieren haben Sie nur einen Parameter, die Größe der Kerze in dem Häkchen *, das Sie verwenden möchten.
* tick: ist die kleinstmögliche Variation eines Vermögenswerts.
Vielen Dank, dass Sie sich für einen Hyper Trader-Indikator entschieden haben.
Wikipedia: Ein Renko-Diagramm
FREE
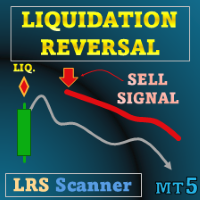
Sonderangebot : ALL TOOLS , nur $35 pro Stück! Neue Tools werden $30 kosten in der ersten Woche oder für die ersten 3 Käufe ! Trading Tools Channel on MQL5 : Treten Sie meinem MQL5-Kanal bei, um die neuesten Nachrichten von mir zu erhalten Liquidation Reversal Signals ist ein Indikator, der entwickelt wurde, um gerichtete Liquidationsphasen zu markieren und Umkehrpunkte zu bestätigen durch die Kombination von Z-Score-Volumenextremen mit Supertrend-Zustandswechseln

Der Worktime-Indikator hilft Ihnen, die wichtigsten Tageszeiten für den Handel mit Währungspaaren zu ermitteln. Es wurde auf der Grundlage der IKT-Day-Trading kostenlose Tutorials, die frei vailable auf seinem youtube-Kanal sind erstellt. Sie können diesen Indikator zusammen mit meinen anderen Indikatoren verwenden, die ich frei mit Ihnen geteilt habe, wie der wahre Tag, benutzerdefinierte Perioden, täglicher Monat, wöchentliche offene Linien - sie ergänzen sich gegenseitig sehr gut.
Nuggets au
FREE

Der MACD 2-Linien-Indikator ist eine leistungsstarke, aktualisierte Version des klassischen Moving Average Convergence Divergence (MACD)-Indikators.
Dieses Tool ist die Verkörperung von Vielseitigkeit und Funktionalität und kann sowohl Anfängern als auch fortgeschrittenen Händlern umfassende Markteinblicke liefern. Der MACD 2-Linien-Indikator für MQL4 bietet eine dynamische Perspektive der Marktdynamik und -richtung durch klare, visuell überzeugende Charts und Echtzeitanalysen.
Metatrader4 Vers
FREE

Easy Trend ist, wie der Name schon sagt, ein Indikator, der auf einfache Weise den vorherrschenden Trend anzeigt, indem er mehrere Indikatoren in einem vereint. Die Strategie lautet: Wenn alle Indikatoren in dieselbe Richtung zeigen, wird ein Signal ausgelöst. Wenn sie rot sind, ist das ein Signal zum Verkaufen, wenn sie blau sind, ein Signal zum Kaufen. So einfach ist das :) Es gibt insgesamt 9 Indikatoren: Gleitender Durchschnitt, RSI, CCI, Parabolic SAR, William's Range, Stochastic, MACD, ADX

Stargogs Spike Catcher V4.0 Dieser Indikator wurde entwickelt, um die BOOM und CRASH Indizes zu melken.
funktioniert jetzt auch auf weltrade für PAIN und GAIN Indizes. Senden Sie mir eine Nachricht, wenn Sie Hilfe mit dem Indikator benötigen. ÜBERPRÜFEN SIE DIE STARGOGS SPIKE CATCHER EA/ROBOT V3: KLICKEN SIE HIERALSO ÜBERPRÜFEN SIE DIE ZWEITE ZU NONEFX SPIKE CATCHER: KLICKEN SIE HIER STARGOGS SPIKE CATCHER V4.0 WAS NEUES! Brandneue Strategie. Dies ist der Indikator, den Sie für 2025 brauchen. N

Kostenloser Indikator für Metatrader 5, der für jede der Marktsitzungen "London, New York und Tokio" ein rechteckiges Feld anzeigt. Die Zeitzone kann automatisch oder über einen Offset-Wert eingestellt werden. Konfigurationsparameter für jede der Sessions. Sichtbar / Nicht sichtbar Startzeit Endzeit Voller oder transparenter Rahmen. Stil des Kastenrandes. Dicke des Kastenrandes. Farbe.
FREE
Ist Ihnen bekannt, warum der MetaTrader Market die beste Plattform für den Verkauf von Handelsstrategien und technischer Indikatoren ist? Der Entwickler braucht sich nicht mit Werbung, Programmschutz und Abrechnung mit Kunden zu beschäftigen. Alles ist bereits erledigt.
Sie verpassen Handelsmöglichkeiten:
- Freie Handelsapplikationen
- Über 8.000 Signale zum Kopieren
- Wirtschaftsnachrichten für die Lage an den Finanzmärkte
Registrierung
Einloggen
Wenn Sie kein Benutzerkonto haben, registrieren Sie sich
Erlauben Sie die Verwendung von Cookies, um sich auf der Website MQL5.com anzumelden.
Bitte aktivieren Sie die notwendige Einstellung in Ihrem Browser, da Sie sich sonst nicht einloggen können.