YouTubeにあるマーケットチュートリアルビデオをご覧ください
ロボットや指標を購入する
仮想ホスティングで
EAを実行
EAを実行
ロボットや指標を購入前にテストする
マーケットで収入を得る
販売のためにプロダクトをプレゼンテーションする方法
MetaTrader 5のためのテクニカル指標 - 9

The Volume Weighted Average Price is similar to a moving average, except volume is included to weight the average price over a period. Volume-Weighted Average Price [VWAP] is a dynamic, weighted average designed to more accurately reflect a security’s true average price over a given period . Mathematically, VWAP is the summation of money (i.e., Volume x Price) transacted divided by the total volume over any time horizon, typically from market open to market close.
VWAP reflects the capitali
FREE

Spike Trap is a simple but powerful tool that identifies sharp market spikes and waits for price pullbacks to highlight high-probability entry and exit zones. By combining volatility detection with smart retracement logic, it helps traders capitalize on fast price moves with precision and reduced risk. Ideal for scalping or long-term trading in volatile markets. Spike Trap can be used to trade synthetic indices such as Boom and Crash offered by Deriv Broker as well as Pain and Gain indices offer

40% off. Original price: $50 (Ends on February 15)
Advanced Bollinger Bands Scanner is a multi symbol multi timeframe Bollinger bands dashboard that monitors and analyzes the Bollinger Bands indicator from one chart. This panel scans the Bollinger bands indicator in up to 28 configurable instruments and 9 timeframes for price overbought/oversold, price consolidation (Bollinger bands squeeze), and consolidation breakout (squeeze break) with a deep scan feature to scan all market watch symbols

Multi-Currency Strength Dashboard PRO MT5 (v2.6) – 通貨強弱メーター(視覚ダッシュボード付き) Multi-Currency Strength Dashboard PRO は MetaTrader 5 用のインジケーターで、 8つの主要通貨 (USD, EUR, GBP, JPY, CHF, CAD, AUD, NZD)の相対的な強弱をリアルタイムに算出し、最大 28 通貨ペア (ブローカーで利用可能なシンボルに依存)を分析します。 本ツールの目的は、通貨の強さ/弱さを素早く整理して表示し、 分析対象のペア選定 (強い通貨 vs 弱い通貨)をサポートし、強弱差が小さい組み合わせをフィルタリングしやすくすることです。 主な機能 チャート上の視覚ダッシュボード (0–100 に正規化された強弱バー表示)。 最大 28 ペアの分析 (自動リスト作成、必要に応じてブローカー接尾辞にも対応)。 Best Pairs (注目ペア)を、設定可能な最小強弱差に基づいて表示。 Worst Pairs (強弱差が小さいペア)を表示し、フィルタリングを補助。

Ichimoku Trend Alert is the Ichimoku Kinko Hyo indicator with Alerts and signal filters.
Ichimoku Trend Alert features: Optional check of Ichimoku cloud, Tenkan sen(Conversion Line), Kijun sen(Base Line), Senkou span A, Senkou span B, and Chikou span relative to price, and more. Popup, email, and phone notification alerts for selected symbols and timeframes.
There are 9 classic Ichimoku trend filters you can enable/disable in settings: Price/Cloud Order: Checks the price position relative to
FREE

Peak Trough Analysis is the great tool to detect peaks and troughs in your chart. Peak Trough Analysis tool can use three different peaks and troughs detection algorithm. The three algorithm include the orignal Fractals Indicator by Bill Williams, the Modified Fractals indicator and ZigZag indicator. You can use this peak and trough analysis tool to detect the price pattern made up from Equilibrium Fractal-Wave process. For further usage, there are good guide line on how to use this peak trough
FREE

This is the Cumulative Volume Delta (CVD) , it's an indicator that calculates the long and short volumes plotting it then as a line on the chart, the most efficient way to use this indicator is by comparing the CVD line to the current chart and looking at the Divergence beetween the two of them, so that you can identify fake-outs and liquidty sweeps. for example in the picture that i put below you can see that the price has made a lower low but the CVD didn't, that means the volumes didn't suppo
FREE

高度な経済カレンダーインジケーター このインジケーターは、選択した通貨ペアまたは取引銘柄に関連するすべての今後の経済イベントをチャート上に直接表示します。高ボラティリティのタイミングを事前に把握し、より正確に取引戦略を立てることができます。 主な機能 最大 5日先 までの経済イベントを表示(カスタマイズ可能)。 ニュースの影響度 (高・中・低)によるフィルタリング。 垂直ライン や 番号付きマーカー の表示を選択可能。 ニュースの重要度を区別するための色を自由に設定可能。 主要な 世界通貨 (USD, EUR, GBP, JPY, CNY, AUD, CAD, NZD, CHF など)に自動・手動対応。 主要な 世界指数や金融商品 を自動認識(SP500, NASDAQ, DAX, FTSE, CAC40, 日経225, ハンセン指数, Eurostoxx, IBEX, MIB など)。 日付・時間・通貨・影響度・イベント名 を表示する内蔵イベントテーブル。 イベントが重なった場合も、マーカーを自動調整して見やすさを確保。 利用する理由
このインジケーターは、FX、株価指数、コモディ
FREE

Custom Spread Indicator *Please write a review, thanks!
Also MT4 version is available
Spread Indicator show the current spread in pips with color codes. Handle 3 levels, Low, Medium, High. You can set levels and colors for each level (eg. Low: Green, Medium: Orange, High: Red), and can choose display position on the chart.
There is two spread calculation mode: -> Server spread value -> Ask - Bid value
Can set opacity, for better customization. When spread jump bigger, then display do not
FREE
Fractals_Price Indicator Description
The Fractals_Price indicator is a technical analysis tool that identifies fractal patterns on price charts. Fractals are recurring patterns that signal potential trend reversals or continuation points. This indicator marks both upward and downward fractals with colored arrows and can display price labels at these points.
Key Features Identifies upward fractals (magenta arrows) marking potential resistance levels Identifies downward fractals (blue arrows)
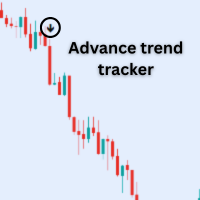
Features: 1. Buy arrows= when Up trend start. 2.Sell arrows = when Down trend start 3.Alert System= when Signal appear then Mt5 itself Pop up a alert Box. 4. You can get notifications on your phone real time through Mt5 app.
Note: this indicator will work on trending market. So try to trade volatile market.
Best Pair: Only trade in New York session NASDAQ (US100) S&P ( US500) Dow Jones (US30)
Note : Don't Trade Forex pair.
FREE

ご紹介 Quantum Breakout PRO は 、ブレイクアウト ゾーンの取引方法を変革する画期的な MQL5 インジケーターです。 13年以上の取引経験を持つ経験豊富なトレーダーのチームによって開発されました。 クォンタム ブレイクアウト プロ は、革新的でダイナミックなブレイクアウト ゾーン戦略により、あなたのトレーディングの旅を新たな高みに押し上げるように設計されています。
クォンタム ブレイクアウト インジケーターは、5 つの利益ターゲット ゾーンを備えたブレイクアウト ゾーン上のシグナル矢印と、ブレイクアウト ボックスに基づいたストップロスの提案を提供します。
初心者トレーダーにもプロのトレーダーにも適しています。
量子EAチャネル: ここをクリック
重要!購入後、インストールマニュアルを受け取るためにプライベートメッセージを送ってください。
推奨事項:
時間枠: M15 通貨ペア: GBPJPY、EURJPY、USDJPY、NZDUSD、XAUUSD アカウントの種類: ECN、Raw、またはスプレッドが非常に低い R

Introducing Order Blocks Breaker , a brand-new way to identify and leverage order blocks in your trading strategy. After developing multiple order block tools with unique concepts, I’m proud to present this tool that takes things to the next level. Unlike previous tools, Order Blocks Breaker not only identifies order blocks but also highlights Breaker Order Blocks —key areas where the price is likely to retest after a breakout. MT4 - https://www.mql5.com/en/market/product/124101/ This t

Introducing Indicator for PainX and GainX Indices Traders on Weltrade Get ready to experience the power of trading with our indicator, specifically designed for Weltrade broker's PainX and GainX Indices. Advanced Strategies for Unbeatable Insights Our indicator employs sophisticated strategies to analyze market trends, pinpointing optimal entry and exit points. Optimized for Maximum Performance To ensure optimal results, our indicator is carefully calibrated for 5-minute timeframe charts on

Royal Scalping Indicator is an advanced price adaptive indicator designed to generate high-quality trading signals. Built-in multi-timeframe and multi-currency capabilities make it even more powerful to have configurations based on different symbols and timeframes. This indicator is perfect for scalp trades as well as swing trades. Royal Scalping is not just an indicator, but a trading strategy itself. Features Price Adaptive Trend Detector Algorithm Multi-Timeframe and Multi-Currency Trend Low

MTF SuperTrend Confluence: Precision Trend Analysis Across Multiple Timeframes Tired of conflicting signals and market noise on a single timeframe? Gain a decisive trading edge by seeing the bigger picture. The MTF SuperTrend Confluence indicator is your all-in-one solution for high-probability trend analysis, meticulously engineered to filter out uncertainty and pinpoint powerful market movements. This powerful tool plots up to three fully customizable SuperTrend indicators from different timef
ICONIC Reversal Engine Quality over quantity. Trade only the reversals that matter. The Problem: Noise, Overload, False Signals Most indicators flood charts with arrows but ignore context.
A hammer in a strong downtrend is irrelevant. An engulfing without volume is a trap.
Result: analysis paralysis, missed moves, costly errors. The Solution: Your Analytical Co-Pilot The ICONIC Reversal Engine is not “just another arrow.” It explains why a setup matters.
Every signal is stress-tested through a
FREE

100 % PER MONTH PROFIT---- MY NEW SIGNAL HERE -------> https://www.mql5.com/en/signals/2162238?source=Site+Signals+My#
The Commodity Channel Index (CCI) measures the current price level relative to an average price level over a given period of time. CCI is relatively high when prices are far above their average. CCI is relatively low when prices are far below their average. Using this method, CCI can be used to identify overbought and oversold levels.
You can set the period of CCI.
The indi

This is Heiken Ashi smoothed version, where you can choose on what type smoothness you want to make your strategy base. You can choose between EMA or MA, on the period you want. And you can choose colors.
Definition:
The Heikin-Ashi technique averages price data to create a Japanese candlestick chart that filters out market noise. Heikin-Ashi charts, developed by Munehisa Homma in the 1700s, share some characteristics with standard candlestick charts but differ based on the values used to cre
FREE

Gym Bro Strategy is a technical indicator based on the classic Weekly Pivot Point system. It is designed to assist traders in identifying trend direction, potential entry zones, and risk management levels using a fitness-themed visualization interface. The name "Gym Bro" refers to the indicator's unique visual metaphor, which categorizes market trends into "Bulking" (Upward Momentum) or "Cutting" (Downward Momentum) phases. This thematic approach simplifies complex price action into clearly def
FREE

This indicator displays Pivot-Lines, preday high and low, preday close and the minimum and maximum of the previous hour. You just have to put this single indicator to the chart to have all these important lines, no need to setup many single indicators.
Why certain lines are important Preday high and low : These are watched by traders who trade in a daily chart. Very often, if price climbs over or falls under a preday low/high there is an acceleration in buying/selling. It is a breakout out of a
FREE

Fractal Model Indicator for Metatrader , meticulously crafted around the renowned Fractal Model by TTrades. This powerful tool empowers traders to navigate price action with precision, leveraging multi-timeframe analysis to anticipate momentum shifts, swing formations, and trend continuations. Designed for MetaTrader , the Fractal Model Indicator combines advanced algorithmic insights with customizable features, making it an essential addition for traders seeking to capitalize on expansive mar

This is a derivative of John Carter's "TTM Squeeze" volatility indicator, as discussed in his book "Mastering the Trade" (chapter 11).
Gray dot on the midline show that the market just entered a squeeze (Bollinger Bands are with in Keltner Channel). This signifies low volatility, market preparing itself for an explosive move (up or down). Blue dot signify "Squeeze release".
Mr.Carter suggests waiting till the first blue after a gray dot, and taking a position in the direction of the moment
FREE

Line Profit 預金通貨での利益の視覚的な線の指標。インジケーターがインストールされているシンボルの市場にオープンポジションがある場合にのみ機能します。マウスで行を移動するか、入札価格の自動追跡を有効にすることができます。 インジケーター設定の説明: colotLine-線の色 WidthLine-線幅 colotText-テキストの色 FontSize-テキストの高さ アンカー-テキストのアンカーメソッド FollowBid-入札価格に従ってください 預金通貨での利益の視覚的な線の指標。インジケーターがインストールされているシンボルの市場にオープンポジションがある場合にのみ機能します。マウスで行を移動するか、入札価格の自動追跡を有効にすることができます。
FREE

Understanding the levels of the previous day or week is very important information for your trading.
This indicateur allow to draw Previous day High/Low Previous week High/Low
Congifuration High & Low for: Previous day, week Line Style, color Label position, size, color Any questions or comments, send me a direct message here https://www.mql5.com/en/users/mvonline
FREE

Bar Countdown is a simple indicator for MetaTrader 5 that shows the time remaining of the each candle. It can be placed in any corner of the chart or near of the price close and it'll help you to know
if the current candle is ending. Choose the counter format between HR:MIN:SEC and MIN:SEC It is so easy to use, configure the color, size and counter position on the chart and that's it!!! The Countdown starts now!
Updates: 2021/02/28; v1.0: Initial release 2021/03/16; v1.1: Minor code changes
FREE

# Wave Trend Oscillator (WTO) User Guide
## Overview Wave Trend Oscillator is a powerful technical analysis tool used to analyze price momentum and trend direction. It visualizes market conditions using two main lines (WT1 and WT2) and a histogram.
## Components 1. **WT1 (Green Line)**: Main trend indicator 2. **WT2 (Red Line)**: Signal line 3. **Histogram (Blue)**: Shows the difference between WT1 and WT2 4. **Arrows**: Mark crossover points - Green Arrow: WT1 crosses above WT2 (Buy signa

RSI Entry Points is the upgrade of the standard RSI indicator to avoid lagging. Indicator draws the clouds and the arrows to have clear picture where price is and what to wait for. Why standard RSI is lagging? because mostly we do not use it correctly and it is with very weak visual flexibility, less informativity. With my current upgrade I tried to Fix both problems same time and I got much better results and more exact entries than standard RSI has. To make yourself sure check out the screens

このインジケーターは、さまざまなタイムスケールでの多くのチャートのレビューをより迅速かつ簡単に行えるように設計されています。 複数のチャートで時間と価格を追跡 1 つのチャートでシンボルを変更すると、同じシンボルの他のすべてのチャートも変更されます。 使いやすく、すぐにマスターできます このインジケーターを使用すると、同じシンボルで開いている他のすべてのチャートで、マウス ポインターが現在のチャートにある価格と時間を特定できます。これにより、複数のチャートで情報をすばやく確認できますが、通常は同じ場所を特定するのに時間がかかります。 開いているすべてのチャートで時間だけを追跡することもできます。これにより、発散ハンティング時に簡単にナビゲートできます。 1 つのチャートでシンボルを変更すると、同じシンボルの他のすべてのチャートが新しいシンボルに切り替わり、時間枠の設定が維持されます。 使い方
チャートを確認するとき、傾向と取引レベルを特定するために、いくつかの時間枠を見るのが好きです。このツールを作成したのは、それを支援するためであり、長期にわたっていくつかのチャートを見渡すビジュアル
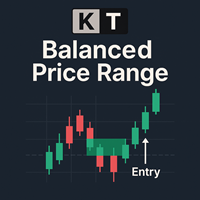
KT Balanced Price Rangeは、連続する反対方向の フェアバリューギャップ(FVG) の重なり合った領域をハイライトします。この概念はBalanced Price Range(BPR)として知られており、プライスアクショントレーダーの間で人気があり、特にSmart Money Concepts(SMC)やInner Circle Trader(ICT)の手法に従うトレーダーによく使用されます。 トレーダーは、これらのBPRゾーンを高確率のトレードセットアップとして使用することが多く、特にプルバック時やトレンド継続の局面で活用されます。BPRゾーンは、市場が反転したり、トレンドを継続したり、ブレイクアウトする可能性がある重要なエリアとして機能するため、エントリーやイグジットのタイミングを取る上で役立ちます。
特徴
完全なFVGの重なりのみを使用して、Balanced Price Range(BPR)ゾーンを特定するためにゼロから設計されており、質の高いトレード機会を提供します。 重要でないゾーンを除外するために、BPRのパーセンテージ閾値をカスタマイズ可能です。 各セ

Introduction to Double Harmonic Volatility Indicator Use of the Fibonacci analysis for financial trading can nearly go back to 85 years from today since the birth of Elliott Wave Theory by R. N. Elliott. Until now, traders use the Fibonacci analysis to identify the patterns in the price series. Yet, we could not find any one attempted to use Fibonacci analysis for the Volatility. Harmonic Volatility Indicator was the first technical analysis applying the Fibonacci analysis to the financial Volat

This indicator significantly expands the capabilities of the usual ZigZag due to the addition of parabolic channels at the earliest stage of their origin. Download the demo version and test it in the tester. All graphics in the tester are working. But the ZigZag algorithm is special here, because it is implemented on a unique author's ultrafast loop-less algorithm for calculating parabolic regression and calculating its standard deviation. The features of this ZigZag are: Fast calculation, rega

LinReg (5-Line Regression Channel) — Free Indicator LinReg draws a five-line linear regression channel to visualize trend structure and price deviation. What makes this version different This release is a Market-validation-safe build : Optimized to avoid heavy processing during Strategy Tester multi-symbol validation. Focused on stable performance and clean plotting without slowdowns. Visual structure (5 lines) 2 Blue lines (outer bounds) 1 Red line (regression midline) 2 Purple lines (inner bou
FREE

このインジケーターは、価格チャート上にフラクタルを表示し、トレーダーが重要な局所的な高値・安値を特定するのに役立ちます。フラクタルとは、クラシックな定義に基づいた特別なポイントであり、中央のローソク足が両隣の2本のローソク足よりも高い場合に局所的な高値が形成され、中央のローソク足が両隣の2本よりも低い場合に局所的な安値が形成されます。 その他の製品 -> こちら 主な機能と利点 : 柔軟な表示 — インジケーターは、上位・下位のフラクタルを円、四角形、三角形などのさまざまなシンボルで視覚化できます。 カスタマイズ可能な色 — チャート上の視認性を向上させるためにカラースキームを調整できます。例えば、上昇フラクタルを緑、下降フラクタルを赤に設定することが可能です。 調整可能なオフセット — 垂直方向のオフセットを設定することで、フラクタルマーカーを適切に配置し、ローソク足との重なりを避けることができます。 すべての時間枠に対応 — インジケーターは、1分足(M1)から月足(MN)まで、すべての時間枠で正しく動作するため、汎用的なツールとして使用できます。 あらゆる金融資産に適用可能 —
FREE

MACDヒストグラム改良版(市場の勢い変化の監視用) MT5標準のMACDインジケーターは、 MACDライン自体の値 を使用してヒストグラムを作成します。急速な変動やレンジ相場では、これらのヒストグラムは変化が遅く、多空の勢いの加速や減速を直感的に把握しにくいことがあります。特に価格がまだ明確な反転を示していない場合、シグナルが遅れます。 このバージョンでは、従来の MACDヒストグラム定義 を使用しています: ヒストグラム = MACD − Signal これにより、 買い・売りの勢いの変化 をより敏感に捉えることができ、トレーダーは傾向の加速・減速を視覚的に確認できます。ヒストグラムが負のゾーン(売り勢力)から正のゾーン(買い勢力)に移行する際、標準MACDよりも早くトレンドの潜在的な動きを示します。 注意事項 : 本インジケーターは 独立した取引システムではなく 、自動で売買を行うものではありません 価格を予測するものではなく 、あくまで勢いを観察するためのツールです サポート・レジスタンスやトレンド構造、他のインジケーターと組み合わせて使用することを推奨 します 本インジケータ
FREE

Crypto_Forex MT5用インジケーター「ダイナミック売られ過ぎ/買われ過ぎゾーン付きCCI」(リペイント機能なし)
- コモディティ・チャネル・インデックス(CCI)は、トレンド方向へのモメンタムトレードに最適です。 - ダイナミック買われ過ぎゾーンからの売りエントリー、およびダイナミック売られ過ぎゾーンからの買いエントリーを、主要トレンド方向へ行うのに最適です。 - このインジケーターは、プライスアクションエントリーと組み合わせるのも効果的です。 - ダイナミック買われ過ぎゾーン - 黄色線より上。 - ダイナミック売られ過ぎゾーン - 青線より下。 - CCIオシレーターは、現在価格と過去平均価格の差を測定します。 - PCおよびモバイルアラート機能付き。
高品質のトレーディングロボットとインジケーターをご覧になるにはここをクリックしてください! これは、このMQL5ウェブサイトでのみ提供されるオリジナル製品です。
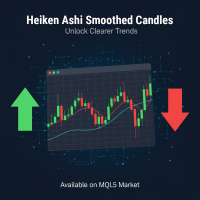
Heiken Ashi Smoothed インジケーター (MT5用) ノイズ除去+スムージング機能付きHeiken Ashi。偽シグナルを削減し、トレンドを早期発見。Forex・指数・暗号資産に最適 (H1-D1推奨)。 仕組みとスムージング方法 従来のHeiken Ashiは、過去の始値・終値・高値・安値を平均化してローソク足を計算し、小さな変動の影響をすでに軽減しています。しかし、 Heiken Ashi Smoothed は「生の」価格(raw)に追加のスムージングフィルターを適用してこのアプローチを向上させます。直接価格ではなく、移動平均(EMAまたはSMA、設定可能)を使用して入力データを処理し、より安定した流動的なトレンドを表すローソク足を生成します。 このスムージングプロセスは2段階で行われます: 基本Heiken Ashi計算 :価格を平均化して初期ローソク足を形成。強気ローソク(通常緑または白)は上昇トレンド、弱気(赤または黒)は下降トレンドを示します。 再帰的スムージング :結果に移動平均を適用し、異常なピークを除去して価格運動のより線形な表現を作成。一時的なボラ
FREE

このインジケーターは、MetaTrader 4 および 5 用のインタラクティブなエリオット波動ラベリングツールです。
チャート上のメニューから、ラベルのサイズ、色、波動の種類(ABC修正波、5波のインパルス、またはWXY構造)を選択し、チャート上に直接波動ラベルを手動で配置することができます。
チャートを1回クリックするだけで、選択した価格と時間の位置に適切な波動ラベルが順番に配置され、エリオット波動構造を視覚的に整理・把握するのに役立ちます。 気に入ったら評価してください! このインジケーターは、MetaTrader 4 および 5 用のインタラクティブなエリオット波動ラベリングツールです。
チャート上のメニューから、ラベルのサイズ、色、波動の種類(ABC修正波、5波のインパルス、またはWXY構造)を選択し、チャート上に直接波動ラベルを手動で配置することができます。
チャートを1回クリックするだけで、選択した価格と時間の位置に適切な波動ラベルが順番に配置され、エリオット波動構造を視覚的に整理・把握するのに役立ちます。 気に入ったら評価してください!
FREE

Ulimate MTF Support & Resistance - 5 Star Best Seller New Year Sale - save $20 (normal price $79) Beginner or Professional our best selling multi-timeframe Pivot Prof will enhance your trading and bring you great trade opportunities with the Support and Resistance levels that professionals use. Pivot trading is a simple effective method for entering and exiting the market at key levels and has been used by professionals for decades and works on all symbols: Forex, Crypto, Stocks, Indicies et

This is a simple order block locator. Searched for the existence of order blocks only at extremums. If you want multi criteria order block location check my other indicator which is more powerful here These order blocks are ICT order blocks without any buttering.
The indicator can be a useful tool for detecting reversals, continuations. You can also use the indicator as confluence with your other tools
FREE

Spike Phantom is a specialized indicator for PainX and GainX synthetic indices that generates trading signals with automatic alert notifications.
Features The indicator analyzes market conditions using proprietary algorithms and displays buy/sell arrows directly on the chart. It works specifically with PainX and GainX indices on M5 timeframe. Signal generation combines multiple technical analysis methods to identify potential trading opportunities. The system provides two TP levels and SL cal

マトリックスアローインジケーターマルチタイムフレームパネルMT5 は無料のアドオンであり、マトリックスアローインジケーターMT5の優れた資産です。これは、5つのユーザーがカスタマイズした時間枠と合計16の変更可能なシンボル/機器の現在のマトリックスアローインジケーターMT5信号を示しています。ユーザーは、マトリックスアローインジケーターMT5で構成される10の標準インジケーターのいずれかを有効/無効にするオプションがあります。マトリックスアローインジケーターMT5のように、10の標準インジケーター属性もすべて調整可能です。マトリックスアローインジケーターマルチタイムフレームパネルMT5には、16個の変更可能なシンボルボタンのいずれかをクリックすることで、現在のチャートを変更するオプションもあります。これにより、異なるシンボル間ではるかに高速に作業でき、取引の機会を逃すことはありません。
この無料の マトリックスアローインジケーターマルチタイムフレームパネルMT5 アドオンを使用する場合は、ここでマトリックスアローインジケーターMT5を別途購入する必要があります: https://w
FREE

MT5用アンカードVWAP(AVWAP) Anchored VWAP for MT5 でチャート分析を次のレベルへ引き上げましょう。これは、 重要な価格レベルを正確、迅速、かつ明確に分析したいトレーダー向け に設計された、強力かつ柔軟なツールです。このインジケーターは、TradingView と同様の機能を持ち、MT5 に最適化された機関レベルの VWAP 分析を提供します。 主な機能 チャートごとに複数のアンカー: 必要なだけ AVWAP ラインを追加可能。各ラインに独自の開始日時を設定。 カスタム開始ポイント: 各 VWAP を特定のセッション、日、または重要な市場イベントに合わせてアンカー可能。 直感的なユーザーインターフェース: 設定が簡単で、初心者から上級者まで利用可能。 多用途トレーディング: デイトレード、スイングトレード、長期戦略に最適。 動的サポート&レジスタンス: トレンドや反転ポイントを迅速に把握し、複雑な設定なしで情報に基づくトレード判断が可能。 TradingView 風の機能: TradingView の AVWAP 機能を再現しつつ、MT5 の実行力を活用
FREE

Donchian Channel is an indicator created by Richard Donchian. It is formed by taking the highest high and the lowest low of the last specified period in candles. The area between high and low is the channel for the chosen period.
Its configuration is simple. It is possible to have the average between the upper and lower lines, plus you have alerts when price hits one side. If you have any questions or find any bugs, please contact me. Enjoy!
FREE

Cybertrade Auto Fibonacci retraction and projection - MT5
Auto Fibonacci is an indicator that automatically plots the Fibonacci retracement and projection based on the number of bars you select in the indicator setting. You can customize nine different levels of retraction and three levels of projection. It works on periods longer than the period visible on the chart. All values are available in the form of buffers to simplify possible automations. This indicator is the same one we use in ou
FREE

This indicator shows the TLH and TLL and some trendlines that allow us to estimate the trend of market. It also shows the values of the angles of the lines in percentage in points (pip) , the standard deviation, and the trend of each line, and when it breaks the lines of support and resistance (TLH and TLL). And finally, it also shows the points identified as supports and resistances through the fractal algorithm in the graph. The high and low trend lines are supported by the highs and lows, th
FREE
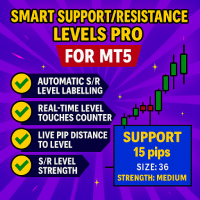
MetaTrader 5向け強化サポート/レジスタンスレベル情報インジケーター 強化サポート/レジスタンスレベル情報インジケーター と出会いましょう!これは、重要なS/R(サポート/レジスタンス)情報をリアルタイムで視覚化する究極のチャート companion です。このMT5ツールは、あなたの手動で配置した水平線に重要なS/Rメトリック—サポート/レジスタンスの分類、タッチ数、リアルタイムのピップ距離、レベルの強さ、歴史的な年齢—を自動的にラベル付けし、各レベルの下にコンパクトにまとめて表示します。 トレーダーによる、トレーダーのためのこのツールは、あなたが手動で配置したレベルを、アクション可能な情報豊富な表示に変換し、トレードを効率化し、数秒で意思決定を向上させる設計です。 機能概要 強化S/R情報インジケーターは、自信を持ってトレードするためのスマートな機能を満載しています: 自動レベル情報
すべてのOBJ_HLINE水平線を即座に識別し、それぞれをサポートまたはレジスタンスレベルとして分類—手動でのタグ付けは不要です。 詳細なレベルメトリック
各線に対して、価格のタッチ数、

このインジケーターで市場の深い洞察を解き放ちましょう。NelogicaのProfitのビジュアルブックにインスパイアされた、チャート上にビジュアルオーダーブックを表示します。買い注文(青)と売り注文(赤)のボリュームを水平バーで表示し、大きなボリュームは黄色で強調表示され、高流動性ゾーンの特定を容易にします。価格は注文が最も集中しているエリアに向かう傾向があり、サポートやレジスタンスレベルの特定に不可欠なツールです。完全にカスタマイズ可能な設定により、あらゆるトレードスタイルに適応でき、リアルタイム更新により市場の動向を常に把握できます。MetaTrader 5でのFX、株式、その他の市場分析に最適です。このインジケーターは使いやすく、市場のブレイクアウトや反転の機会を捉えるのに役立ちます。ブローカーから市場深度(オーダーブック)データの提供が必要です。今すぐダウンロードして、明確で実践的な分析でトレードを強化しましょう!
FREE

Ritz Smart OHLC Candle + Dual-Timeframe RSI Sentiment Analysis Ritz Smart OHLC Candle is an advanced price-action candle indicator that enhances standard OHLC candles with smart momentum analysis, volatility validation, and directional bias filtering — all displayed directly through candle colors. This indicator is designed for traders who want clean charts, early momentum detection, and reduced false signals, without adding extra lines or panels. Main Features Smart OHLC Strength Analysis, Ev

Haven Bands Reversion – 平均回帰トレーディングのためのプロフェッショナルインジケーター 平均回帰戦略を使用するトレーダーのために設計された、強力で正確なツール Haven Bands Reversion をご紹介します。従来のボリンジャーバンドとは異なり、このインジケーターは 出来高加重移動平均線(VWMA) に基づいており、チャネルが実際の市場活動により敏感に反応します。最も重要なのは、このインジケーターが リペイントしないシグナル を生成し、信頼性の高いエントリーポイントを提供することです。 私の他の製品はこちら -> こちら . 価格がその「公正な」価値からどれだけ逸脱したかを理解することは、反転や調整での取引を成功させるための鍵です。Haven Bands Reversionはこれらの瞬間を自動的に特定し、価格が動的なボラティリティチャネル内に戻ったときに明確なシグナルを発します。 なぜVWMAは標準のSMAより優れているのか? すべてのローソク足を平等に扱う単純移動平均線(SMA)とは異なり、 VWMAは出来高の多いローソク足に大きな重み を置きます
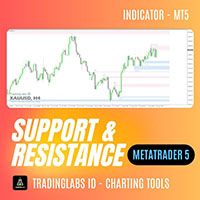
Classic Support & Resistance Tired of drawing support and resistance levels manually?
Now you can save time and trade with confidence using the Classic Support & Resistance Indicator. This tool automatically plots key support and resistance zones on your MT4 chart with high accuracy and clean visualization. Designed especially for traders who rely on Breakout – Retest Entry strategies and market structure analysis. Key Features: Auto Support & Resistance Zones
Automatically identifies and plots

This indicator draws price channels. Easy to use. It has various settings, for example, you can configure it to show channels only for buy or sell, you can display trend lines instead of channels. There are many trading strategies that are based on trading in channels, you can trade on the rebound from the borders of the channels, or the breakdown of the channel. Parameters History - the maximum number of bars for building channels; Distance - the minimum distance from one maximum (or minimum

The SMC ICT Indicator integrates the key concepts of Smart Money Concepts and Inner Circle Trader into a practical and precise tool.
It displays essential levels and patterns on the chart for clear analysis according to the ICT approach.
Optimized for agile processing, it allows smooth backtesting with no repainting, freezes, or delays—ensuring precision and efficiency in your trading.
Included Concepts It includes Fair Value Gap (FVG), Order Blocks, Imbalance, Gap, Equal High and Equal Low, a
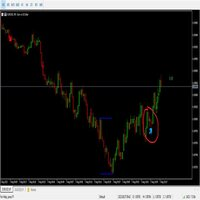
King Binary Profit System
1 minute candle
3-4 minute expire
Alright. This indicator works on MT5 and is very easy to use. When you receive a signal from it, you wait for that candle with the signal to close and you enter your trade at the beginning of the next new candle. A red arrow means sell and a green arrow means buy. All arrows comes with a long dotted like for easy identification of trade signal. Are you okay with that?

This indicator finds and displays the Double Bottom and Double Top technical analysis patterns. Signals (displays a message on the screen) if the shape was formed recently. Often after the appearance of these patterns, the trend reverses or a correction occurs. In order not to search for them yourself, or not to miss their appearance, it is enough to add an indicator to the chart. The indicator can be used on different timeframes and currency pairs, there are settings for a better search on a c
FREE

Koala FVGをMT5にご紹介します。プロフェッショナルなFair Value Gap(FVG)パターンインジケーターです。 Koala FVG: MT5で精密トレードへの道 Fair Value Gap(FVG)パターンの可能性を解き放つKoala FVG。これはMetaTrader 5向けに設計された最先端のインジケーターです。期間限定で、このプロフェッショナルツールに無料でアクセスできます。プレミアムインジケーターに移行する前にお試しください。 主な特徴: FVGパターンの検出: Koala FVGは、カスタマイズ可能な最小および最大サイズの基準に基づいて、資格のあるFVGパターンを知的に識別します。 ビジュアル表現: FVGゾーンを示すダイナミックな四角形を含む、クリアなグラフィカルディスプレイで視覚的な明瞭さを体験してください。三本のラインがFVGレベルをハイライトし、精密な分析が可能です。 矢印エントリーシグナル: トレードの機会を見逃さないでください。Koala FVGはエントリーポイントの明確な矢印シグナルを提供し、情報を元に意思決定できるようサポートします。 K
FREE

Session Breakout Master is a high-performance trading tool designed to capture explosive moves following the breakout of major trading session ranges (Asia, Europe, and USA). It automatically visualizes volatility zones and utilizes a Moving Average filter to ensure you stay on the right side of the market trend. Key Features: Automated Session Mapping: No more manual drawing. The indicator identifies and plots Asia, Europe, and USA session boxes automatically. Trend Filtering: Built-in MA filte
FREE

Description. The basis for the formation of the Renko chart is the price range. If the price goes beyond its limits, the chart shows a box above or below the previous one. As a result, we see price movement without additional "noise" and important support and resistance levels. Features.
For use in conjunction with the Expert Advisor, an additional buffer is implemented-a box counter. For convenience and to increase the speed of testing, the user can use the "new box" event, which the indicator
FREE
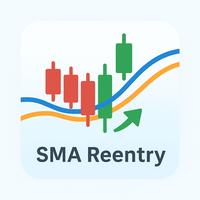
SMA Reentryとは SMA Reentry は、2本の単純移動平均線(SMA)—高速と低速—を利用し、トレンドに沿った再エントリーポイントをシグナルするプロフェッショナル向けインジケーターです。低速SMAで定義されたトレンドの中で、価格が高速SMAを再び上抜け・下抜けしたタイミングを明確に表示します。プルバック(pullback)、ブレイクアウト(breakout)、トレンド回帰シグナルを求めるトレーダーに最適なツールです。 動作原理 高速SMAと低速SMAのクロスにより主要なトレンドを特定 価格が高速SMAを再び上抜け・下抜けした際、矢印でプルバックや再エントリーシグナルを表示し、トレンド継続を確認 期間、ラインや矢印の色、矢印の価格からの距離など、各種入力をカスタマイズ可能 チャート上に2本のSMAを直接表示し、視覚的分析をサポート おすすめユーザー トレンドフォロー戦略を利用したい方、またはプルバック後の最適なエントリーポイントを探す方 ブレイクアウトや再エントリー戦略を利用する方 調整後にトレンド回帰する重要ポイントを見つけたい方 裁量トレーダー、システムトレーダーどち
FREE

バージョン1.3の詳細については、「What's New」をご覧ください。
//+---------------------------------------------------------------------------------------------------------------+ このインジケーターは、市場の重要なスイングポイントを特定するために、価格動向とボリュームの動きを分析するツールとして設計されています。主に日中取引で効果を発揮しますが、他の取引時間でも自由に試すことができます。 概要 このインジケーターは、価格の高値や安値パターンを特定し、大きな価格変動の前兆となる重要なポイントを見つけることを目指しています。 機能 ベアリッシュキャンドルパターン 高値が設定可能な範囲内の一定数(デフォルトでは前5本、後3本)のキャンドルより高い時に特定されます。 特定するためには、さらにユーザーが調整可能な数の減少ボリュームバーが事前に存在する必要があります。 ブルリッシュキャンドルパターン 安値が設定可能な範囲内の一定数(デフォルトでは前5本、後3本)のキャ
FREE

インディケータは、価格とオシレーター/インディケーターの間に発散が発生したときを識別します。これは、通常の分岐と隠れた分岐の両方を識別します。最強のセットアップのみをフィルターで除外できるRSIフィルターオプションがあります。インディケータは、巻き込みフォーメーション、ドンチアンチャネルブレイクアウト、または移動平均を超える価格を待つオプションも提供します (スクリーンショット#3を参照) 貿易機会を知らせる前に発散を確認する。独自のルールとテクニックを組み合わせることで、このインジケーターを使用して、独自の強力なシステムを作成(または強化)できます。 特徴
の終わりに 製品のブログ インジケーターからトレードシグナルを取得するためにiCustom()関数を使用しているサンプルエキスパートアドバイザー(EA)のソースコードをダウンロードすることができます。 EAは完全に機能しますが、主な目的は、コードを使用して、独自に開発したEAに貼り付けることです。 限られた時間で ただし、プログラミングサポートを提供することはできません。 謝罪いたします 次のオシレーター

The Simple ICT Concepts Indicator is a powerful tool designed to help traders apply the principles of the Inner Circle Trader (ICT) methodology. This indicator focuses on identifying key zones such as liquidity levels, support and resistance, and market structure, making it an invaluable asset for price action and smart money concept traders.
Key Features Market Structure: Market structure labels are constructed from price breaking a prior swing point. This allows a user to determine the curren

This wonderful tool works on any pair producing alerts whenever the market enters the overbought and oversold zones of the market. The signals come as BUY or SELL but it does not necessarily mean you should go on and execute order, but that you should begin to study the chart for potential reversal. For advanced signal tools check out some of our premium tools like Dual Impulse.
FREE

ピボット取引:
1.ppピボット
2. r1 r2 r3、s1 s2 s3 Necessary for traders: tools and indicators Waves automatically calculate indicators, channel trend trading Perfect trend-wave automatic calculation channel calculation , MT4 Perfect trend-wave automatic calculation channel calculation , MT5 Local Trading copying Easy And Fast Copy , MT4 Easy And Fast Copy , MT5 Local Trading copying For DEMO Easy And Fast Copy , MT4 DEMO Easy And Fast Copy , MT5 DEMO
協力QQ:556024 "
協力wechat:556024 "
協力メール:556024@qq.c
FREE

The indicator that shows the countdown to the change of candles is equipped with an alert when the bar changes (the alert is not active if installed on the M1 time frame). Displays seconds if installed in time frame M1, displays minutes and seconds if installed in time frame above M1, and displays hours and minutes if installed in time frame h1 and above. The time displayed is calculated based on the running time.
FREE

ニューヨークレンジインジケーターは 、ICT(インナーサークルトレーダー) コンセプト、スマートマネー取引、 機関投資家向けのプライスアクション手法 を適用するトレーダー向けに開発されたセッションベースの分析ツールです。ニューヨークセッション向けに特別に設計されたこのインジケーターは、 ロンドン終値 と ニューヨーク始値 に重なる重要な時間帯である、 GMT 12:00 から14:00の価格帯を捕捉します。 セッションの高値と安値 を特定し、 フェアバリューギャップ(FVG) を検出し、潜在的な 流動性スイープゾーンを 強調表示することで、トレーダーが マーケットメーカーの行動、セッションレンジのブレイク 、 リトレースメントの機会 を正確に分析するのに役立ちます。
この戦略は 、ニューヨーク・キルゾーン と ロンドン・ニューヨーク・セッションの 重なり合い 中に発生する 市場構造の変化 と 蓄積・分配パターン を理解することに重点を置いています。このインジケーターは 、構造のブレイク(BOS)、市場構造の変化(MSS)、変位キャンドル、不均衡ゾーン、 流動性ボイド といった

Smart Trendlines – No.1 Trendlines Indicator Smart Trendlines is a precision tool that automatically draws trendlines based on every valid pivot point, helping traders identify key support and resistance zones. It continuously adjusts as new market pivots form, providing a live and accurate reflection of price structure. Whether you’re tracking trends, preparing for reversals, or anticipating breakouts — this indicator keeps you one step ahead. It works seamlessly across all assets including For

SNR + FVG + HTF Sweeps Levels Indicator Documentation — Version 71.10 Smart Money Concepts (SMC) / Inner Circle Trader (ICT) Methodology By Ultimate Trader Overview This indicator combines three institutional trading concepts into a single chart overlay for MetaTrader 5. It identifies where institutions sweep liquidity at key structural levels, detects the displacement (Fair Value Gap) that follows, and maps the support and resistance zones where these events occur. The result is a high-probabil
FREE

Are you tired of drawing Support & Resistance levels for your Quotes? Are you learning how to spot Support & Resistances? No matter what is your case, Auto Support & Resistances will draw those levels for you! AND, it can draw them from other timeframes, right into you current chart, no matter what timeframe you are using... You can also Agglutinate regions/zones that are too much closer to each other and turning them into one single Support & Resistance Level. All configurable.
SETTINGS
Timefr
FREE
AlgoRhythm ZLSMA - The Ultimate Trend Trading Solution Unlock the power of precision trading with AlgoRhythm ZLSMA , an advanced technical indicator designed to deliver razor-sharp trend signals. Engineered for MetaTrader 5, this cutting-edge Zero Lag Smoothed Moving Average (ZLSMA) combines sophisticated smoothing techniques, multi-timeframe analysis, and dynamic bands to give traders a competitive edge in any market. Whether you're a scalper, swing trader, or long-term investor, AlgoRhythm ZLS
FREE
MetaTraderマーケットが取引戦略とテクニカル指標を販売するための最適な場所である理由をご存じですか?宣伝もソフトウェア保護も必要なく、支払いのトラブルもないことです。これらはすべて、MetaTraderマーケットで提供されます。
取引の機会を逃しています。
- 無料取引アプリ
- 8千を超えるシグナルをコピー
- 金融ニュースで金融マーケットを探索
新規登録
ログイン