YouTube'dan Mağaza ile ilgili eğitici videoları izleyin
Bir alım-satım robotu veya gösterge nasıl satın alınır?
Uzman Danışmanınızı
sanal sunucuda çalıştırın
sanal sunucuda çalıştırın
Satın almadan önce göstergeyi/alım-satım robotunu test edin
Mağazada kazanç sağlamak ister misiniz?
Satış için bir ürün nasıl sunulur?
MetaTrader 5 için teknik göstergeler - 9

Crypto_Forex Göstergesi "Smoothed Trend Histogram" MT5 için, Yeniden Boyama Yok.
- Smoothed Trend Histogram göstergesi, herhangi bir standart Hareketli Ortalamalar çaprazından çok daha verimlidir. - Özellikle büyük trendlerin tespiti için odaklanmıştır. - Göstergenin 2 rengi vardır: Ayı düşüş trendi için Kırmızı ve boğa yükseliş trendi için Yeşil (renkler ayarlardan değiştirilebilir). - Mobil ve PC uyarılarıyla. - Bu göstergeyi diğer işlem yöntemleriyle birleştirmek harika bir fikirdir: Fiyat

The indicator looks for consolidation (flat) in the market at a certain time, builds a box-channel and marks levels indented from it for a breakdawn. After crossing one of the levels, the indicator marks the zone for take profit and calculates the corresponding profit or loss in the direction of this entry on the panel. Thus, the indicator, adjusting to the market, finds a flat area of the market, with the beginning of a trend movement to enter it. Version for MT4: https://www.mql5.com/en/market
FREE

Candle Counter is an indicator that prints the number of candles from the first candle of the day . The first candle of the day will be the number 1 and each new candle will be increased by 1 in this count.
Input Parameters Choose from even, odd or all Distance from candle to Print the number Text Font Size Text Font Color
If you still have questions, please contact me by direct message: https://www.mql5.com/en/users/robsjunqueira/
FREE

Auto Candle Sequence Counter – MT5 İndikatörü
Genel Bakış Auto Candle Sequence Counter, MetaTrader 5 için geliştirilmiş profesyonel bir indikatördür. Art arda gelen yükseliş ve düşüş mumlarını otomatik olarak tespit eder ve işaretler. Manuel mum sayımı yerine, gerçek zamanlı görselleştirme, istatistikler ve uyarılarla fiyat hareketi stratejilerine destek sağlar.
Temel Özellikler
2–7 ardışık mum tespiti (boğa/ayı).
Kesin eşleme, sinyal kaybı yok.
Doji algılama (0.01–0.10 hassasiyet ayarı).
FREE

MT5 için Koala FVG'yi tanıtalım: Fair Value Gap (FVG) desenleri için profesyonel bir gösterge. Koala FVG: MT5'te Hassas İşlemler İçin Yolunuz Koala FVG ile Fair Value Gap (FVG) deseninin gücünü keşfedin - MetaTrader 5 için tasarlanmış son teknoloji bir göstergedir. Kısıtlı bir süre için, bu profesyonel araca ücretsiz erişim sağlayabilirsiniz, daha sonra premium bir göstergeye dönüşmeden önce. Ana Özellikler: FVG Deseni Tespiti: Koala FVG, özelleştirilebilir minimum ve maksimum boyut kriterlerine
FREE
Day and Week Separator MT5 ile işlem analizlerinizi kolaylaştırın; özelleştirilebilir günlük ve haftalık ayırıcı çizgiler çizen sezgisel bir araçtır ve broker saat dilimi farklılıklarıyla başa çıkan traderlar için mükemmeldir. Forex Factory ve Reddit’in r/Forex gibi işlem topluluklarında basitliği ve etkinliğiyle büyük beğeni toplayan bu indikatör, Investopedia ve TradingView gibi platformlarda tartışılan, grafik zaman dilimlerini yerel veya piyasaya özgü saatlerle hizalamada yaygın bir sorunu e
FREE
### Best Order Block Detector Indicator for MT5
The Order Block Detector is a technical analysis indicator designed for MetaTrader 5 (MT5). It identifies potential order blocks (OBs) in the market, which are key price levels where significant buying or selling activity has occurred, often acting as support or resistance zones. These blocks are detected based on volume pivots and market structure swings, helping traders spot areas of institutional interest for potential reversals or continuation
FREE

MA3 Trend MT5 - is the good trend indicator on three MAs . Benefits of the indicator: The indicator produces signals with high accuracy.
The confirmed signal of the indicator does not disappear and is not redrawn.
You can trade on the MetaTrader 5 trading platform of any broker.
You can trade any assets (currencies, metals, cryptocurrencies, stocks, indices etc.).
You can trade on any timeframes (M5-M15 scalping and day trading / M30-H1 medium-term trading / H4-D1 long-term trading). Indi
FREE

If you love this indicator, please leave a positive rating and comment, it will be a source of motivation to help me create more products <3 Key Takeaways Provides both trend and momentum signals in a single view. Entry and exit signals are based on the crossover of the RSI and Signal Line. Market Base Line offers insight into the overall trend direction. Volatility Bands help identify overbought and oversold market conditions.
FREE

A professional tool for trading - the divergence indicator between the RSI and the price, which allows you to receive a signal about a trend reversal in a timely manner or catch price pullback movements (depending on the settings). The indicator settings allow you to adjust the strength of the divergence due to the angle of the RSI peaks and the percentage change in price, which makes it possible to fine-tune the signal strength. The indicator code is optimized and is tested very quickly as par
FREE
ICONIC REVERSAL PATTERN – Konfluans (Confluence) Motoru Sadece kalıpları tespit etmekle kalmayan, bir setup’ın kalitesini akıllı 0–100 Güven (Konfidenz) Skoru ile derecelendiren profesyonel bir dönüş (reversal) göstergesi. Tahmin etmeyi bırakın, değerlendirmeye başlayın. Genel Bakış Sizi yüzlerce zayıf ve çoğu kez hatalı sinyalle bombardımana tutan indikatörlerden bıktınız mı? ICONIC REVERSAL PATTERN , bu sorunu kökünden çözmek için tasarlandı. Profesyonel trader’ları amatörlerden ayıran tek bir
FREE
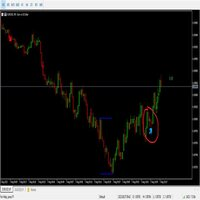
King Binary Profit System
1 minute candle
3-4 minute expire
Alright. This indicator works on MT5 and is very easy to use. When you receive a signal from it, you wait for that candle with the signal to close and you enter your trade at the beginning of the next new candle. A red arrow means sell and a green arrow means buy. All arrows comes with a long dotted like for easy identification of trade signal. Are you okay with that?

This indicator is specifically designed for boom 1000 index. The indicator contains optimised trend filters to target buy spikes in an uptrend. The indicator also add a grid buy signal to recover some loss of the first buy signal. The indicator also provides exit signals for delayed spikes which can help with risk management .Also it analyses signals for historical data and displays percentage of good signals provided by the indicator. KEY FEATURES Non-lagging indicator. Non-repaint. Enable/d
FREE
AlgoRhythm ZLSMA - The Ultimate Trend Trading Solution Unlock the power of precision trading with AlgoRhythm ZLSMA , an advanced technical indicator designed to deliver razor-sharp trend signals. Engineered for MetaTrader 5, this cutting-edge Zero Lag Smoothed Moving Average (ZLSMA) combines sophisticated smoothing techniques, multi-timeframe analysis, and dynamic bands to give traders a competitive edge in any market. Whether you're a scalper, swing trader, or long-term investor, AlgoRhythm ZLS
FREE

Bu gösterge paneli, seçilen semboller için ticaret stratejinize bağlı olarak hem ölçeklendirme hem de uzun vadeli modda grafikteki Arz ve Talep bölgelerini keşfeder ve görüntüler. Ek olarak, gösterge tablosunun tarayıcı modu, istediğiniz tüm sembolleri bir bakışta kontrol etmenize ve uygun pozisyonları kaçırmamanıza yardımcı olur / MT4 sürümü
Ücretsiz gösterge: Basic Supply Demand
Özellikler Birden fazla döviz çiftinde alım satım fırsatlarını görüntülemenize olanak tanıyarak, arz
hello,
king binary sureshot mt5 binary indicator,
1 minute candle
1 minute expire
Alright. This indicator works on MT5 and is very easy to use. When you receive a signal from it, you wait for that candle with the signal to close and you enter your trade at the beginning of the next new candle. A red arrow means sell and a green arrow means buy. All arrows comes with a long dotted like for easy identification of trade signal. Are you okay with that?
FREE
Pin bar takipçisi, döviz, altın ve bitcoin grafiklerinde her zaman diliminde pin bar desenlerini bulmak için tasarlanmış bir göstergedir. Risk-ödül oranını, lot büyüklüğünü ve olası stop loss ve take profit noktalarını otomatik olarak hesaplayan bir araç içermektedir. Özellikler: -Herhangi bir zaman diliminde çalışır -Lot büyüklüklerini otomatik olarak hesaplar -Stop loss ve take profit seviyelerini gösterir -Pin Bar tespit ettiğinde bir uyarı gönderir
FREE

"Agulhadas" Stratejisini Keşfedin Brezilya piyasasında yaygın olarak bilinen kavramlardan ilham alan bu strateji, trendler, piyasa gücü ve momentum temelinde olası alım ve satım noktalarını belirlemek için beş teknik göstergeyi bir araya getirir. Kullanılan göstergeler arasında, hareketli ortalamaların kesişimini temsil etmesiyle tanınan ve Odair Aguiar tarafından geliştirilen ünlü Didi Endeksi de bulunmaktadır. Hisse Senedi Tarayıcısını Buradan İndirin Kullanılan Göstergeler Didi Endeksi ADX Bo
FREE

This wonderful tool works on any pair producing alerts whenever the market enters the overbought and oversold zones of the market. The signals come as BUY or SELL but it does not necessarily mean you should go on and execute order, but that you should begin to study the chart for potential reversal. For advanced signal tools check out some of our premium tools like Dual Impulse.
FREE
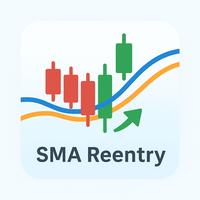
SMA Reentry Nedir? SMA Reentry , biri hızlı biri yavaş olmak üzere iki basit hareketli ortalama (SMA) kullanarak trend yönünde yeniden giriş noktalarını gösteren profesyonel bir indikatördür. Bu indikatör, fiyatın yavaş SMA ile tanımlanan bir trendde, hızlı SMA’nın üzerine (veya altına) tekrar geçtiği anları net bir şekilde gösterir. Pullback, breakout ve trend yeniden giriş sinyalleri arayanlar için ideal bir araçtır. Nasıl Çalışır? Hızlı ve yavaş SMA’nın kesişimiyle ana trendi belirler. Fiyat
FREE

Line Profit Indicator of the visual line of profit in the deposit currency. Works only if there are open positions in the market for the symbol on which the indicator is installed. You can move the line with the mouse or enable automatic tracking of the Bid price. Description of indicator settings: colotLine - line color WidthLine - line width colotText - text color FontSize - the height of the text Anchor - an anchor method for text FollowBid - follow the Bid price
FREE

Sonic R Indicator Description Overview The Sonic R Indicator for MT5 is designed to help traders analyze market trends using moving averages and volume analysis. This tool assists in identifying potential price movements by displaying trend zones and volume strength, making it suitable for various trading strategies. Key Features Dual EMA Trend Channels – Uses 34-period Exponential Moving Averages (EMA) to visualize price movement. Volume Analysis – A color-coded histogram to indicate changes i
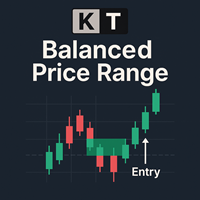
KT Balanced Price Range, ardışık ve zıt yönlü iki Fair Value Gap (FVG) arasındaki örtüşen alanı vurgular. Balanced Price Range (BPR) olarak bilinen bu kavram, özellikle Smart Money Concepts (SMC) ve Inner Circle Trader (ICT) yöntemlerini takip eden fiyat hareketi yatırımcıları arasında oldukça popülerdir. Trader'lar bu BPR bölgelerini sıklıkla, özellikle geri çekilmeler sırasında veya trendin devamını ararken, yüksek olasılıklı işlem fırsatlarını belirlemek için kullanırlar. BPR bölgeleri genell
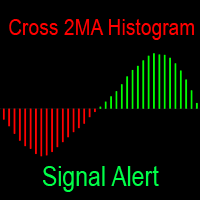
Gösterge, iki hareketli ortalama arasındaki farkı bir histogram şeklinde gösterir. Hareketli ortalamaların ayarlanması için muazzam bir potansiyeliösterge, iki hareketli ortalama arasındaki farkı bir histogram şeklinde gösterir. Hareketli ortalamaların ayarlanması için muazzam bir potansiyeli vardır. Histogramın rengini değiştirirken sizi her şekilde bilgilendirir: terminalde bip sesi çıkarır, telefona bir bildirim gönderir ve postaya bir mektup gönderir — şimdi kesinlikle anlaşmayı kaçırmayacak
FREE

DRX Smart Risk | Profesyonel İşlem Planlayıcı Tahmin etmeyi bırakın. Hassas planlamaya başlayın. Lot büyüklüklerini ve Risk/Ödül oranını (R:R) manuel olarak hesaplamak yavaştır. DRX Smart Risk , profesyonel grafik platformlarının (TradingView gibi) sezgisel iş akışını doğrudan MetaTrader 5 terminalinize getirir. Sorun: Standart MT5 çizgileri kullanışsızdır. Zaman dilimini değiştirdiğinizde kaybolurlar ve R:R oranını kafanızdan hesaplamanız gerekir. Çözüm: DRX Smart Risk , üst düzey bir görsel ar
FREE

Indicador gratuito para Metatrader 5 que muestra en pantalla una caja rectangular para cada una de las sesiones de mercado "Londres, New York y Tokio". Se puede establecer la zona horaria de forma automática o mediante un valor de offset. Parámetros de configuración para cada una de las sesiones. Visible / No visible Hora Inicial Hora Final Caja sólida o transparente. Estilo del borde de la caja. Grosor del borde de la caja. Color.
FREE
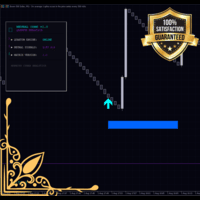
Monet Signal Master - Advanced Neural Trading System Version 1.00 Author: MONETFX Introduction Monet Signal Master is a professional technical indicator for MetaTrader 5 that generates non-repainting buy and sell signals using advanced multi-oscillator analysis. The indicator combines Stochastic and RSI crossovers with SuperTrend filtering to identify high-probability trading opportunities. Features include a cyberpunk-style dashboard, visual risk management zones, and comprehensive alert system
FREE

Orderflow Smart Flip ( DEMO version,modleling must choose " Every tick based on real ticks") — Insight into Institutional Footprints, Capturing Reversals, Making Every Line Data-Driven. Important notice: Before placing an order, please contact me first, and I will provide you with professional answers and services
Product Introduction Say Goodbye to Guesswork. Embrace the Data Truth. [The last two screenshots show scenarios where the OrderFlow Bubbles Pro indicator is used in combination.] Ord

This indicator shows the TLH and TLL and some trendlines that allow us to estimate the trend of market. It also shows the values of the angles of the lines in percentage in points (pip) , the standard deviation, and the trend of each line, and when it breaks the lines of support and resistance (TLH and TLL). And finally, it also shows the points identified as supports and resistances through the fractal algorithm in the graph. The high and low trend lines are supported by the highs and lows, th
FREE

Pure Trend Logic MT5 — Профессиональный алгоритм следования за трендом Pure Trend Logic MT5 — это воплощение классической торговой стратегии в современной интерактивной оболочке. Индикатор предназначен для трейдеров, которые ценят чистоту графиков и математическую точность. Система объединяет три уровня анализа цены, позволяя находить точки входа с математическим преимуществом. ### Философия индикатора: В основе лежит «золотое правило» трейдинга: торгуй по направлению основного потока. Мы взяли
FREE
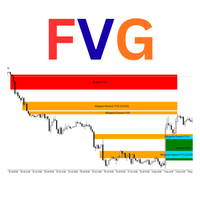
Luta FVG Pro – Professional Fair Value Gap (FVG) Indicator
Detects Institutional Fair Value Gaps on H4 timeframe with the same way used by ICT/SMC traders.
Features: • Real-time Bullish & Bearish FVG detection • Automatic Mitigation tracking • Inverted FVG signals (very powerful reversal setups) • "GOOD" FVG marking (gaps ≥ 2× minimum size – higher probability) • Clean rectangles with smart labels (Bullish FVG / Mitigated / Inverted) • Overlap filter option • Maximum 50 active zones (no chart
FREE

Phoenix Auto Fibonacci Monitor (MT5)
MetaTrader 5 için profesyonel Fibonacci istihbarat ve salınım analizi aracı. Baskın piyasa salınımlarını otomatik olarak algılar ve gerçek zamanlı görsel bir gösterge paneli aracılığıyla gelişmiş Fibonacci geri çekilme bilgileri sunar.
Genel Bakış
Phoenix Otomatik Fibonacci Monitörü, daha yüksek zaman dilimindeki pivot ve ATR doğrulamasını kullanarak önemli piyasa dalgalanmalarını otomatik olarak belirler, ardından akıllı Fibonacci geri çekilme seviyelerin
FREE

Pivot trading:
1.pp pivot
2. r1 r2 r3, s1 s2 s3
Necessary for traders: tools and indicators Waves automatically calculate indicators, channel trend trading Perfect trend-wave automatic calculation channel calculation , MT4 Perfect trend-wave automatic calculation channel calculation , MT5 Local Trading copying Easy And Fast Copy , MT4 Easy And Fast Copy , MT5 Local Trading copying For DEMO Easy And Fast Copy , MT4 DEMO Easy And Fast Copy , MT5 DEMO
Cooperation QQ:556024"
Cooperation wechat
FREE
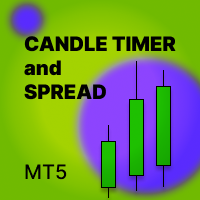
Candle_Timer_and_Spread göstergesi, tek bir grafik üzerinde mumun sonuna kadar geçen süreyi ve seçilen semboller için spread ile birlikte fiyat değişim yüzdesini gösterir.
Geçerli zaman diliminde mumun sonuna kadar geçen süreyi ve günün açılış fiyatına göre yüzde olarak fiyat değişimini gösteren zamanlayıcı, varsayılan olarak grafiğin sağ üst köşesinde bulunur. Panel, seçilen semboller için geçerli fiyatın günün açılışına göre dağılımını ve yüzde değişimini gösterir. Panel varsayılan olarak so
FREE

NeoBull Predictive Ranges – Gelişmiş Volatilite ve Hacim Sistemi Description: NeoBull Predictive Ranges, MetaTrader 5 için kapsamlı bir teknik analiz sistemidir. Gelişmiş volatilite hesaplamalarını hacim tabanlı trend analizi ile tek bir göstergede birleştirir. Bu araç, yatırımcılara piyasa yapısı ve emir akışı (Order Flow) hakkında kesin bilgiler sunmak için tasarlanmıştır. Bu profesyonel aracı topluluğa ücretsiz olarak sunuyorum. Özellikler ve Teknik Detaylar: Predictive Ranges (Dinamik Volati
FREE

Fair Value Gap Finder detects fair value gaps and generates a signal when price returns to one. Set the minimum and maximum fvg size, customize the colors, style, and length, then let the indicator highlight them for you.
Key Features: Automatic FVG highlights - The indicator detects all fair value gaps that fit your criteria and marks them on the chart.
Entry Signal - A signal is created whenever price retests a fair value gap.
Notification - Alerts notify you when a fair value gap or a new
FREE

Dark Inversion is an Indicator for intraday trading. This Indicator is based on Counter Trend strategy but use also Volatility. We can enter in good price with this Indicator, in order to follow the inversions on the current instrument. Hey, I made an Expert Advisor based on this indicator, if you are interested: Dark Titan MT5
Key benefits
Easily visible Inversion Lines Intuitive directional arrows Automated adjustment for each timeframe and instrument Easy to use even for beginners Never r
FREE

This is Heiken Ashi smoothed version, where you can choose on what type smoothness you want to make your strategy base. You can choose between EMA or MA, on the period you want. And you can choose colors.
Definition:
The Heikin-Ashi technique averages price data to create a Japanese candlestick chart that filters out market noise. Heikin-Ashi charts, developed by Munehisa Homma in the 1700s, share some characteristics with standard candlestick charts but differ based on the values used to cre
FREE

The worktime indicator helps you identify the most important times to day to trade the currency pairs. It was created based on the ICT day trading free tutorials that are freely vailable on his youtube channel. You can use this indicator together with my other indicators that i have shared freely with you like the true day, custom periods, daily month, weekly open lines - they together complement each other very well.
Nuggets from this indicator: 1. Draws the asian session box showinng you the
FREE

Are you tired of drawing Support & Resistance levels for your Quotes? Are you learning how to spot Support & Resistances? No matter what is your case, Auto Support & Resistances will draw those levels for you! AND, it can draw them from other timeframes, right into you current chart, no matter what timeframe you are using... You can also Agglutinate regions/zones that are too much closer to each other and turning them into one single Support & Resistance Level. All configurable.
SETTINGS
Timefr
FREE

The Hull Moving Average is not very well know in novice and maybe in intermediate trading circles, but it is a very nice solution created by the trader Alan Hull - please visit www.AlanHull.com for full details of his creation. The purpose of this moving average is to solve both problems that all famouse and common moving averages have: Lag and Choppiness . The implementation we did has, apart of the Period configuration and Price type to use in the calculations, a "velocity" factor, which could
FREE

Special offer : ALL TOOLS , just $35 each! New tools will be $30 for the first week or the first 3 purchases ! Trading Tools Channel on MQL5 : Join my MQL5 channel to update the latest news from me ICT’nin Inversion Fair Value Gap (IFVG) konseptinin gücünü Inversion Fair Value Gaps Indicator ile keşfedin! Bu son teknoloji araç, Fair Value Gaps (FVG) analizini bir adım öteye taşıyarak ters çevrilmiş FVG bölgelerini tanımlar ve gösterir — fiyat düzeltmesinden sonra oluşan önemli dest

Gösterge yükseliş ve düşüş eğilimi gösteriyor. Göstergenin kendisi (normal stokastik gibi) bir alt pencerede görüntülenir. Grafik arayüzü : Ana pencerede, "Düşük" fiyattan "Düşük" fiyata (yükseliş farklılığı için) ve "Yüksek" fiyattan "Yüksek" fiyata (düşüş eğilimi sapması için) kadar üretilen "trend çizgisi" grafik nesneleri oluşturulur. ). Gösterge, penceresinde yalnızca grafik tamponlarını kullanarak çizer: “Ana”, “Sinyal”, “Nokta”, “Al” ve “Satış”. "Al" ve "Satış" tamponları farklılık gös

Strifor Lot Calculator is a tool for MetaTrader 5 that helps traders calculate the correct lot size based on risk and stop-loss.
It allows you to trade more consciously, manage risks better, and save time on manual calculations. Advantages Accurate risk control – automatically calculates the lot size according to your chosen risk %. Two working modes – manual input or quick calculation using chart lines. Supports all popular instruments – forex pairs, gold (XAUUSD), oil (USOIL/WTI), indices (US
FREE

What is the Volume Weighted Average Price (VWAP)? The volume weighted average price (VWAP) is a trading benchmark used by traders that gives the average price an instrument has traded at throughout the day, based on both volume and price. It is important because it provides traders with insight into both the trend and value of the instrument.
What is the Difference between VWAP and AVWAP? While VWAP is having as starting point the beggining of the day,week,month etc. in the AVWAP you can pla

Peak Trough Analysis is the great tool to detect peaks and troughs in your chart. Peak Trough Analysis tool can use three different peaks and troughs detection algorithm. The three algorithm include the orignal Fractals Indicator by Bill Williams, the Modified Fractals indicator and ZigZag indicator. You can use this peak and trough analysis tool to detect the price pattern made up from Equilibrium Fractal-Wave process. For further usage, there are good guide line on how to use this peak trough
FREE

Çoklu zaman dilimi ZigZag göstergesi. Destek/direnç yatay çizgilerini ve bunların kırılmalarını gösterir, ayrıca piyasanın mevcut hedeflerini de çizer. Ayrıca Fraktallar göstergesinin çizgilerini ve diğer dönemlere ait mumları da görüntüleyebilir (Üç Aylığa kadar). Gösterge – Trend çizgilerini göstermek için önemli dip ve tepe noktalarını birbirine bağlar.
Gösterge son (geçerli) noktayı yeniden çizer ve bazı durumlarda son 2-3 noktayı değiştirebilir.
Tüm çizgiler nesneler olarak çizilir ( gös

Custom Spread Indicator *Please write a review, thanks!
Also MT4 version is available
Spread Indicator show the current spread in pips with color codes. Handle 3 levels, Low, Medium, High. You can set levels and colors for each level (eg. Low: Green, Medium: Orange, High: Red), and can choose display position on the chart.
There is two spread calculation mode: -> Server spread value -> Ask - Bid value
Can set opacity, for better customization. When spread jump bigger, then display do not
FREE

AW Süper Trend - Bu, en popüler klasik trend göstergelerinden biridir. Basit bir ayarı vardır, yalnızca trendle çalışmanıza izin vermez, aynı zamanda bu gösterge tarafından hesaplanan zararı durdur seviyesini de gösterir. Faydalar:
Aletler: Döviz çiftleri , hisse senetleri, emtialar, endeksler, kripto para birimleri. Zaman dilimi: М15 ve üstü. İşlem süresi: 24 saat. Mevcut trendin yönünü gösterir. Durdurma kaybını hesaplar. Ticaret ile çalışırken kullanılabilir. Üç tür bildirim: push,
FREE

Projective SR – Gerçek Zamanlı Projelendirilmiş Destek ve Dirençler Projective SR , grafikteki temel destek ve direnç noktalarını otomatik olarak tespit eden ve fiyatın tepki verebileceği potansiyel bölgeleri öngörerek bunları çapraz ve dinamik bir şekilde geleceğe yansıtan gelişmiş bir göstergedir. Yalnızca sabit seviyeleri gösteren geleneksel göstergelerin aksine, Projective SR fiyatın geometrisini analiz eder , en alakalı pivotları belirler ve piyasa hareketine uyum sağlayan eğik çizgiler çiz
FREE

SMC Precision AI Unlock the edge of institutional trading with SMC Precision AI – an advanced AI-powered Smart Money Concept (SMC) based FIBO Retrenchment indicator built for serious traders who want precision, clarity, and high-probability trade setups.
Key Features It Plots Fibo Retrenchment Zones.
AI-Powered Signals – Enhanced by real-time AI logic to adapt to changing market conditions with Reasonable accuracy
Signal Clarity – It Draws Fibo Bands- When the Lower Line Is drawn it indicat

Hull Moving Average (HMA) The Hull Moving Average was designed to almost entirely eliminate lag without compromising smoothness. While a Simple Moving Average (SMA) is slow to react and an Exponential Moving Average (EMA) can still be "sluggish," the HMA utilizes a combination of Weighted Moving Averages (WMA) to anticipate price action. The "Magic" of Reversal (Coloring) The indicator monitors the slope of the line at every tick: Bullish (Green): When the current HMA value is higher than the pr
FREE

M5 Scalp Wick Entry Arrows This indicator displays two independent types of arrows directly on the chart. Both arrow types are calculated strictly from M5 data, while the indicator can be attached to any timeframe for convenient viewing and analysis. Arrows help visually mark potential moments of interest without overloading the chart. You can adjust arrow size and colors in the settings to match your template. Tested on XAUUSD (Gold) and EURUSD.
FREE

Price Volume Trend (PVT) Oscillator Description: The PVT Oscillator is a volume indicator that serves as an alternative to the standard On-Balance Volume (OBV). While ordinary volume indicators can be noisy and hard to read, this tool converts volume flow into a clear Histogram Oscillator, similar to a MACD, but for Volume. It is designed to detect first Trend Reversals and Divergences by analyzing the difference between a Fast and Slow PVT moving average. Why is this better than standard OBV?
FREE
Ekom Spike Detector
Navigate the volatile world of Boom and Crash indices with the Ekom Spike Detector Indicator. This powerful tool detects explosive price movements, providing traders with precise buy and sell signals 24/7.
Key Features:
Spike Detection : Identify high-probability spike patterns in real-time Clear Visual Signals : Displays clear buy and sell arrows on the chart for easy decision-making Customizable : Easily switch from either Boom based on individuals choice Reliable : Te
FREE

Weis Wave Scouter Basic, MetaTrader 5 için geliştirilmiş ünlü göstergemizin temel versiyonudur ve Wyckoff yöntemi ile VSA (Hacim Yayılım Analizi) kavramlarını erişilebilir ve verimli bir şekilde keşfetmek isteyen yatırımcılar için tasarlanmıştır. Hacim dalgalarının okunmasına dayanan bu sadeleştirilmiş gösterge, piyasa hareketlerini net bir şekilde tanımlamanıza olanak tanır ve Richard Wyckoff’un öğrettiği gibi, çaba-sonuç dengesi ile arz-talep ilkelerine odaklanır. Weis Wave Scouter Basic ile,
FREE

VM Heiken Ashi Pro
Gürültüyü filtrelemek ve net BUY/SELL sinyalleri üretmek için düzeltilmiş Heiken-Ashi (HMA veya EMA), yeniden çizmez (opsiyonel ConfirmOnClosedBar). Grafikte HA mumlarını gösterir (orijinal mumlar gizlenebilir), ok yerleştirme ATR veya sabit ofset ile, anti-spam işleme ile uyarılar gönderir (popup, email, push). Ana amaç
Ham mumları düzleştirilmiş Heiken-Ashi ye dönüştürerek renk değişimlerini algılamak (bear to bull / bull to bear) ve girişler için oklar çizmek. ConfirmOnC

The Order Block Indicator for MT5 is a powerful tool designed for traders who use smart money concepts and institutional trading strategies. It automatically detects key order blocks on the chart, helping traders identify high-probability reversal and continuation zones.
Key Features: • Automatic Order Block Detection – Highlights strong buying and selling zones based on price action and volume. • Multi-Timeframe Support – Analyze order blocks across different timeframes for better market in
FREE

Boom and crash Gold Miner v2 trend histogram which works in conjunction with the indicator above that has arrows as shown in the video. PLEASE Note: That the top indicator and the bottom indicator are two separate indicators. the top indicator is https://www.mql5.com/en/market/product/98066 the bottom one is free. which is the histogram at the bottom. the trend histogram trading tool that helps to easy detect the trend blue color indicates an uptrend. Orange color is a down trend.
FREE

The Anchored VWAP Indicator for MetaTrader 5 gives you full control over where your VWAP starts. Instead of being locked to session opens or fixed times,
you simply drag the anchor point on the chart , and the VWAP instantly recalculates from that exact bar.
This makes it perfect for analyzing:
• Institutional entry zones
• Breakout origins
• Swing highs/lows
• News reaction points
• Trend continuations Key Features Drag & Drop Anchor Point : Move the starting point directly on the chart. The
FREE
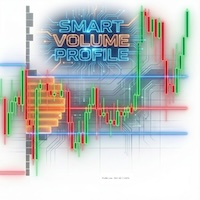
Turkish "Akıllı Para" Taraması (Volume Markers): Oklar, anormal hacmi (ortalamanın üzerinde) net yeşil/kırmızı renklerle gösterir. Bu, büyük oyuncuların (Smart Money) girişlerini tespit etmeye ve sahte sinyalleri elemeye yardımcı olur. Kritik Uyarılar (Alerts): Ekranı sürekli izlemenize gerek yok. Fiyat, genellikle devam veya geri dönüş için belirleyici bir nokta olan POC (Hacim Kontrol Noktası) çizgisini kestiğinde sistem sizi hemen uyarır. Anlık Piyasa Yapısı (Developing Profile): Şu anda oluş
REVERSAL POWER PRO
The ONLY Indicator That Shows You Where Markets WILL Reverse - BEFORE They Move
WELCOME TO THE NEXT LEVEL OF TRADING PRECISION
Tired of guessing where the market will turn? Missing entries because you don't know where support/resistance REALLY is? Getting stopped out at "fake" levels? Wondering if your bias is correct before entering?
What if you had: Crystal-clear Supply/Demand Zones that markets RESPECT Daily Bias Engine telling you market directio
FREE

This is a simple Candle Stick Pattern Indicator, which shows in the current time period all standardisized Patterns in the chart. All Patterns will be calculatet automatically based on standard conditions. Following Candle Stick Patterns are included: Bullish Hammer | Bearish Hammer Bullish Inverted Hammer | Bearish Inverted Hammer Bullish Engulfing | Bearish Engulfing Piercing | Dark Cloud Cover Bullish 3 Inside | Bearish 3 Inside There are only a few settings at the begining to take. Every Pat
FREE

This is Wilder's ADX with cloud presentation of DI+ & DI- lines. Features
4 standard lines of the ADX indicator: DI+, DI-, ADX, ADXR cloud presentation of DI+/DI- lines with transparent colors applicable to all time-frames and all markets
What Is ADX
J. Welles Wilder Jr., the developer of well-known indicators such as RSI, ATR, and Parabolic SAR, believed that the Directional Movement System, which is partially implemented in ADX indicator, was his most satisfying achievement. In his 1978 book,
FREE

Fractals Dynamic Fractals Dynamic – sol ve sağdaki çubukların sayısını manuel olarak ayarlayabileceğiniz ve böylece grafikte benzersiz desenler oluşturabileceğiniz, Bill Williams tarafından değiştirilmiş bir serbest fraktal göstergedir. Artık Fraktallar Dinamik göstergesine dayanan veya temelinde bulunan tüm ticaret stratejilerinin ek bir sinyali olacaktır.
Ek olarak, fraktallar destek ve direnç seviyeleri olarak hareket edebilir. Ve bazı ticaret stratejilerinde likidite seviyelerini göster
FREE

RBC Range Bar Chart is a classical range bar chart indicator. The indicator features price ranges for charting: High/Low price range is a classical option for analysis. It also has Open, High, Low and Close prices. In the first option, two price values are analyzed at the same time, while other options only use one price. Conventionally, range bars are drawn using tick data but since tick data is not available on the server, charting is only possible based on bar data from standard time frames.

This is a derivative of John Carter's "TTM Squeeze" volatility indicator, as discussed in his book "Mastering the Trade" (chapter 11).
Gray dot on the midline show that the market just entered a squeeze (Bollinger Bands are with in Keltner Channel). This signifies low volatility, market preparing itself for an explosive move (up or down). Blue dot signify "Squeeze release".
Mr.Carter suggests waiting till the first blue after a gray dot, and taking a position in the direction of the moment
FREE

Geliştirilmiş MACD Histogram Sürümü (Piyasa Momentum Değişikliklerini İzlemek İçin) MT5’in standart MACD göstergesi, histogramı oluşturmak için MACD hattının kendi değerini kullanır. Hızlı hareketler veya yatay piyasalar sırasında, bu histogramlar yavaş değişir ve alım-satım momentumunun hızlanmasını veya yavaşlamasını net bir şekilde yansıtmayabilir. Özellikle fiyat henüz belirgin bir dönüş göstermediğinde, sinyaller gecikmiş olur. Bu sürümde, klasik MACD Histogram tanımı kullanılmıştır: Histog
FREE

Documentation for connecting Metatrader 5 with Python with a simple drag and drop EA.
A full end-to-end solution ,fully tested ,fast and efficient!
The Pytrader ecosystem consists of a python script and a MT5 or MT4 version EA.
Further for the licensing an indicator is used.
The communication between the python script and the EA is based on sockets.
EA is the Server and the python script the Client .
It is always query(function / python script) and output(data / server).
T
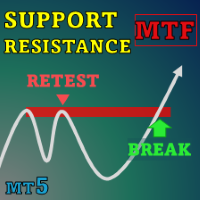
Special offer : ALL TOOLS , just $35 each! New tools will be $30 for the first week or the first 3 purchases ! Trading Tools Channel on MQL5 : Join my MQL5 channel to update the latest news from me Finansal ticaretin sürekli değişen ortamında, destek ve direnç seviyelerini doğru bir şekilde belirlemek ve analiz etmek, bilinçli yatırım kararları almak için esastır. SnR Retest and Break Multi-Timeframe , ticaret analizlerinizi geliştirmek için tasarlanmış bir destek ve direnç gösterg
MetaTrader platformunun uygulama mağazası olan MetaTrader mağazasından bir alım-satım robotunun nasıl satın alınacağını öğrenin.
MQL5.community ödeme sistemi, PayPal, banka kartları ve popüler ödeme sistemleri aracılığıyla yapılan işlemleri destekler. Daha iyi bir müşteri deneyimi için satın almadan önce alım-satım robotunu test etmenizi şiddetle tavsiye ederiz.
Alım-satım fırsatlarını kaçırıyorsunuz:
- Ücretsiz alım-satım uygulamaları
- İşlem kopyalama için 8.000'den fazla sinyal
- Finansal piyasaları keşfetmek için ekonomik haberler
Kayıt
Giriş yap
Gizlilik ve Veri Koruma Politikasını ve MQL5.com Kullanım Şartlarını kabul edersiniz
Hesabınız yoksa, lütfen kaydolun
MQL5.com web sitesine giriş yapmak için çerezlerin kullanımına izin vermelisiniz.
Lütfen tarayıcınızda gerekli ayarı etkinleştirin, aksi takdirde giriş yapamazsınız.