ZigZagus Parabolicus
- Indikatoren
- Version: 1.8
- Aktualisiert: 14 Dezember 2021
- Aktivierungen: 5

Dieser Indikator erweitert die Möglichkeiten des üblichen ZigZag-Indikators durch die Hinzufügung von parabolischen Kanälen im frühesten Stadium ihrer Entstehung erheblich.
Laden Sie die Demoversion herunter und testen Sie sie im Testprogramm. Alle Grafiken im Tester sind funktionsfähig.
Aber der ZigZag-Algorithmus ist hier besonders, weil er auf einem einzigartigen ultraschnellen schleifenlosen Algorithmus des Autors zur Berechnung der parabolischen Regression und zur Berechnung ihrer Standardabweichung beruht.
Die Merkmale dieses ZigZag sind:
- Schnelle Berechnung, unabhängig von der Periode. Daher ist der Geschwindigkeitsgewinn besonders bei höheren Perioden spürbar.
- Zwei Parameter anstelle von drei: die Periode der parabolischen Regression und der Koeffizient des Anstiegs des Wertes der Standardabweichung (die Breite des parabolischen Kanals)
- Hohe Anpassungsfähigkeit an Schwankungen und Trends
Um die Bedienung des Indikators zu erleichtern, wurde eine neue intuitive Schnittstelle entwickelt, die auch für Bildschirme mit Touch-Steuerung geeignet ist.
Eine einfache Teststrategie mit der Anzeige des Balance-Charts und der Anzeige von Geschäften auf dem Bildschirm ist ebenfalls implementiert.
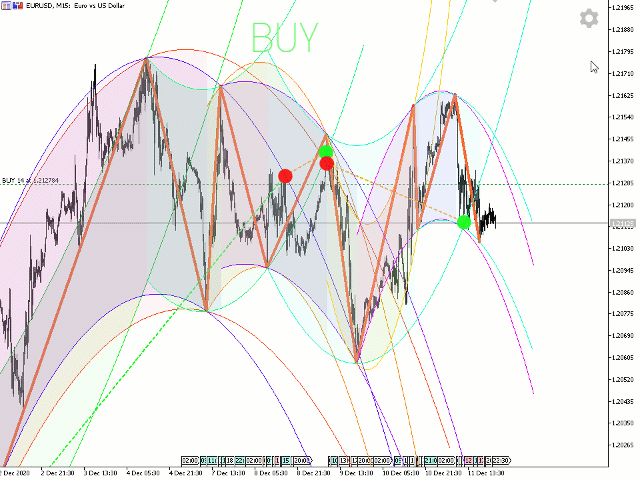
- Grüner Kreis - Kaufen.
- Roter Kreis - Verkaufen.
Der Eröffnungskurs liegt genau in der Mitte des Kreises, wobei der Spread berücksichtigt wird.
Diese Strategie eröffnet ein Verkaufsgeschäft, wenn der neu gebildete parabolische Kanal nach unten zeigt und der Preis die obere Grenze des Kanals überschreitet, und ein Kaufgeschäft, wenn er nach oben zeigt und der Preis die untere Grenze des Kanals überschreitet. Der Spread wird auf der Grundlage des durchschnittlichen Spreads der letzten 2000 Ticks berechnet.
Wenn dieser Indikator gefragt ist, werden die Strategien ausgeweitet.
Ich empfehle nicht, diesen Indikator in diesem Modus zu verwenden:
- Max bars in chart: = unbegrenzt.
Denn dann wird die Berechnung sehr langsam und die Arbeit wird unangenehm.
Bitte melden Sie alle Fehler, die Sie finden, sie werden umgehend beseitigt.
In der Zukunft wird eine Schaltfläche zur automatischen Anpassung der besten Parameter hinzugefügt werden.

Установил , тестирую ,пока все нравится. Если добавть сигналы будет супер.