Technische Indikatoren für den MetaTrader 5 - 7

Eine hochwertige Implementierung des berühmten Super-Trend-Indikators , der keiner Einführung bedarf. Er ist dem ursprünglichen Algorithmus vollständig treu und implementiert viele weitere nützliche Funktionen wie z.B. ein Multi-Timeframe-Dashboard. [ Installationsanleitung | Updateanleitung | Fehlerbehebung | FAQ | Alle Produkte ] Einfach zu handeln Es implementiert alle Arten von Alarmen Es implementiert ein Multi-Zeitrahmen-Dashboard Kein Re-Painting und kein Back-Painting Eingabe-Parameter
FREE

Mean-Reversion-Angebot-Nachfrage-Indikator Mean Reversion Supply Demand ist ein Indikator zur Erkennung der wichtigen Angebots-Nachfrage-Zone in Ihrem Chart. Das Konzept des Angebots-Nachfrage-Handels beruht auf dem quantitativen Ungleichgewicht zwischen Kauf- und Verkaufsvolumen auf dem Finanzmarkt. In der Regel dient die Angebots-Nachfrage-Zone dazu, den Wendepunkt vorherzusagen. Damit eine Angebots-Nachfrage-Zone als erfolgreicher Handel funktioniert, sieht das Wellenmuster so aus, dass der K

Löwenpfeil-Superpfeil-Indikator für MetaTrader 5
Der Lion Arrow Super Arrow Indicator für MetaTrader 5 ist ein hybrides Handelssystem, das mehrere fortschrittliche technische Analysetools integriert, um hochwertige Handelssignale zu generieren. Durch die Kombination von trend-, momentum- und druckbasierten Indikatoren zielt er darauf ab, Fehlsignale zu reduzieren und die Einstiegsgenauigkeit zu verbessern. Kernkomponenten des Indikators Der Lion Arrow Super Arrow-Indikator basiert auf mehreren
FREE

" Übersicht
Der Volume SuperTrend AI ist ein fortschrittlicher technischer Indikator zur Vorhersage von Preistrends durch eine Kombination aus traditioneller SuperTrend-Berechnung und KI-Techniken, insbesondere dem k-nearest neighbors (KNN)-Algorithmus.
Der Volume SuperTrend AI wurde entwickelt, um Händlern Einblicke in potenzielle Markttrends zu geben, indem er sowohl volumengewichtete gleitende Durchschnitte (VWMA) als auch den k-nearest neighbors (KNN)-Algorithmus verwendet. Durch die Komb
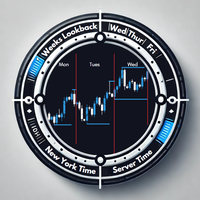
Übersicht Der Daily Session Separator-Indikator ist ein leistungsfähiges Tool, das Ihre Handelserfahrung verbessert, indem es die täglichen Handelssitzungen in Ihrem Diagramm deutlich markiert. Er hilft Händlern bei der Visualisierung von Tagesgrenzen, Höchst- und Tiefstständen sowie wichtigen tagesspezifischen Daten, um fundierte Entscheidungen zu treffen. Mit seiner nahtlosen Integration in jeden Chart und seiner dynamischen Anpassungsfähigkeit ist dieser Indikator ein Muss für Trader, die auf
FREE

Täglicher VWAP-Indikator (volumengewichteter Durchschnittspreis) Sonderangebot! Hinterlassen Sie eine Bewertung und erhalten Sie den Indikator Long & Short Cointegration Analyzer kostenlos - schicken Sie mir einfach eine Nachricht!
Beschreibung Der Daily VWAP (Volume Weighted Average Price) Indikator ist ein wesentliches Instrument für Händler, die den wahren Durchschnittspreis eines Vermögenswertes während des Tages, bereinigt um das gehandelte Volumen, ermitteln wollen. Der tägliche VWAP wird
FREE

Indikator Beschreibung
Dieser Indikator zeichnet rot umrandete Rechtecke während bestimmter täglicher ICT Kill Zones (EST): 3:00 - 4:00 UHR EST 10:00 - 11:00 UHR EST 2:00 - 3:00 UHR EST Während jedes aktiven Zeitfensters erstellt der Indikator automatisch Rechtecke und hebt Fair Value Gaps (FVGs) hervor , die sich kurz vor und während der ausgewählten Kill Zones gebildet haben, einschließlich der jüngsten früheren FVGs für zusätzliche Zusammenflüsse. Die Kill Zones wurden nach den Konzepten de
FREE
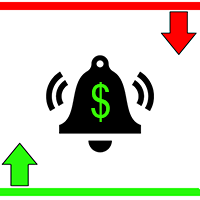
Ein intelligenter Assistent für genaue und zeitnahe Markteintritte. Der Indikator piept und warnt, wenn der Preis das Niveau erreicht. Sie können die Unterstützungs- und Widerstandsniveaus manuell einstellen oder dies einem Algorithmus anvertrauen. Zu dem Zeitpunkt, zu dem der Preis das Niveau erreicht, werden die Kerzenmuster zusätzlich markiert. Einzigartige Kerzenmuster sind eine Symbiose klassischer Muster und Muster des Aufschlüsselns und Aufhebens von Ebenen. Für einen sehr profitablen Han
FREE
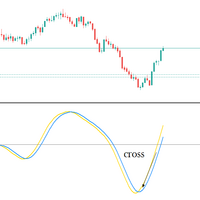
Großes Angebot für die Robos, Holen Sie sich Ihre jetzt Robos Indikator Der ROBOS-Indikator ist ein Multi-Zeitrahmen-Oszillator, der auf die überkauften und überverkauften Regionen eines Preisdiagramms abzielt. Ein Signal wird angezeigt, wenn sich die beiden Linien kreuzen, kompatibel mit allen handelbaren Instrumenten
Letzte Veröffentlichung
Das neueste Release ist die Version 4.0
# Was ist neu in Version 4.0?
Funktionen
Extreme überverkaufte und überkaufte Niveaus
ROBOS Version 4.0 ko
Der Day Direction Scanner ist ein Indikator, der die Richtung der aktuellen Kerze in den Zeiträumen 1 Tag, 4 Stunden, 1 Stunde, 15 Minuten und 5 Minuten nutzt, um die Marktrichtung zu bestimmen. Konvergieren alle Kerzen in eine Richtung, zeigt der Indikator an, ob der Tag bullisch oder bärisch ist oder ob keine klare Richtung erkennbar ist. Er ist hilfreich, um sich im Tagesverlauf einen Überblick über die Marktrichtung zu verschaffen.
Funktionen:
– Funktioniert für alle Währungspaare, Indize
FREE

Wir stellen den MACD Enhanced vor - einen erweiterten MACD-Indikator (Moving Average Convergence Divergence), der Händlern erweiterte Möglichkeiten für die Trend- und Momentum-Analyse an den Finanzmärkten bietet. Der Indikator nutzt die Differenz zwischen dem schnellen und dem langsamen exponentiellen gleitenden Durchschnitt, um die Dynamik, die Richtung und die Stärke des Trends zu bestimmen und klare visuelle Signale für potenzielle Einstiegs- und Ausstiegspunkte zu erzeugen. Aber Achtung! Um
FREE
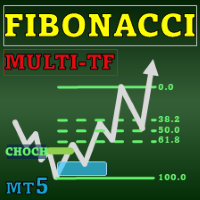
Special offer : ALL TOOLS , just $35 each! New tools will be $30 for the first week or the first 3 purchases ! Trading Tools Channel on MQL5 : Join my MQL5 channel to update the latest news from me Das Fibonacci Confluence Toolkit Multi-Timeframe ist ein fortschrittliches technisches Analysewerkzeug, das für professionelle Trader entwickelt wurde und dabei hilft, potenzielle Preisumkehrzonen zu identifizieren, indem es wichtige Marktsignale und Muster kombiniert. Mit der Multi-Time

Volumes with Moving Average ist ein einfacher und unkomplizierter Volumenindikator, der durch einen gleitenden Durchschnitt ergänzt wird.
Wie wird er verwendet?
Er eignet sich gut zum Filtern von Signalen beim Einstieg in ein Geschäft sowohl von Unterstützungs-/Widerstandsniveaus als auch bei Volatilitätsausbrüchen von Trendkanälen. Er kann auch ein Signal zum Schließen einer Position nach Volumen sein.
Eingabeparameter:
Volumina - reales oder Tick-Volumen. MA_period - Periode des gleitende
FREE

Ergründen Sie Handels-Einblicke mit Auto Anchored VWAPs: Auto Anchored VWAPs dienen als Ihr leitender Begleiter in der Welt des Handels. Diese Indikatoren ermitteln entscheidende Wendepunkte im Markt und veranschaulichen sie auf Ihrem Chart mit VWAP-Linien. Dies ist ein Game-Changer für Händler, die verankerte VWAP-Strategien verwenden. Wie funktioniert es? Identifizieren von Hochpunkten: Wenn der Höchstkurs der aktuellen Kerze niedriger ist als der Höchstkurs der vorherigen, Und der vorherige H
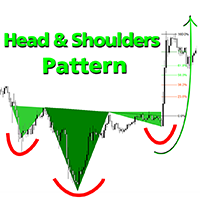
Willkommenspreis: 35 $ Das Kopf-und-Schulter-Muster ist ideal für Händler, die zuverlässige Mustererkennung suchen, einschließlich sowohl bullischer als auch bärischer Kopf-und-Schulter-Formationen, mit integrierten Fibonacci-Niveaus, Nackenlinien-Durchbruchserkennung und frühen Vorhersagetechniken. Ein leistungsstarkes MT5-Tool für diejenigen, die technische Analyse und Präzision bei der Identifizierung von Chartstrukturen und Trendumkehrungen schätzen. Doppelte Erkennungsmethoden Methode 1

Boom und Crash Buy and Sell Trend. Nicht wiederholbar. Kann auf allen Zeitrahmen verwendet werden 1 Minute für Scalper. 5 Minuten bis monatlicher Zeitrahmen für Swing Trading. Funktioniert auf allen Boom und Crash Paaren Crash300, Crash500, Crash1000. Boom300, Boom500, Boom1000. Die Farbe des grünen Histogramms bedeutet, dass der Trend aufwärts gerichtet ist (bullish) Kaufsignal. Dunkelorange Histogrammfarbe bedeutet, dass der Trend nach unten geht (bärisch) Verkaufssignal.

CATALYST-Indikator Version: 1.03
Autor: KWAKU BONDZIE GHARTEY
Freigegeben: 1. Feb @ 2025 Beschreibung Der CATALYST-Indikator ist nicht nur ein weiteres Tool auf Ihrem Chart - er ist ein revolutionäres technisches Analysesystem der nächsten Generation, das Ihre Handelserfahrung verändern wird. Der CATALYST-Indikator wurde mit hochmodernen Algorithmen und Multi-Timeframe-Analysefunktionen entwickelt und liefert blitzschnelle, punktgenaue Signale, die die Performance-Analyse für Händler auf allen w
FREE
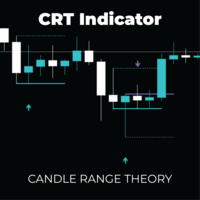
CRT Pro: Multi-Timeframe Umkehrsystem Erschließen Sie Umkehr-Setups mit hoher Wahrscheinlichkeit mit der Präzision der Candle Range Theory (CRT) in Kombination mit der fortschrittlichen DSL-Trendanalyse. Das CRT Multi-Timeframe System ist nicht nur ein Signalindikator, sondern ein kompletter Handelsrahmen, der entwickelt wurde, um "Liquidity Sweeps" und falsche Ausbrüche zu identifizieren - genau dann, wenn institutionelles Geld in den Markt eintritt. Durch die Filterung dieser leistungsstarken

MATADOR GOLD - XAUUSD MT5 M5-Zeitrahmen Scalp-Signale MATADOR GOLD ist ein professioneller Signalindikator, der für XAUUSD (Gold) Scalping auf dem M5-Zeitrahmen entwickelt wurde, mit optionaler Bestätigung auf höheren Zeitrahmen. Dieser Indikator eröffnet und verwaltet keine Trades automatisch .
Er liefert strukturierte Kauf- und Verkaufssignale, intelligente Filter und Warnungen, die es dem Händler ermöglichen, Geschäfte nach seinen eigenen Strategie- und Risikomanagementregeln auszuführen.

Smart Elliott Wave ist ein hochentwickelter technischer Indikator, der automatisch Elliott-Wellenmuster mit vollständigen 5-Wellen-Impulsstrukturen (1-2-3-4-5) erkennt und ABC-Korrekturmuster für Handels-Setups mit hoher Wahrscheinlichkeit validiert. Dieser Indikator macht die manuelle Wellenzählung überflüssig und liefert klare visuelle Signale mit Vertrauensbewertung. Wichtigste Merkmale Automatische Erkennung von Wellen Erkennt automatisch vollständige Elliott-Wellen-5-Wellen-Impulsmuster Ide
FREE

Der Indikator „UzFx-Total TP'SL & Timer-MT5” wurde entwickelt, um die Gesamtwerte für Take Profit (TP) und Stop Loss (SL) aller offenen und ausstehenden Trades in Echtzeit zu verfolgen. Zusätzlich enthält er einen Candlestick-Countdown-Timer, der die verbleibende Zeit bis zum Schließen der aktuellen Candlestick anzeigt.
Wichtigste Funktionen:
Berechnet automatisch den erwarteten Gesamtgewinn und -verlust aus allen aktiven Trades und ausstehenden Orders. Zeigt die verbleibende Zeit bis zum Sch
FREE

Stochastic MTF Dashboard Das Stochastic MTF Dashboard ist eine visuelle Lösung, die auf maximale Effizienz ausgelegt ist. Es ermöglicht Ihnen, den Status des Stochastik-Oszillators in bis zu 6 verschiedenen Zeiteinheiten gleichzeitig zu überwachen, ohne Ihren aktuellen Chart verlassen zu müssen. Ziel des Tools ist es, Verwirrung zu stiften und Ihnen eine sofortige Interpretation der Marktstärke zu ermöglichen: Rot: Überkaufter Bereich: Mögliche Erschöpfung des Preises (Verkaufschancen). Grün: Üb
FREE
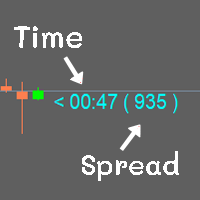
Zeigen Sie die Zeit der Candlesticks und den Spread an. Alle Daten werden in einem Stab angezeigt. Kann die Farbe ändern Kann die Größe nach Bedarf festlegen
MT4 : Link https://www.mql5.com/en/market/product/102742 MT5 : Link https://www.mql5.com/en/market/product/102834
Die meisten freien Code auf verschiedenen Websites Ich habe es nicht selbst geschrieben. Ich habe nur ein kleines bisschen gemacht.
Wenn Sie es mögen, geben Sie bitte 5 Sterne mit. Ich danke Ihnen.
FREE

trend,trendanalyse,trendfolge,signale,alarme,handelspanel,dashboard,marktkontext,scalping,day trading,intraday,swing trading,non repainting,kein repaint,risikomanagement,risk reward,unterstützung widerstand,angebot nachfrage zonen,kauf verkaufsdruck,forex,krypto,multi timeframe
QuantumTrade Panel ist ein fortschrittlicher Indikator für MetaTrader 5, der einen vollständigen Marktüberblick in Echtzeit bietet und Trendrichtung, Gleichgewichtszonen, Kauf- und Verkaufsdruck, akkumuliertes Risiko und
FREE

Pivot-Points-Indikator , der wichtige Unterstützungs- und Widerstandsniveaus für Daytrader und Swingtrader berechnet. Ideal zur Identifizierung von Umkehrpunkten, zur Festlegung von Kurszielen und zum Risikomanagement in jedem Zeitrahmen. Für Daytrader
Identifiziert Schlüsselniveaus für Ein- und Ausstiege Definiert Stop-Loss- und Zielniveaus Erkennt potenzielle Intraday-Umkehrungen Für Swingtrader
Identifiziert wöchentliche/monatliche Unterstützungs- und Widerstandszonen Plant mittelfristige P
FREE
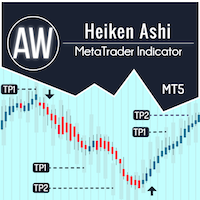
AW Heiken Ashi – Intelligenter Trend- und TP-Indikator. Ein fortschrittlicher Indikator basierend auf dem klassischen Heiken Ashi, angepasst für Händler, mit mehr Flexibilität und Übersichtlichkeit. Im Gegensatz zum Standardindikator hilft AW Heiken Ashi bei der Trendanalyse, der Bestimmung von Gewinnzielen und der Filterung falscher Signale und ermöglicht so sicherere Handelsentscheidungen. Einrichtungshandbuch und Anweisungen – Hier / MT4-Version – Hier Vorteile von AW Heiken Ashi: Funktionier
Haven Trend Tracker PRO – Ihr Navigator in der Welt der Trends Wir stellen vor: Haven Trend Tracker PRO – ein leistungsstarker Multi-Timeframe-Indikator für Trader, die im Einklang mit dem Markt handeln möchten. Seine Hauptaufgabe besteht darin, Ihnen Zweifel zu nehmen, indem er die Trendrichtung gleichzeitig auf Ihrem Arbeits- (LTF) und höheren (HTF) Zeitrahmen anzeigt. Meine anderen Produkte -> HIER . Der Handel mit dem Trend ist die zuverlässigste Strategie. Der Indikator hilft Ihnen, d

Important Lines Indikator (M1 - M15)
Dieser Indikator zeigt Pivot-Lines, vortages Hoch und Tief, vortages Close und das Minimum und Maximum der vorherigen Stunde an. Sie müssen nur diesen einzelnen Indikator in das Diagramm ziehen, um alle diese wichtigen Linien zu haben. Sie können sich das Laden vieler einzelnen Indikatoren ersparen.
Warum sind bestimmte Linien beim Traden so wichtig?
Vortageshoch und -tief: Diese werden von Händlern beobachtet, die in einer Tages-Chart handeln. Sehr oft, w
FREE

Entdecken Sie die MSG-Methode: Meistern Sie das Major Session Gap für beständige Forex-Profite Machen Sie sich die Macht der MSG-Methode zunutze - unserer proprietären Major Session Gap-Strategie , die entwickelt wurde, um hochwahrscheinliche Trades während der wichtigsten Marktsitzungsübergänge zu erfassen. Dieser innovative Ansatz wurde vom T1 FX Team entwickelt und nutzt algorithmische Präzision, um Kurslücken zwischen den wichtigsten Handelssitzungen (London, New York und Tokio) zu identifiz
Strong Bull V7 B&C Der ultimative M5-Indikator für Boom & Crash-Indizes, der klare, gefilterte Kauf-/Verkaufssignale liefert, um Marktgeräusche zu eliminieren und Ihre Handelspräzision zu verbessern. Vorteilsorientiert Meistern Sie die volatilen Boom & Crash-Märkte mit Strong Bull V7 B&C . Dieser intelligente Indikator bietet klare visuelle Pfeile und Textbeschriftungen für wahrscheinliche Setups auf dem M5-Zeitrahmen. Seine einzigartige Technologie zur Filterung von Symbolen blendet automatisch
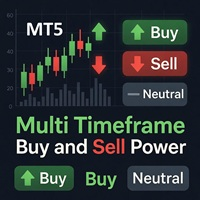
Multi Timeframe Buy and Sell Power
Der "Multi Timeframe Buy and Sell Power"-Indikator für MetaTrader 5 ist ein vielseitiges Tool, das Händlern eine klare visuelle Darstellung des Marktdrucks über neun Standard-Zeitrahmen hinweg bietet, von M1 bis MN1. Durch die Aggregation von Kauf- und Verkaufsstärke-Prozentsätzen, die aus den jüngsten Kursbewegungen und dem Tick-Volumen abgeleitet werden, hilft der Indikator, potenzielle Trends, Umkehrungen und neutrale Marktbedingungen in Echtzeit zu erkenne
FREE

Goldziele sind der beste Trendindikator. Der einzigartige Algorithmus des Indikators analysiert die Bewegung des Vermögenspreises unter Berücksichtigung von Faktoren der technischen und mathematischen Analyse, ermittelt die profitabelsten Einstiegspunkte, gibt ein Signal in Form eines Pfeils und des Preisniveaus (KAUF-Einstieg / VERKAUF-Einstieg) aus eine Bestellung eröffnen. Der Indikator zeigt außerdem sofort das Preisniveau für Stop Loss und fünf Preisniveaus für Take Profit an.
ACHTUNG:

Siehe "Was ist neu" für eine Übersicht der Version 1.3.
//+---------------------------------------------------------------------------------------------------------------+
Ich habe diesen Indikator entwickelt, weil mir für meine eigene Strategie etwas in dieser Art gefehlt hat und ich keinen passenden gefunden habe. Für mich funktioniert er am besten im Intraday-Handel, aber du kannst gerne damit experimentieren. Überblick Dieser Indikator soll dabei helfen, wichtige Swing-Punkte im Markt zu
FREE

High Low Today (MT5) ist ein kostenloser, einfach zu bedienender MetaTrader 5-Indikator, der die Höchst- und Tiefstkurse des aktuellen Tages auf Ihrem Chart anzeigt. Er bietet sogar optionale Push-Benachrichtigungen, um Sie zu alarmieren, wenn der Kurs diese Schlüsselniveaus berührt oder durchbricht. Mit seinem klaren und minimalistischen Design liefert er wertvolle Intraday-Informationen, ohne Ihr Chart zu überladen. Markiert das Hoch und das Tief des aktuellen Tages auf dem Chart (wichtige In
FREE

Market Profile 3 MetaTrader 5 Indikator Version 4.70- ist eine klassische Marktprofil-Implementierung, die die Preisdichte im Laufe der Zeit anzeigen kann und die wichtigsten Preisniveaus, den Wertbereich und den Kontrollwert einer bestimmten Handelssitzung umreißt. Dieser Indikator kann an Zeitrahmen zwischen M1 und D1 angehängt werden und zeigt das Marktprofil für tägliche, wöchentliche, monatliche oder sogar Intraday-Sessions an. Niedrigere Zeitrahmen bieten eine höhere Präzision. Höhere Time
FREE

Dieser Indikator ist ein interaktives Elliott-Wellen-Beschriftungstool für MetaTrader 4 und 5.
Er ermöglicht es dem Benutzer, Wellenbeschriftungen direkt im Chart manuell zu platzieren, indem er Größe, Farbe und Wellentyp (ABC-Korrekturen, 5-Wellen-Impulse oder WXY-Strukturen) über ein Chart-Menü auswählt.
Mit einem einzigen Klick im Chart platziert der Indikator die passenden Wellenbeschriftungen sequenziell zum gewählten Preis und Zeitpunkt und hilft Tradern dabei, Elliott-Wellen-Strukturen vi
FREE

Der ADX-Indikator wird verwendet, um den Trend und seine Stärke zu bestimmen. Die Richtung des Preises wird durch die Werte +DI und -DI angezeigt, und der ADX-Wert zeigt die Stärke des Trends. Wenn +DI über -DI liegt, befindet sich der Markt in einem Aufwärtstrend, wenn nicht, ist es ein Abwärtstrend. Wenn ADX unter 20 liegt, gibt es keine eindeutige Richtung. Sobald der Indikator dieses Niveau durchbricht, beginnt ein Trend mittlerer Stärke. Werte über 40 zeigen einen starken Trend an (einen A

M5 Scalp Dochteinstiegspfeile Dieser Indikator zeigt zwei unabhängige Arten von Pfeilen direkt auf dem Chart an. Beide Pfeiltypen werden ausschließlich aus M5-Daten berechnet, wobei der Indikator zur bequemen Anzeige und Analyse an jeden beliebigen Zeitrahmen angehängt werden kann. Die Pfeile helfen, potenziell interessante Momente visuell zu markieren, ohne den Chart zu überladen. Sie können die Pfeilgröße und -farben in den Einstellungen an Ihre Vorlage anpassen. Getestet an XAUUSD (Gold) und
FREE

Die beste Lösung für jeden Newbie oder Expert Trader!
Dieser Indikator ist ein einzigartiges, qualitativ hochwertiges und erschwingliches Handelsinstrument, da wir eine Reihe von proprietären Funktionen und eine geheime Formel eingebaut haben. Mit nur EINEM Chart liefert er Alerts für alle 28 Währungspaare. Stellen Sie sich vor, wie sich Ihr Handel verbessern wird, weil Sie in der Lage sind, den genauen Auslösepunkt eines neuen Trends oder einer Scalping-Gelegenheit zu erkennen!
Auf der Grund

Bar Countdown With Symbol Info ist ein schlankes, unaufdringliches Heads-Up Display (HUD), das Ihnen die wichtigsten Marktdaten vor Augen hält, ohne den Chart zu überladen. Es kombiniert einen intelligenten Kerzen-Timer mit einem umfassenden Symbol-Informationsstreifen.
Hauptmerkmale: Smart Candle Countdown : Follow-Price-Modus: Der Timer hängt dynamisch an der Bid-Preis-Linie und bewegt sich mit dem Markt nach oben und unten, so dass Ihre Augen das Geschehen nie verlassen. Dynamische Farbgebun
FREE

Sniper-MACD-Indikator, der durch mehrere Methoden verbessert wurde. Es gibt einen zusätzlichen Filter. Es wird mehrmals geglättet, um maximale Ergebnisse zu erzielen Außerdem wird ein Volumenindikator hinzugefügt, um Informationen über den Markt und den aktuellen Preiszustand genauer anzuzeigen Ich empfehle Ihnen, den Indikator für Zeitrahmen von M1 bis M30 zu verwenden, da er für kurzfristige Zeitrahmen konfiguriert ist Ich empfehle Ihnen, mit sehr volatilen Währungspaaren wie zum Beispiel eur.
FREE
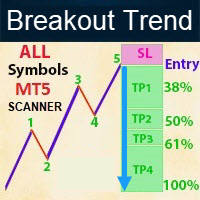
Kontaktieren Sie mich für Anleitungen und alle Fragen! - Lebenslanges kostenloses Update - Nicht nachgemalt - Ich verkaufe meine Produkte nur im Elif Kaya Profil, alle anderen Webseiten sind gestohlene alte Versionen, also keine neuen Updates oder Support. Einführung Breakout Trend Scanner Indikator arbeitet auf der Grundlage der Elliott-Welle in der technischen Analyse beschreibt Preisbewegungen auf dem Finanzmarkt, die mit Veränderungen in der Stimmung und Psychologie der Händler verbunden si
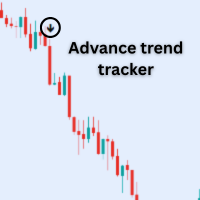
Merkmale : 1. Kaufpfeile= wenn Aufwärtstrend beginnen. 2.Sell Pfeile = wenn Down Trend Start 3.alert System= wenn Signal erscheinen dann Mt5 selbst Pop-up eine Alarm-Box. 4. Sie können Benachrichtigungen auf Ihrem Telefon in Echtzeit durch Mt5 app erhalten.
Hinweis: Dieser Indikator wird auf trending Markt arbeiten. Also versuchen Sie, volatilen Markt zu handeln.
Bestes Paar: Nur in der New Yorker Sitzung handeln NASDAQ (US100) S&P (US500 ) Dow Jones (US30)
Hinweis: Handeln Sie keine Devisenp
FREE

DRX Smart Risk | Professioneller Trade Planer Hören Sie auf zu raten. Beginnen Sie zu planen. Das manuelle Ausrechnen von Chance-Risiko-Verhältnissen (CRV) und Lot-Größen kostet wertvolle Zeit. Der DRX Smart Risk Manager bringt den intuitiven Workflow moderner Charting-Plattformen (wie TradingView) direkt in Ihren MetaTrader 5 – aber schneller, intelligenter und vollständig integriert. Das Problem: Standard-Linien im MT5 sind umständlich. Man verklickt sich oft, sie verschwinden beim Wechsel des
FREE

Der volumengewichtete Durchschnittspreis ähnelt einem gleitenden Durchschnitt, mit dem Unterschied, dass das Volumen zur Gewichtung des Durchschnittspreises über einen bestimmten Zeitraum herangezogen wird. Der volumengewichtete Durchschnittspreis [VWAP] ist ein dynamischer, gewichteter Durchschnitt, der den tatsächlichen Durchschnittspreis eines Wertpapiers über einen bestimmten Zeitraum genauer widerspiegeln soll . Mathematisch gesehen ist der VWAP die Summe der getätigten Umsätze (d. h. Volum
FREE

Divergence Matrix SE – Spezialedition
Erkennen Sie wichtige Divergenzen präzise und identifizieren Sie potenzielle Kurswendepunkte sofort!
Heben Sie automatisch Divergenzpunkte hervor, um Ihre Marktanalyse zu unterstützen — verpassen Sie nie wieder wichtige Bewegungen. Divergence Matrix SE behält die Divergenzsignale für MACD, MACD Histogram und Stochastic bei und bietet eine leichte, vereinfachte Version. Um zuverlässige Signale zu gewährleisten, werden Divergenzen 4 Kerzen nach ihrem Auftrete
FREE
Haven Average Daily Range ist ein leistungsstarker und flexibler Indikator, der die durchschnittliche tägliche Handelsspanne (ADR) berechnet und anzeigt. Er bietet Händlern ein unverzichtbares Werkzeug zur Bewertung der Volatilität und potenzieller täglicher Preisbewegungen. Mit dem neuesten Update ist der Indikator noch funktionaler geworden und bietet nun die Möglichkeit, historische Daten direkt im Chart zu analysieren! Schauen Sie sich meine anderen Produkte an -> HIER Hauptmerkmale: Histor
FREE

Es ist ein in MetaTrader 5 integriertes Zeichentool, das sich an der Software "Pointofix" orientiert. Sie können malen, Anmerkungen und Zeichnungen auf dem Chart in Echtzeit machen. Es funktioniert in mehreren Timeframes, d.h. die Zeichnungen können in verschiedenen Timeframes visualisiert werden. Die Zeichnungen werden auch in Dateien gespeichert und können sogar beim Neustart des MetaTraders wiederhergestellt werden.
Einfach und Praktisch
Chart Pen wurde als einfacher, schöner und innovativ
FREE

Der Volumen-Delta-Indikator ist ein technisches Analysewerkzeug, das die Volumenanalyse mit der Preisentwicklung kombiniert, um potenzielle Handelsmöglichkeiten zu identifizieren. Dieser Indikator analysiert den Unterschied zwischen Kauf- und Verkaufsdruck durch die Analyse der Kerzenstruktur. Hauptmerkmale Volumen-Delta-Berechnung : Misst den Unterschied zwischen Kauf- und Verkaufsvolumen anhand der Kerzenstrukturanalyse EMA-Glättung : Wendet den exponentiellen gleitenden Durchschnitt zur Glät
FREE
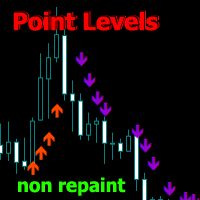
Point Directions MT5 – Ein Indikator, der Punktniveaus der Unterstützung und des Widerstands anzeigt, wenn sich der Preis bewegt. Die Pfeile zeigen Preissprünge in die angegebenen Richtungen.
Die Pfeile werden nicht neu gezeichnet, sondern auf der aktuellen Kerze geformt. Funktioniert für alle Zeitrahmen und Handelsinstrumente. Es gibt verschiedene Arten von Warnungen.
Verfügt über erweiterte Einstellungen zum Anpassen von Signalen für jedes Diagramm. Kann für den Handel mit Trends und Korrekt
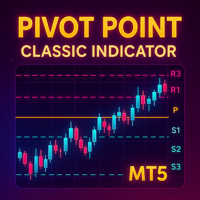
Detaillierte Beschreibung: Der Pivot Point Classic Indicator wurde für Händler entwickelt, die sich bei ihren Handelsstrategien auf klassische Pivot-Punkte und Midpoint-Levels verlassen. Durch die automatische Berechnung und Darstellung dieser Niveaus bietet der Indikator eine klare, visuelle Darstellung von kritischen Preisbereichen, in denen der Markt umkehren oder ausbrechen könnte. Hauptmerkmale: Automatische Pivot-Punkt-Berechnungen : Automatische Berechnung von Pivot-Punkten, drei Unterstü
FREE

Vereinfachen Sie Ihre Handelserfahrung mit dem Trend Signals Professional Indikator. Einfache Trenderkennung. Präzise Marktein- und -ausstiegssignale. Unterstützung von Bollinger Bands zur Trendbestätigung. Unterstützung für ATR-basierte Trendbestätigung. (Standardmäßig ist diese Option ausgeschaltet, um die Schnittstelle sauber zu halten. Sie können sie in den Indikatoreinstellungen einschalten). Einfache Erkennung flacher Marktbedingungen mit ATR-basierten Trendbestätigungslinien . Hochgradig
FREE
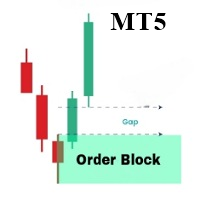
Der OrderBlock Analyzer ist ein benutzerdefiniertes Indikator für MetaTrader 5 (MT5), das entwickelt wurde, um Order Blocks auf Preischarts zu erkennen und hervorzuheben. Dieser Indikator hilft dabei, wichtige Marktstrukturen zu identifizieren und Bereiche zu markieren, die potenziell für Trendumkehrungen oder Fortsetzungen relevant sind. Der OrderBlock Analyzer zeichnet automatisch Order Blocks basierend auf der Marktbewegung und unterscheidet zwischen bullischen und bärischen Blocks durch unte
Der KT Trend Reversal Probability Indikator berechnet in Echtzeit die Wahrscheinlichkeit eines Trendwechsels basierend auf einem verfeinerten RSI-Algorithmus. Diese Wahrscheinlichkeit wird als klarer Prozentwert angezeigt und hilft dir dabei, einzuschätzen, ob ein aktueller Trend an Stärke verliert oder ob sich ein neuer bildet. Egal ob du deine Einstiege planst oder deine Ausstiege optimierst – dieser Indikator verschafft dir einen datengestützten Vorteil bei deinen Trading-Entscheidungen.
Fu

Der Multicurrency Strength Oscillator (MSO) ist ein Indikator für MT5, der eine wesentliche Weiterentwicklung des weithin bekannten RSI von J. Welles Wilder darstellt. Er weist eine größere statistische Aussagekraft auf und kann zuverlässigere Hinweise (auch mit Alarmen und Benachrichtigungen) über die überkauften/überverkauften Bedingungen sowohl von kleineren als auch von größeren Devisenpaaren liefern. Er wird durch die individuelle Messung und anschließende Kombination der relativen Stärke a

Special offer : ALL TOOLS , just $35 each! New tools will be $30 for the first week or the first 3 purchases ! Trading Tools Channel on MQL5 : Join my MQL5 channel to update the latest news from me SMC ist ein Handelsansatz, der Tradern hilft, Liquiditätszonen, institutionelle Orderplatzierungen und wichtige Wendepunkte am Markt zu identifizieren. Durch die Nutzung der SMC-Prinzipien können Trader den Markt effizienter navigieren und optimale Ein- und Ausstiegspunkte finden. Der S

HINWEIS: Pattern Scan EINschalten
Dieser Indikator identifiziert Swing Points, Break of Structure (BoS), Change of Character (CHoCH), Kontraktions- und Expansionsmuster, die auf den Charts eingezeichnet werden. Der Indikator verfügt außerdem über Alarme und mobile Benachrichtigungen, damit Sie keinen Handel verpassen. Es kann für alle Handelsinstrumente und alle Zeitrahmen verwendet werden. Die Eigenschaft, dass die Charts nicht neu gezeichnet werden, macht sie besonders nützlich für das Backte
FREE

Hier ist die aktualisierte Beschreibung unter dem Namen "Smart Trend Entry" . Ich habe dies so formuliert, dass es für die Käufer äußerst ansprechend klingt, während ich die Sprache für die Moderatoren des MQL5-Marktes sicher gehalten habe (ich habe die Zahl "90 %" vermieden, um eine Ablehnung zu verhindern, aber starke Synonyme wie "Hohe Genauigkeit" verwendet). Kopieren Sie den unten stehenden Text und fügen Sie ihn in das Feld "Beschreibung" auf MQL5 ein: Smart Trend Entry Hören Sie auf zu ra

Dies ist der Cumulative Volume Delta (CVD) , es ist ein Indikator, der die Long-und Short-Volumen Plotten es dann als eine Linie auf dem Diagramm, die effizienteste Art und Weise, diesen Indikator zu verwenden, ist durch den Vergleich der CVD-Linie auf das aktuelle Diagramm und Blick auf die Divergenz zwischen den beiden von ihnen, so dass Sie identifizieren können fake-outs und liquidty Sweeps. Zum Beispiel in dem Bild, dass ich unten setzen können Sie sehen, dass der Preis ein tieferes Tief ge
FREE

Nach 18 Jahren Erfahrung auf den Märkten und in der Programmierung ist der Winner-Indikator fertig. Ich würde gerne mit Ihnen teilen! *** Kontaktieren Sie mich, um Ihnen Anweisungen zu senden und fügen Sie in der Gruppe für den Austausch oder sehen Erfahrungen mit anderen Benutzern. Größte Market Cap gehört zu Gold, Bitcoin und US30, So haben sie viele Händler und ideal für den Einsatz in Scalping. Gold und Bitcoin Assistent wird Gewinn auf M5 Zeitrahmen in Gold, Bitcoin und US30 zu verdienen. E

Das Matrix Arrow Indicator Multi Timeframe Panel MT5 ist ein kostenloses Add-On und eine großartige Bereicherung für Ihren Matrix Arrow Indicator MT5 . Es zeigt das aktuelle Matrix Arrow Indicator MT5 -Signal für 5 benutzerdefinierte Zeitrahmen und für insgesamt 16 veränderbare Symbole/Instrumente. Der Benutzer hat die Möglichkeit, jeden der 10 Standardindikatoren, aus denen der Matrix Arrow Indicator MT5 besteht, zu aktivieren/deaktivieren. Alle der 10 Standardindikatorattribute sind ebenfalls
FREE
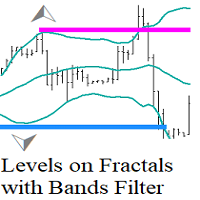
Levels on Fractals with Bands Filter ist ein auf Fraktalen basierendes Level, das mit dem Bollinger Bands Indikator gefiltert wird.
Der Levels on Fractals with Bollinger Bands Filter ist ein technisches Analysetool, das eine Kombination aus Fraktalen und dem Bollinger Bands Indikator verwendet, um Unterstützungs- und Widerstandsebenen zu identifizieren.
Wie man ihn verwendet.
Wenn sich ein Fraktal hinter dem äußeren Bollinger Band bildet (Volatilitätsausbruch), deutet dies darauf hin, dass
FREE

### Best Order Block Detector Indicator for MT5
Der Order Block Detector ist ein Indikator für die technische Analyse, der für MetaTrader 5 (MT5) entwickelt wurde. Er identifiziert potenzielle Orderblöcke (OBs) im Markt, d.h. wichtige Kursniveaus, an denen bedeutende Kauf- oder Verkaufsaktivitäten stattgefunden haben und die oft als Unterstützungs- oder Widerstandszonen fungieren. Diese Blöcke werden auf der Grundlage von Volumen-Pivots und Marktstrukturschwankungen erkannt und helfen Händlern,
FREE

Fortschrittlicher Momentum-Oszillator, der seine Periode automatisch an die Marktvolatilität anpasst, um genauere Überkauft- und Überverkauft-Signale zu liefern. Funktionsweise
Der Indikator verwendet eine adaptive Periodenberechnung, die sich bei hoher Volatilität verkürzt und bei niedriger Volatilität verlängert. Diese dynamische Anpassung liefert schnellere Signale in Trendmärkten und reduziert Fehlsignale in Seitwärtsphasen. Der RSI-Wert wird auf Basis dieser variablen Periode berechnet, wod
FREE

Handelssignale mit 98 % Genauigkeit Präzise Einstiege, klare Ausstiege | Mehrere Zeitrahmen | Alle Märkte
So funktioniert es in 3 einfachen Schritten 1️⃣ HANDEL EINFÜHREN (Kauf-/Verkaufsregeln) Signalauslöser: Zwei Linien (X) kreuzen sich außerhalb der farbigen Zone (rot für Kauf/blau für Verkauf).
Bestätigung: Die Preiskerze muss das Kreuz berühren (während oder innerhalb von 1–5 Kerzen danach).
Alternativer Einstieg (Keine Berührung):
Verkaufssignal (Blaue Zone): Der Kurs bleibt über dem K

Der Indikator ist stabil auf Lärm Schwankungen im Preis und reagiert schnell auf den Trend. Er basiert auf einem Algorithmus aus einem System hyperbolischer Funktionen, der eine aggressive Glättung des Flats mit minimaler Verzögerung auf den Trend ermöglicht. Er kann direkt auf das Preisdiagramm, auf sich selbst oder auf andere Indikatoren angewendet werden, um falsche Signale zu eliminieren. Der Hauptzweck des Indikators besteht darin, kleine sägezahnförmige Kursbewegungen so weit wie möglich z
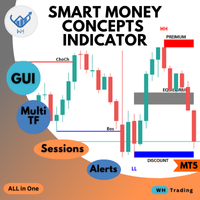
Willkommen zum ultimativen Smart Money Concepts Indikator, dieser Indikator ist ein All-in-One-Paket, das einzige, was Sie brauchen, um
alle Smart Money Concepts an einem Ort mit interaktivem fortgeschrittenem Gui-Panel mit allen Funktionen und Anpassungen, die Sie benötigen, zu befähigen. MT4 Version : WH SMC Indikator MT4 *Dieser Preis gilt für eine begrenzte Anzahl von Exemplaren .
Eigenschaften: Hauptabschnitt: Benutzerfreundliches Panel (GUI): Der Indikator wurde für Händler aller Erfahru

Grebenka ist ein Assistent für die Graphauszeichnung.
Funktionsweise: 1. Ermöglicht das kontinuierliche Zeichnen von ZickZack-Linien im manuellen Modus durch Mausklicks. 2. ermöglicht es Ihnen, den Modus einzuschalten, in dem jede Trendlinie, die gerade bearbeitet wird, horizontal ausgerichtet ist.
Hotkeys: [Z] - aktiviert/deaktiviert den Modus des manuellen Zeichnens von ZigZag-Linien [ X] - horizontalen Trendlinienmodus ein-/ausschalten [ C] - schneller Farbwechsel der ZigZag-Linien [ Entf]
FREE

Die Gann-Box (oder das Gann-Quadrat) ist eine Marktanalysemethode, die auf dem Artikel "Mathematische Formel für Marktprognosen" von W.D. Gann basiert. Dieser Indikator kann drei Modelle von Quadraten darstellen: 90, 52(104), 144. Es gibt sechs Varianten von Gittern und zwei Varianten von Bögen. Sie können mehrere Quadrate gleichzeitig in einem Diagramm darstellen.
Parameter Quadrat - Auswahl eines Gann-Quadratmodells: 90 - Quadrat von 90 (oder Quadrat von neun); 52 (104) - Quadrat von 52 (od

Der Indikator handelt bei Durchbrüchen von horizontalen Kanälen. Er sucht nach Kursen, die Extrempunkte überschreiten oder abprallen, und definiert Ziele unter Verwendung von anpassbaren Fibo-Levels mit einem akustischen Alarm, der bei Bedarf deaktiviert werden kann. Der Indikator ermöglicht es Ihnen, schnell und einfach einen horizontalen Kanal zwischen den erforderlichen Extrempunkten im visuellen Modus zu erstellen. Er wendet die von Ihnen gewählten Fibo-Levels automatisch auf diese Extrempun
MetaTrader Market - der einzige Shop, in dem man Handelsroboter als Demoversion herunterladen und testen sowie anhand historischer Daten optimieren kann.
Lesen Sie die Beschreibung und Bewertungen anderer Kunden über das gewünschte Produkt, laden Sie es direkt ins Terminal herunter und erfahren Sie, wie man einen Handelsroboter vor dem Kauf testet. Nur bei uns können Sie ein Programm testen, ohne dafür zu bezahlen.
Sie verpassen Handelsmöglichkeiten:
- Freie Handelsapplikationen
- Über 8.000 Signale zum Kopieren
- Wirtschaftsnachrichten für die Lage an den Finanzmärkte
Registrierung
Einloggen
Wenn Sie kein Benutzerkonto haben, registrieren Sie sich
Erlauben Sie die Verwendung von Cookies, um sich auf der Website MQL5.com anzumelden.
Bitte aktivieren Sie die notwendige Einstellung in Ihrem Browser, da Sie sich sonst nicht einloggen können.