适用于MetaTrader 5的技术指标 - 9
Ekom Spike Detector
Navigate the volatile world of Boom and Crash indices with the Ekom Spike Detector Indicator. This powerful tool detects explosive price movements, providing traders with precise buy and sell signals 24/7.
Key Features:
Spike Detection : Identify high-probability spike patterns in real-time Clear Visual Signals : Displays clear buy and sell arrows on the chart for easy decision-making Customizable : Easily switch from either Boom based on individuals choice Reliable : Te
FREE
Candle_Timer_and_Spread 指标在一张图表上显示蜡烛结束之前的时间以及价格变化的百分比以及所选交易品种的点差。
默认情况下,当前时间范围内蜡烛结束之前的时间以及价格变化相对于当天开盘价的百分比的计时器位于图表的右上角。 该面板显示所选交易品种当前价格相对于当日开盘价的价差和百分比变化。该面板默认位于左上角。
输入设置: Candle_Time_Lable_Settings - 蜡烛结束前的计时器类型设置以及当前交易品种的价格变化。 Font_Size - 字体大小。 X_offset - 沿横坐标轴移动。 Y_offset - 沿纵坐标轴移动。 Text_color - 字体颜色。 Multi_Symbol_Settings - 多符号面板的设置。 Symbols_to_work - 手动输入面板将显示的符号,以逗号分隔。可以是任意数量的字符。仅显示添加到 Market_Watch 的交易品种。 Show_spread_tab - 是否显示传播列。 Show_daily_change_tab - 是否显示当前价格相对于当日开盘价的变化列。 Colorful_p
FREE

该仪表盘可根据您对所选符号的交易策略,以剥头皮和长期模式在图表上发现并显示供需区。此外,仪表盘的扫描模式可帮助您一目了然地检查所有需要的符号,不错过任何合适的仓位/ MT4 版本
免费指标: Basic Supply Demand
功能 允许您查看多个货币对的交易机会,为您提供所有货币对的清晰简明视图,并根据其与供需区的接近程度进行排序 可定制设置,从颜色到检测参数,满足您的特定需求
主要输入 Indicator mode : 选择指标模式或具有新功能的面板模式 Symbols : 从 "28 种主要货币对 "或 "选定符号 "中进行选择 Selected Symbols : 您希望监控的符号,用逗号分隔("EURUSD,GBPUSD,XAUUSD")。如果您的经纪商对货币对有后缀或前缀,您必须在以下两个参数中添加(货币对前缀或货币对后缀) Trading Style : 选择剥头皮或长期模式 Allowed Deviation : 该参数允许修改需求或供应区域的精确度(数值越小,精确度越高) Zone thickness : 通过该参数可以修改需求和供应区域的厚度。

The indicator looks for consolidation (flat) in the market at a certain time, builds a box-channel and marks levels indented from it for a breakdawn. After crossing one of the levels, the indicator marks the zone for take profit and calculates the corresponding profit or loss in the direction of this entry on the panel. Thus, the indicator, adjusting to the market, finds a flat area of the market, with the beginning of a trend movement to enter it. Version for MT4: https://www.mql5.com/en/market
FREE

推出 Market Structure Break Out for MT5 — 您的专业 MSB 和 Unbroken Zone 指标。 MT4 版本也已上线,请查看: https ://www .mql5 .com /en /market /product /109958 该指标正在持续更新。 我们努力提供基于市场结构的高精度进场和出场点。目前我们处于1.1版本,如果您现在加入我们,以下是最新的更改: 买入和卖出目标: 明确了解买入和卖出位置的最佳获利水平。 最后的MSB方向: 显示最新的市场结构突破方向,以帮助更好地决策。 增强的视觉模式: 使用新的美观模式自定义您的图表,包括亮色、暗色或个性化主题。 实时回测开关: 使用新的屏幕按钮轻松开启或关闭实时回测。 领取您的免费EA:
获取免费的 Market Structure Breakout EA ,它可以根据突破箭头自动开仓,使用固定手数,并可自定义止损和止盈水平。 如何领取:
点击此处下载 EA 。请注意,此 EA 仅在您已购买 Market Structure Break Out 指标 后才能
hello,
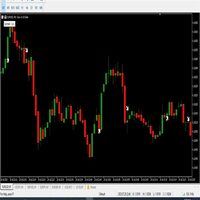
king binary sureshot mt5 binary indicator,
1 minute candle
1 minute expire
Alright. This indicator works on MT5 and is very easy to use. When you receive a signal from it, you wait for that candle with the signal to close and you enter your trade at the beginning of the next new candle. A red arrow means sell and a green arrow means buy. All arrows comes with a long dotted like for easy identification of trade signal. Are you okay with that?
FREE

Sonic R Indicator Description Overview The Sonic R Indicator for MT5 is designed to help traders analyze market trends using moving averages and volume analysis. This tool assists in identifying potential price movements by displaying trend zones and volume strength, making it suitable for various trading strategies. Key Features Dual EMA Trend Channels – Uses 34-period Exponential Moving Averages (EMA) to visualize price movement. Volume Analysis – A color-coded histogram to indicate changes i

This is Heiken Ashi smoothed version, where you can choose on what type smoothness you want to make your strategy base. You can choose between EMA or MA, on the period you want. And you can choose colors.
Definition:
The Heikin-Ashi technique averages price data to create a Japanese candlestick chart that filters out market noise. Heikin-Ashi charts, developed by Munehisa Homma in the 1700s, share some characteristics with standard candlestick charts but differ based on the values used to cre
FREE

Fair Value Gap Finder detects fair value gaps and generates a signal when price returns to one. Set the minimum and maximum fvg size, customize the colors, style, and length, then let the indicator highlight them for you.
Key Features: Automatic FVG highlights - The indicator detects all fair value gaps that fit your criteria and marks them on the chart.
Entry Signal - A signal is created whenever price retests a fair value gap.
Notification - Alerts notify you when a fair value gap or a new
FREE

Trend Battle Indicator
Overview The Trend Battle Indicator is a professional technical analysis tool that reveals the battle between buyers (Bulls) and sellers (Bears) in the market through a comprehensive dashboard. Using an intuitive visual interface, the indicator offers a unique perspective on market power dynamics by analyzing the last twenty bars to provide precise insights into momentum and directional strength. Additionally, the panel provides automatic real-time updates for bars in for
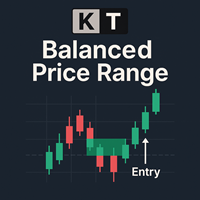
KT Balanced Price Range 指标会高亮显示两个连续相反的 公平价值缺口 (FVG) 的重叠区域。这个概念被称为平衡价格区(BPR),在价格行为交易者中非常受欢迎,尤其是使用聪明资金理念(SMC)和内部圈交易者(ICT)方法的交易者。 交易者通常使用这些 BPR 区域来寻找高概率的交易机会,特别是在回调或趋势延续过程中。BPR 区域往往是市场可能反转、继续或突破的关键点,是把握进出场时机的重要位置。
功能特点
从零开始开发,仅基于经过验证的 FVG 重叠来识别 BPR 区域,确保交易信号质量。 可自定义的 BPR 百分比阈值,用于过滤无效区域,专注于高价值交易点位。 为每个交易机会明确设定止损与盈利目标,基于风险回报比,避免猜测。 内置“最大利润”线,可直观显示每个信号的最高收益,便于绩效跟踪。 完全可定制的视觉外观,包括颜色与线条粗细,可完美融合任意图表样式。 支持所有标准的 MetaTrader 警报方式,确保不错过任何交易信号。
多头 BPR 当一个空头 FVG 之后迅速出现多头 FVG,并且价格保持在重叠区域附近时,就形成了多头 BPR。
空头 BPR

This wonderful tool works on any pair producing alerts whenever the market enters the overbought and oversold zones of the market. The signals come as BUY or SELL but it does not necessarily mean you should go on and execute order, but that you should begin to study the chart for potential reversal. For advanced signal tools check out some of our premium tools like Dual Impulse.
FREE

Advanced Stochastic Scalper MT5 is a professional indicator based on the popular Stochastic Oscillator. Advanced Stochastic Scalper is an oscillator with dynamic overbought and oversold levels, while in the standard Stochastic Oscillator, these levels are static and do not change. This allows Advanced Stochastic Scalper to adapt to the ever-changing market. When a buy or a sell signal appears, an arrow is drawn on the chart and an alert is triggered allowing you to open a position in a timely ma

Bar Countdown is a simple indicator for MetaTrader 5 that shows the time remaining of the each candle. It can be placed in any corner of the chart or near of the price close and it'll help you to know
if the current candle is ending. Choose the counter format between HR:MIN:SEC and MIN:SEC It is so easy to use, configure the color, size and counter position on the chart and that's it!!! The Countdown starts now!
Updates: 2021/02/28; v1.0: Initial release 2021/03/16; v1.1: Minor code changes
FREE

Orderflow Smart Flip ( DEMO版本 ,模式必须选择“每个点基于实时点”才能正常绘制) —— 洞察机构足迹,捕捉顶底转换,让每一条线都有据可依。 重要提示:在下单前,请先联系我,我将为您提供专业的解答和服务
产品简介 告别主观臆测,拥抱数据真相。[最后2张截图为与 OrderFlow Bubbles Pro指标组合使用的场景 ] Orderflow Smart Flip 不是一个普通的画线工具,它是基于 Tick 级微观数据 构建的机构行为分析系统。它像一台X光机,穿透K线的表象,通过实时计算每一笔成交的 量能堆积 (Volume Accumulation) 与 多空失衡 (Imbalance) ,自动识别出机构资金重仓防守的关键价位(支撑位、阻力位)。 它不仅能告诉你哪里是支撑,哪里是阻力,更拥有**“智能反转 (Smart Flip)”** 核心算法——当关键位被有效突破后,它会自动变色并延伸,提示你曾经的阻力已转化为最强劲的支撑(S/R Flip)。 配合独家的 “假突破过滤” 与 “吸筹/派发检测” 功能,它能帮你过滤掉绝大多数的市场噪音与诱多诱空陷阱

The worktime indicator helps you identify the most important times to day to trade the currency pairs. It was created based on the ICT day trading free tutorials that are freely vailable on his youtube channel. You can use this indicator together with my other indicators that i have shared freely with you like the true day, custom periods, daily month, weekly open lines - they together complement each other very well.
Nuggets from this indicator: 1. Draws the asian session box showinng you the
FREE

Indicador gratuito para Metatrader 5 que muestra en pantalla una caja rectangular para cada una de las sesiones de mercado "Londres, New York y Tokio". Se puede establecer la zona horaria de forma automática o mediante un valor de offset. Parámetros de configuración para cada una de las sesiones. Visible / No visible Hora Inicial Hora Final Caja sólida o transparente. Estilo del borde de la caja. Grosor del borde de la caja. Color.
FREE
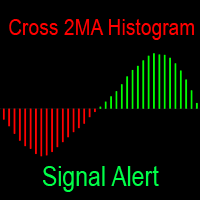
该指标以直方图的形式显示两个移动平均线之间的差异。 移动平均线有巨大的自定义选项。 当直方图的颜色发生变化时,它会以各种方式通知您:它在终端中发出蜂鸣声,向手机发送通知并向邮件发送电子邮件—现在您绝对不会错过任何交易。 一个完全免费的移动平均线交叉指标,以图表上的线条形式显示: https://www.mql5.com/zh/market/product/148478 你的反馈对我很重要。 反馈使发展变得更好,并帮助我们共同前进。 您有任何问题或想分享您的意见吗? 写评论或发送消息-我总是保持联系! 这个工具成为您可靠的助手,接管日常监控市场。 您可以将此任务委托给指标,而不是不断查看图表以预测相交时刻。 它不仅使用清晰的直方图列可视化趋势强度的动态,而且还充当看门狗,在最关键的时刻立即用强大的警报唤醒您。 这使您可以毫不拖延地采取行动,情绪和大惊小怪,严格遵循您的交易策略。 设置的灵活性为具有任何经验和分析方法的交易者提供了机会。 您可以通过将移动平均线周期与任何时间段和交易资产进行匹配来试验移动平均线周期,从分钟图表上的倒卖到长期投资。 该指标将同样有效地用于过滤信号和准确确定进入
FREE

Peak Trough Analysis is the great tool to detect peaks and troughs in your chart. Peak Trough Analysis tool can use three different peaks and troughs detection algorithm. The three algorithm include the orignal Fractals Indicator by Bill Williams, the Modified Fractals indicator and ZigZag indicator. You can use this peak and trough analysis tool to detect the price pattern made up from Equilibrium Fractal-Wave process. For further usage, there are good guide line on how to use this peak trough
FREE

通过此指标释放强大的市场洞察力,该指标在图表上显示可视化订单簿,灵感来源于Nelogica的Profit的Visual Book。它通过水平条形图展示买入量(蓝色)和卖出量(红色),大宗交易量以黄色高亮显示,帮助交易者快速识别高流动性区域。价格通常倾向于向订单集中度最高的区域移动,是识别支撑和阻力水平的关键工具。灵活的自定义设置可适应各种交易风格,实时更新数据让您始终领先市场动态。适用于MetaTrader 5平台上的外汇、股票和其他金融市场分析。此指标简单易用,能够显著提升交易决策的准确性,帮助您捕捉市场突破或反转的机会。需要经纪商提供市场深度(订单簿)数据。立即下载,体验更智能的交易分析! Nakano, Ricardo
FREE

Developed by MMQ — Session Based Market Profile TPO Indicator This indicator organizes price and time information into session-based Market Profiles, helping you identify value areas, points of control, and single prints for more informed trading analysis. Inspired by Jim Dalton’s book “Mind Over Markets”.
LINKS [ Documentation | Upgrade ]
What is Session-Based Market Profile? Session Based Market Profile is a powerful analytical tool that organizes price and time information to reveal mar
FREE

Dark Inversion is an Indicator for intraday trading. This Indicator is based on Counter Trend strategy but use also Volatility. We can enter in good price with this Indicator, in order to follow the inversions on the current instrument. Hey, I made an Expert Advisor based on this indicator, if you are interested: Dark Titan MT5
Key benefits
Easily visible Inversion Lines Intuitive directional arrows Automated adjustment for each timeframe and instrument Easy to use even for beginners Never r
FREE

Boom and crash Gold Miner v2 trend histogram which works in conjunction with the indicator above that has arrows as shown in the video. PLEASE Note: That the top indicator and the bottom indicator are two separate indicators. the top indicator is https://www.mql5.com/en/market/product/98066 the bottom one is free. which is the histogram at the bottom. the trend histogram trading tool that helps to easy detect the trend blue color indicates an uptrend. Orange color is a down trend.
FREE

Cybertrade Auto Fibonacci retraction and projection - MT5
Auto Fibonacci is an indicator that automatically plots the Fibonacci retracement and projection based on the number of bars you select in the indicator setting. You can customize nine different levels of retraction and three levels of projection. It works on periods longer than the period visible on the chart. All values are available in the form of buffers to simplify possible automations. This indicator is the same one we use in ou
FREE

无需手动绘制,几秒钟内获取清晰的市场结构!
HTF 自动支撑与阻力指标 会自动在图表上标记关键的支撑和阻力位。这些水平基于更高周期(HTF),因此比随机的短期线更可靠。 主要功能: 自动检测最强支撑与阻力区 多周期分析:选择更高周期获得更精准水平 颜色区分的清晰区域,方便快速识别 无主观误差 – 水平根据固定规则客观计算 适用于所有市场:外汇、指数、大宗商品、加密货币 开箱即用 – 默认设置已优化 交易者优势: 快速判断市场可能转向或反应的位置 只在强区域交易,过滤掉不良交易机会 节省时间,并用一致的分析水平提高胜率 非常适合剥头皮、日内交易和波段交易 使用提示: 在设置中选择偏好的更高周期(如 H4、D1、W1) 将这些区域与价格行为或K线形态结合使用 观察市场在这些水平的反应,并提前规划交易
FREE

This is Wilder's ADX with cloud presentation of DI+ & DI- lines. Features
4 standard lines of the ADX indicator: DI+, DI-, ADX, ADXR cloud presentation of DI+/DI- lines with transparent colors applicable to all time-frames and all markets
What Is ADX
J. Welles Wilder Jr., the developer of well-known indicators such as RSI, ATR, and Parabolic SAR, believed that the Directional Movement System, which is partially implemented in ADX indicator, was his most satisfying achievement. In his 1978 book,
FREE

Custom Spread Indicator *Please write a review, thanks!
Also MT4 version is available
Spread Indicator show the current spread in pips with color codes. Handle 3 levels, Low, Medium, High. You can set levels and colors for each level (eg. Low: Green, Medium: Orange, High: Red), and can choose display position on the chart.
There is two spread calculation mode: -> Server spread value -> Ask - Bid value
Can set opacity, for better customization. When spread jump bigger, then display do not
FREE

ICT Silver Bullet
If you are searching for a reliable indicator to trade the ICT Silver Bullet concept, or ICT concepts, Smart Money Concepts, or SMC, this indicator will respond to your need! Before version 2.2, this indicator was focused only on ICT Silver Bullet, but moving forward, we will include the different elements for smart money concept trading. This indicator will help you identify the following: FVG - fair value gaps Market structure: BOS and CHOCH. It is based on swing high and l

什么是 SMA Reentry SMA Reentry 是一款专业指标,通过两条简单移动平均线(SMA),一条快线和一条慢线,提示顺势重新入场的关键点。该指标能够清晰地显示价格在慢速SMA定义的趋势下,何时重新回到快速SMA之上或之下。非常适合需要明确回调(pullback)、突破(breakout)和趋势回归信号的交易者。 工作原理 通过快慢SMA交叉识别主要趋势。 明确标记回调与重新入场信号,每当价格回到快速SMA之上(或之下)时显示箭头,确认趋势延续。 提供周期、线条和箭头颜色、箭头与价格距离等可自定义输入。 直接在图表上显示两条SMA,便于可视化分析。 适用对象 采用趋势跟随策略或想优化回调入场点的交易者。 突破与趋势回归策略用户。 需要捕捉价格在修正后恢复趋势关键点的交易者。 适合主观和系统化交易者。 主要特性 明确的趋势跟随入场信号。 简单且完全可定制的配置。 图表直观显示两条移动平均线。 直观箭头提示重新入场信号。 适用于所有时间周期和金融品种。 推荐搭配 提升你的交易策略,推荐搭配以下指标使用:
Candlestick Pattern Analyzer: https:/
FREE

Projective SR – 实时预测的支撑与阻力 Projective SR 是一款先进的指标,它能自动检测图表上的 关键支撑与阻力点 ,并以 动态的对角线形式将其预测至未来 ,从而预示价格可能发生反应的潜在区域。 与只显示固定水平的传统指标不同, Projective SR 分析价格的几何结构 ,识别出最相关的 关键点 (Pivots) ,并绘制出 倾斜的线条 来适应市场走势。 这些线条 实时更新 ,并在新K线形成时展示价格结构是如何演变的。 技术特点 (Jìshù Tèdiǎn) 基于 K 线结构的自动关键点检测 (高点和低点)。 精确的几何预测 ,使用 实时计算 (而非基于K线数量)。 预测性的支撑与阻力线 ,能够预见未来的价格走势。 灵活的配置: 关键点敏感度、预测长度、颜色、粗细和标签。 稳定模式: 除非检测到新的确认关键点,否则线条保持固定不变。 优势 (Yōushì) 帮助您 清晰地可视化市场可能的方向 。 允许您 提前发现 结构区域内的 突破或反弹 。 是 剥头皮 (Scalping) 、 波段交易 (Swing) 或 高级技术分析 的理想选择。 兼容任何交易品种或
FREE

Special offer : ALL TOOLS , just $35 each! New tools will be $30 for the first week or the first 3 purchases ! Trading Tools Channel on MQL5 : Join my MQL5 channel to update the latest news from me 通过 Inversion Fair Value Gaps Indicator 解锁 ICT 的 反转公平价值缺口 (IFVG) 概念的强大功能!这款尖端工具将公平价值缺口 (FVG) 提升到新的水平,通过识别并显示反转 FVG 区域——价格修复后形成的关键支撑和阻力区域。无论您是短线交易者、波段交易者还是长期投资者,IFVG 指标都能为实时决策提供宝贵的见解。 查看 MT4 版本: Inversion Fair Value Gaps MT4 Multi TF 查看更多产品: 所有 产品 Some Usage Tips for Inversion Fair Valu

该指标显示看涨和看跌背离。指标本身(如常规随机指标)显示在子窗口中。 图形界面 : 在主窗口中,创建图形对象“趋势线” - 从“最低”价格到“最低”价格(对于看涨背离)生成,从“最高”价格到“最高”价格(对于看跌背离)生成)。该指标仅使用图形缓冲区在其窗口中绘制:“主”、“信号”、“点”、“买入”和“卖出”。 “买入”和“卖出”缓冲区显示背离 - 由于这些是真实的指标缓冲区,因此它们都可以从 EA 中读取。 点缓冲区用于更清晰地可视化分歧点。 选项 : “严格信号” - 如果将此参数设置为“true”,则看涨背离仅针对值“main”<=“Value Level #1”(默认为“25”),而看跌背离仅适用于值“main”> =“Value Level #2”(默认值为“75”)。 1.15 “最大柱数”现在限制了绘制的柱数 - 这也提高了启动指标的速度。

What is the Volume Weighted Average Price (VWAP)? The volume weighted average price (VWAP) is a trading benchmark used by traders that gives the average price an instrument has traded at throughout the day, based on both volume and price. It is important because it provides traders with insight into both the trend and value of the instrument.
What is the Difference between VWAP and AVWAP? While VWAP is having as starting point the beggining of the day,week,month etc. in the AVWAP you can pla

CDI Asymmetric Channel PRO – Feature Overview This indicator is a hybrid channel tool that combines three powerful approaches: statistical modeling (long-term) , wave-following logic (short-term) , and quantified distortion analysis (subwindow) —all anchored by a shared fractal peak detection engine. 1. Hybrid Adaptive Algorithm While using a unified fractal detection engine, the indicator simultaneously applies three distinct calculation models with different roles: 1-1. Short-Term (Small Chann

多时间框架锯齿形调整浪指标。 它显示支撑/阻力水平线及其突破,并绘制当前的市场目标。 它还可以显示分形指标的线条和其他时期(最多季度)的蜡烛。指标——连接关键低点和高点以显示趋势线。
该指标重新绘制最后一个(当前)点,并且在某些情况下可以更改最后 2-3 个点。
所有线条均绘制为对象( 不是指标缓冲区,但有可能接收 EA 的数据 )。 在 Expert Advisor 中使用时,您可以使用 iCustom 读取 ZigZag 点。
设置 Mode — 根据计算支撑位和阻力位 — Zig Zag — ZigZag 指标; — ZigZag Close — 之字折线收盘指标; — Fractals — 分形指标; — High-Low of the period — 通过高低水平构建指标。 时间范围在Period参数中指定; — Candles only — 仅绘制蜡烛; Depth — 如果最后一根蜡烛的偏差小于(或大于)前一根,则 Zigzag 将不会绘制第二个最大值(或最小值)的烛台的最小数量; Deviation — 锯齿形形成局部顶部/底部的两个相邻烛台的最高点

Strifor Lot Calculator is a tool for MetaTrader 5 that helps traders calculate the correct lot size based on risk and stop-loss.
It allows you to trade more consciously, manage risks better, and save time on manual calculations. Advantages Accurate risk control – automatically calculates the lot size according to your chosen risk %. Two working modes – manual input or quick calculation using chart lines. Supports all popular instruments – forex pairs, gold (XAUUSD), oil (USOIL/WTI), indices (US
FREE

This is a simple order block locator. Searched for the existence of order blocks only at extremums. If you want multi criteria order block location check my other indicator which is more powerful here These order blocks are ICT order blocks without any buttering.
The indicator can be a useful tool for detecting reversals, continuations. You can also use the indicator as confluence with your other tools
FREE

The Hull Moving Average is not very well know in novice and maybe in intermediate trading circles, but it is a very nice solution created by the trader Alan Hull - please visit www.AlanHull.com for full details of his creation. The purpose of this moving average is to solve both problems that all famouse and common moving averages have: Lag and Choppiness . The implementation we did has, apart of the Period configuration and Price type to use in the calculations, a "velocity" factor, which could
FREE

SMC Precision AI Unlock the edge of institutional trading with SMC Precision AI – an advanced AI-powered Smart Money Concept (SMC) based FIBO Retrenchment indicator built for serious traders who want precision, clarity, and high-probability trade setups.
Key Features It Plots Fibo Retrenchment Zones.
AI-Powered Signals – Enhanced by real-time AI logic to adapt to changing market conditions with Reasonable accuracy
Signal Clarity – It Draws Fibo Bands- When the Lower Line Is drawn it indicat

Auto Candle Sequence Counter – MT5指标 概述
Auto Candle Sequence Counter 是一款专业的 MetaTrader 5 指标,可以自动检测并标记连续的多头/空头K线序列。该工具提供实时可视化、统计和提醒,帮助交易者快速分析价格动能和趋势。 主要功能 检测2–7根连续K线(看涨或看跌)。 实时信号,无遗漏。 Doji检测(灵敏度0.01–0.10可调)。 过滤弱势/噪音K线。 专业可视化(绿色=看涨序列,红色=看跌序列,黄色=Doji)。 实时统计面板:多头/空头序列数量。 报警系统:弹窗、声音、推送通知。 优势 快速识别趋势延续或动能衰竭。 与供需、支撑/阻力、SMC结合使用。 适合剥头皮、波段和日内交易。 节省时间,不再手动数K线。 参数设置 序列阈值:2–7根K线。 回溯范围:50–500根。 Doji灵敏度:0.01–0.10。 主题:黑/白背景。 提醒:弹窗、声音、推送。 兼容性 平台: MetaTrader 5 市场: 外汇、黄金、指数、股票、大宗商品、加密货币 时间周期: 所有 (M1–MN1) 免责声明
该指
FREE

Are you tired of drawing Support & Resistance levels for your Quotes? Are you learning how to spot Support & Resistances? No matter what is your case, Auto Support & Resistances will draw those levels for you! AND, it can draw them from other timeframes, right into you current chart, no matter what timeframe you are using... You can also Agglutinate regions/zones that are too much closer to each other and turning them into one single Support & Resistance Level. All configurable.
SETTINGS
Timefr
FREE

凤凰自动斐波那契监控器(MT5)
专为MetaTrader 5设计的专业斐波那契智能波动分析工具。通过实时可视化仪表盘自动识别主导市场波动,提供先进的斐波那契回撤分析洞察。
概述
凤凰自动斐波那契监测器运用更高周期枢轴点与ATR验证技术自动识别主要市场波动,并将智能斐波那契回撤位直接绘制于图表。系统持续追踪0.0%、23.6%、38.2%、50.0%、61.8%及100.0%关键位,并随新波动形成动态调整。
每个斐波那契位均从五大维度进行分析:精确价格、强度分类(基于有效触及次数划分为强/中/弱)、距离分类(相对于当前价格的接近/中等/远离)、上次交互后的K线数量,以及状态分类(有效、突破或未测试)。状态逻辑可自动识别价位在价格结构演变中被尊重、突破或重新确认的情况。
该指标配备简洁专业的六列仪表盘,可一览所有斐波那契情报,并配有清晰的上升/下降趋势状态指示器。斐波那契线直接绘制于图表,自动标注百分比标签,可选摆动结构线,并突出显示黄金区域以加速决策。用户可选择仅向前延伸或覆盖全图的线条显示模式。
区域宽度可通过ATR自动计算以适应市场敏感度,亦可手动以点数定义。所有计算均
FREE

Smart Entry Levels - Fractal and ATR Based Indicator Smart Entry Levels identifies key support and resistance zones using classical fractal detection and ATR-based volatility measurement. The indicator is designed for clarity, stability, and compliance with MQL5 Market rules. Features Upper Zone - Resistance area based on recent fractal highs Lower Zone - Support area based on recent fractal lows ATR-based sizing - Zones adapt dynamically to market volatility with selectable timeframe Non-repain
FREE

这是一个非常简单的指标,每个人都易于使用。 但是,它非常直观、有用且有效。 它适用于每个外汇交易品种和任何时间范围。 但根据我的测试和调查,我不建议将它与时间帧 M1、M5、M15 一起使用。
环境 。
- 选择警报开/关(默认开)。 - 选择两次警报之间的时间(秒)。 默认为 30 秒
怎么运行的?
- 上升趋势——当条形颜色为绿色时。 - 下降趋势——当条形颜色为橙色时。 - 如果柱的颜色发生变化,则会发生逆转。
使用建议
在上升趋势中买入,柱线的高点大致相同(绿色)。 在下降趋势中卖出和柱线的高点大致相同(橙色)。 避免在反转刚刚发生时进入市场,考虑 2 或 3 连续柱。 如果需要,您还可以更改上升趋势和下降趋势中条形图的颜色。
如果它与 KPL 摆动指示器结合使用,那就完美了 KPL Swing Indicator
FREE

VM Heiken Ashi Pro
Heiken-Ashi 平滑处理(HMA 或 EMA)用于滤除噪声并生成清晰的 BUY/SELL 信号,非重绘(可选 ConfirmOnClosedBar)。在图表上显示 HA 蜡烛(可隐藏原始蜡烛),箭头位置可按 ATR 或固定偏移设置,发送提醒(弹窗、电子邮件、推送)并具备防垃圾信息处理。 主要用途
将原始蜡烛转换为平滑的 Heiken-Ashi 以检测颜色变化(空头到多头 / 多头到空头)并绘制入场箭头。选项 ConfirmOnClosedBar 使指标在蜡烛收盘后才确认信号以避免重绘。UseATRForArrowOffset 使箭头显示更合理。该指标轻量且在多个图表上稳定运行。 快速使用
附加指标,选择 Smoothing Method 和 Smoothing Period(默认 50),如需非重绘确认信号请启用 ConfirmOnClosedBar,按需启用提醒,并保存模板。 推荐时间框架
优先 H1-D1 以获得可靠信号。M5-M15 可用于剥头皮,但请小心并启用蜡烛收盘确认。 关键参数 Smoothing Period -

Watermark Centralized
Adds a watermark centered with the asset name and chosen period.
It is possible to override the font type, font size, font color and separator character.
The watermark is positioned behind the candles, not disturbing the visualization.
It has automatic re-centering if the window is resized.
Hope this indicator helps you, good trading ;)
FREE
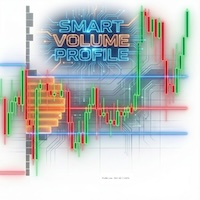
Chinese (Simplified) 扫描 "Smart Money" (成交量标记): 箭头指示异常成交量(高于平均水平),并以清晰的红/绿颜色区分。这有助于识别主力资金(Smart Money)的入场点,并过滤掉虚假信号。 关键警报 (Alerts): 无需时刻盯着屏幕。当价格穿越 POC 线(成交量控制点)时,系统会立即发出警报,这通常是决定趋势延续或反转的关键点。 即时市场结构 (Developing Profile): 显示当前正在形成的价格周期的分布图。让您一目了然地看到价格是正在脱离累积区,还是正在被拉回均值。 Chinese (Simplified) 该指标非常适合专注于 Price Action (价格行为) 和 Volume Analysis (量价分析) 的交易者,因为它能将普通的裸K图表转化为一张清晰的**“作战地图”**,直观地告诉您: 关键点位在哪里: (通过 Pivot 和 POC 判断) 谁在主导市场: (观察绿色/红色的成交量标记) 是否值得入场: (利用成交量与突破形态的相互验证)

Candle Range Theory - CRT
Mark Candle Range Theory - CRT bars on the chart.
Options:
choose between 2 bar CRT or CRT that include inside bars Show higher time frame CRT on lower time frame chart show current time frame CRT on chart with higher time frame CRT Alert when new CRT has formed Show / Hide Labels
Button Menu to select Options
for more information on using Candle Range Theory - CRT look on X for @Romeotpt
@SpeculatorFL
Manual

支点交易 : 1.pp 支点 2. r1 r2 r3 , s1 s2 s3 交易实用必备工具指标 波浪自动计算指标,通道趋势交易 完美的趋势-波浪自动计算通道计算 , MT4版本 完美的趋势-波浪自动计算通道计算 , MT5版本 本地跟单复制交易 Easy And Fast Copy , MT4版本 Easy And Fast Copy , MT5版本 本地跟单复制交易 模拟试用 Easy And Fast Copy , MT4 模拟账号运行 Easy And Fast Copy , MT5 模拟账号运行 合作QQ:556024" 合作wechat:556024" 合作email:556024@qq.com" 专业EA指标定制编写.
支点( pivot points) 作为一种交易策略已经很长时间了,最初是场内交易员使用这种方法。使用这种方法通过几个简单的计算就可以了解市场在一天中的去向。 支点法中的支点是一天中市场方向的转向点,通过简单地计算前日的高点、低点和收盘价,可以得到一系列点位。这些点位可能形成关键的支撑和阻力线。支点位,支撑和阻力位被统称为支点水位。 你所看到的市场每天
FREE

RBC 范围柱线图表 是一款经典范围柱线指标。本指标的功能是提供价格区间图表: 最高价/最低价区间是一个经典的用于分析的选项。它也有开盘价, 最高价, 最低价和收盘价。在第一个选项里, ;两个价格数值同时被分析, 而其它选项只使用一个。以往,范围柱线使用即时报价绘制,但由于即时报价数据未在服务器上提供,图表只可能基于标准时间帧的柱线数据。您应该记住,时间帧越大,图表越粗糙。本指标实现通过标准时间帧选择。 在首次运行时, 您应该按下 R 键 或等待在设置里指定的 'Update period chart'。这将初始化图表。如果指标给出拷贝错误,这意味着正在从服务器拷贝数据的过程中,这可能需要一些时间,您可稍后重试。 注: 如果您选择了一个十分大的时间段来进行分析 (早于开始日期), 则图表需要很长时间, 因为事实上指标在开始阶段要从服务器上拷贝大量数据; 当在策略测试员里进行测试时, 分析的开始数据应早于开始时间一周或一个月 (依赖指定的步长)。 指标设置 Magic number - 独有指标数字,如果同时运行多个指标此数字很有必要 (每个指标必须有自己的魔幻数字); Period o

描述。 Renko图表形成的基础是价格范围。 如果价格超出其限制,图表显示一个框高于或低于前一个。 因此,我们看到价格走势没有额外的"噪音"和重要的支撑和阻力水平。 特征。
为了与专家顾问一起使用,实现了一个额外的缓冲区-一个盒子计数器. 为了方便和提高测试速度,用户可以使用"新框"事件,指示器在出现新框时生成该事件。 您可以设置"反转"框的大小。 无论测试开始点如何,指标始终构建相同。 没有"重绘"。 一旦到了那里,拳击就不会再改变了。 无论从哪里启动,它都将被绘制相同。 输入参数:
RenkoBoxSize = 20; //Box size ReversBcnt = 2; //Box's for reverse RenkoBoxDrawCNT = 100; //Box's for draw Price = bid; //bid, ask, (ask+bid)/2 RenkoBoxEventId = 123; //Box's event
FREE

使用简单的拖放 EA 将 MetaTrader 5 连接到 Python 的文档。 一个完整的端到端解决方案,经过全面测试,快速高效!
PyTrader 生态系统由一个 Python 脚本和一个 MT5 或 MT4 版本的 EA 组成。 此外,为了获得许可,还使用了一个指标。 Python 脚本和 EA 之间的通信基于套接字。 EA 是服务器,Python 脚本是客户端。 总是查询(函数 / Python 脚本)和输出(数据 / 服务器)。 EA 不需要在与运行 Python 脚本相同的计算机上运行。 在我们的 GitHub 链接中,您将找到 Python 脚本、EA、完整的文档和一个显示如何调用函数的 PyTrader 示例脚本。 如果有任何问题,我们还有一个 Discord 频道。 在演示版本(没有许可指标)中,功能齐全,但支持的工具数量有限 (EURUSD, AUDCHF, NZDCHF, GBPNZD 和 USDCAD)。
下载 EA => 这里
演示支持:EURUSD, AUDCHF, NZDCHF, GBPNZD 和 USDCAD
Python MT

This indicator finds and displays the Double Bottom and Double Top technical analysis patterns. Signals (displays a message on the screen) if the shape was formed recently. Often after the appearance of these patterns, the trend reverses or a correction occurs. In order not to search for them yourself, or not to miss their appearance, it is enough to add an indicator to the chart. The indicator can be used on different timeframes and currency pairs, there are settings for a better search on a c
FREE

TB5 Channel is a multi- timeframe channel indicator. It generates input points on different timeframes. There are 2 methods for constructing an indicator. The first method is to install the indicator on the current timeframe. In this case you will have a channel on that timeframe that you have at MT5. The second method to install an indicator is to multiply it by the timeframe index. The point of the second method is to construct a higher timeframe channel on the current chart. For example, i

This indicator belongs to the family of channel indicators. These channel indicator was created based on the principle that the market will always trade in a swinging like pattern. The swinging like pattern is caused by the existence of both the bulls and bears in a market. This causes a market to trade in a dynamic channel. it is designed to help the buyer to identify the levels at which the bulls are buying and the bear are selling. The bulls are buying when the Market is cheap and the bears a

The Super Trend is one of the best trend-following indicator for MT5 platforms. It's working fine for real-time trend alerts and accurate signals and it help to identify the best market entry and exit positions. This indicator is the tool you can refers to a trend following overlays. It contains two major parameters: the period and the multiplier. Besides, traders should consider default values that include 10 for every true range aтd 3 for the multiplier. 2 Types TP SL you set in input Point
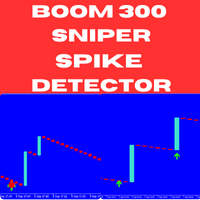
Introducing the Boom 300 Sniper Spike Detector – a powerful, non-repainting indicator specifically engineered to help you master spike trading in the Boom 300 market. Whether you're a seasoned trader or new to the game, this tool offers precise and timely signals, allowing you to catch spikes with confidence and improve your overall trading performance. Key Features: Non-Repainting Signals : Ensures consistent and accurate signals that do not repaint, providing you with reliable data to make con
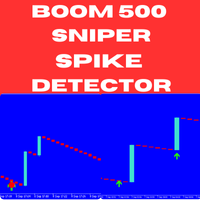
Introducing the Boom 500 Sniper Spike Detector – an advanced, non-repainting indicator specifically crafted to help you capture spikes in the Boom 500 market with precision. Whether you are an experienced trader or just starting, this indicator provides reliable signals that simplify spike trading, making it an essential addition to your trading arsenal. Key Features: Non-Repainting Signals : The Boom 500 Sniper Spike Detector generates highly reliable signals that do not repaint, allowing you t

锚定VWAP (AVWAP) 与标准差带 – MT5 通过精确的锚定VWAP和动态标准差带,显著提升您的交易水平。该工具专为追求速度、清晰度和实用市场洞察的交易者设计,无论是日内交易、波段交易还是算法交易,都能提供强大支持。 主要功能: 多重锚点设置: 可添加无限数量的VWAP,自定义起始日期和时间,方便跟踪不同时间段的市场表现。 高级标准差带: 每个VWAP可添加最多三条标准差带,倍数可自由调整,实现精准波动率分析,辅助识别潜在支撑和阻力区域。 实时市场洞察: 直观显示关键趋势、支撑/阻力水平及可能的反转点,帮助交易者快速做出决策。 直观操作界面: 设计简洁美观,操作方便,能够在高波动市场中迅速判断交易机会,提高操作效率。 为什么交易者选择它:
结合专业级分析工具与简洁易用的界面,使其成为任何交易策略的理想搭档。通过更加清晰的市场洞察,提升交易决策的准确性,实现长期稳定盈利。
FREE

The indicator plots a trend channel using the technique by Gilbert Raff. The channel axis is a first-order regression. The upper and lower lines show the maximum distance the Close line had moved away from the axis line. Therefore, the upper and lower lines can be considered as resistance and support lines, respectively. A similar version of the indicator for the MT4 terminal
As a rule, most movements of the price occur within a channel, going beyond the support or resistance line only for a sh
FREE

Description CAP Channel & Hull Moving Average Crossing Strategy is a powerful and smart trading indicator designed to identify high-probability market reversals and trend-based entry points . This indicator combines the strength of the CAP Channel and the Hull Moving Average (HMA) to detect price overextension and confirmation-based reversals . When price moves outside the CAP Channel and then returns inside with Hull MA confirmation, the indicator generates accurate BUY and SELL signals . Core
FREE

改进版 MACD Histogram(基于动能变化) MT5 自带的 MACD 指标,量柱使用的是 MACD 线本身的数值 。在快速波动或震荡行情中,这种量柱往往变化较慢,难以直观反映短期多空动能的加速或减速,尤其在价格尚未出现明显反转前,信号滞后较明显。 本版本采用更经典的 MACD Histogram 定义方式 : 量柱 = MACD − Signal 这种设计可以更敏感地捕捉 多空动能的变化趋势 ,帮助交易者直观观察动能的加速或减速。量柱由负向(空头)到正向(多头)的过渡,将比默认 MACD 更早地提示潜在的趋势动向。 请注意: 本指标 不是独立交易系统 ,不用于自动开平仓 不预测价格 ,仅提供动能观察工具 建议结合 支撑阻力、趋势结构、其他指标 一起使用,以辅助交易决策 本指标 免费发布 ,旨在为 MT5 用户提供一种更直观的动能分析方法 此外,本版本提供了更清晰的颜色区分和柱体视觉效果,负向动能区以红色标示,正向动能区以绿色显示,使交易者能够快速判断市场多空力度和潜在动能转折点。 通过这种方式,交易者可以在保持 MT5 操作习惯的同时,获得比默认 MACD 更敏感的动能提示
FREE

该指标用于在价格图表上显示分形,帮助交易者识别重要的局部极值点。分形是图表上的特殊点,符合经典定义:如果中心蜡烛高于两侧的两根相邻蜡烛,则形成局部高点;如果中心蜡烛低于两侧的两根相邻蜡烛,则形成局部低点。 其他产品 -> 点击这里 主要功能和优势 : 灵活显示 — 该指标允许使用不同的符号可视化上分形和下分形,包括圆形、方形、三角形等各种形状。 可自定义颜色 — 可以调整颜色方案以提高图表的可见性。例如,可以将上升分形标记为绿色,而下降分形标记为红色。 可调节偏移 — 垂直偏移设置允许您方便地放置分形标记,避免它们与蜡烛重叠。 兼容所有时间周期 — 该指标可在所有时间框架下正常运行,从一分钟 (M1) 到月线 (MN),使其成为一个通用工具。 适用于所有金融工具 — 支持对股票、货币对、加密货币及其他资产的分析。 帮助识别关键水平 — 分形可用作构建支撑位和阻力位的参考,并可用于识别潜在的趋势反转。 该指标对于使用技术分析策略的交易者特别有用,例如趋势交易、确定进场和出场点,以及分析价格在重要水平附近的行为。它可以作为一个独立的工具,也可以与其他指标结合使用,以确认交易信号。 该指标
FREE

RABBY: The "Momentum Dislocation" Indicator for XAUUSD M1 (Also suitable for Indices like Nas100 M1)
Gold M1 (XAUUSD)
Stop Getting Trapped by M1 Noise. Start Trading the Dislocation.
The first indicator that visualizes "Price Detachment" for high-precision entries.
You don't need another arrow. You need to see the Structure of the move.
If you trade Gold (XAUUSD) on the 1-minute timeframe, you know the feeling: An indicator prints a "Buy" signal. You enter. Two minutes later, the cand

FXLAND Smart Reversal Indicator (MT5)
FXLAND Smart Reversal Indicator is a professional technical analysis tool designed to help traders identify potential price reversal zones and key market turning points with clarity and precision.
The best reversal indicator and price return by choosing only one ceiling or floor in each time frame
A masterpiece of combining mathematics and Gann, fractal matrix, Fibonacci, movement angle and time. Completely intelligent
Key Features
Detects potenti

Ultimate Boom and Crash 指标
Ultimate Boom and Crash 指标由 Coetsee Digital 开发,是一款先进工具,旨在识别市场中的潜在暴涨机会。该指标专为关注 Deriv 和 Weltrade 合成市场的交易者设计,仅在 3 分钟 (M3)、5 分钟 (M5)、15 分钟 (M15)、30 分钟 (M30) 和 1 小时 (H1) 时间周期上运行,并仅支持以下交易对:PainX 1200、PainX 999、PainX 800、PainX 600、PainX 400、GainX 1200、GainX 999、GainX 800、GainX 600、GainX 400、BreakX 600、BreakX 1200、BreakX 1800、SwitchX 600、SwitchX 1200、SwitchX 1800、Crash 1000 Index、Crash 900 Index、Crash 600 Index、Crash 500 Index、Crash 300 Index、Boom 1000 Index、Boom 900 Index、Bo

MACD 日內趨勢 PRO 是通過改編自 Gerald Appel 在 1960 年代創建的原始 MACD 而開發的指標。
通過多年的交易,觀察到通過使用斐波那契比例更改 MACD 的參數,我們可以更好地呈現趨勢運動的連續性,從而可以更有效地檢測價格趨勢的開始和結束。
由於其檢測價格趨勢的效率,還可以非常清楚地識別頂部和底部的背離,從而更好地利用交易機會。
特徵 MACD 日內趨勢 PRO 指標適用於任何貨幣對、任何時間範圍以及 Renko 圖表。 可以通過選擇 6 種模式來設置趨勢檢測速度: 最快的 快速地 普通的 減緩 最慢
資源 它有 6 個可配置的警報: MACD回調信號線 MACD穿越信號線 MACD穿過零水平 信號線過零電平 MACD 變化趨勢顏色 信號線變化趨勢顏色 對於每個警報,可以配置: 彈出 聲音(有 13 種聲音可用。) 智能手機通知 彈出窗口和聲音 彈出窗口和智能手機通知 聲音和智能手機通知 彈出窗口、聲音和智能手機通知
與智能交易系統或其他指標集成 有 8 個緩衝區可用於訪問和與專家顧問或其他指標集成,即使關閉警報,它們也會被填滿,它們是: 緩衝

The indicator displays the orders book, as well as increases its depth, remembering the location of orders that have gone beyond the current "window" view.
Indicator capability Display the levels of open positions. Simulation of placing/cancelling/editing pending orders directly in the displayed orders book.
Indicator features The orders book display works only on those trading symbols for which it is broadcast by the broker. To reset the information about the rows that were recorded in the Sm
FREE
FlatBreakoutPro MT5 Multi-Symbol Flat Panel and Breakout Detector for MT5 FlatBreakoutPro MT5 is a professional tool for modern traders, designed to detect and monitor flat (sideways) zones and instantly react to breakouts across multiple instruments and timeframes. The indicator uses transparent fractal logic, guarantees clear non-repainting signals, and provides full visual control of the market situation. Who Is This Product For? Active traders who prefer breakout trading strategies (range br

This indicator shows the TLH and TLL and some trendlines that allow us to estimate the trend of market. It also shows the values of the angles of the lines in percentage in points (pip) , the standard deviation, and the trend of each line, and when it breaks the lines of support and resistance (TLH and TLL). And finally, it also shows the points identified as supports and resistances through the fractal algorithm in the graph. The high and low trend lines are supported by the highs and lows, th
FREE
MetaTrader市场是 出售自动交易和技术指标的最好地方。
您只需要以一个有吸引力的设计和良好的描述为MetaTrader平台开发应用程序。我们将为您解释如何在市场发布您的产品将它提供给数以百万计的MetaTrader用户。
您错过了交易机会:
- 免费交易应用程序
- 8,000+信号可供复制
- 探索金融市场的经济新闻
注册
登录