Currency Barometer MT5 Indicator by PipTick
- Indikatoren
-
Michal Jurnik
 "Talent is cheaper than table salt. What separates the talented individual from the successful one is a lot of hard work." - Stephen King. Those few words reflect myself very well. I am probably not the most talented developer in the world but I truly believe in hard work, professional attitude and
 - Version: 2.1
- Aktualisiert: 3 Dezember 2021
- Aktivierungen: 5
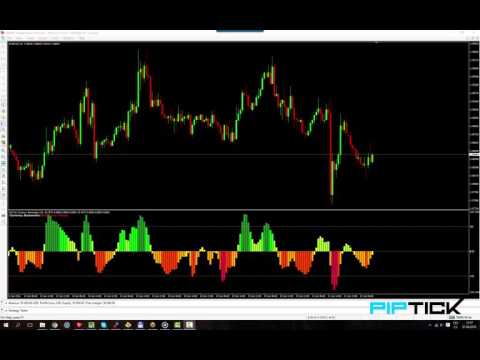
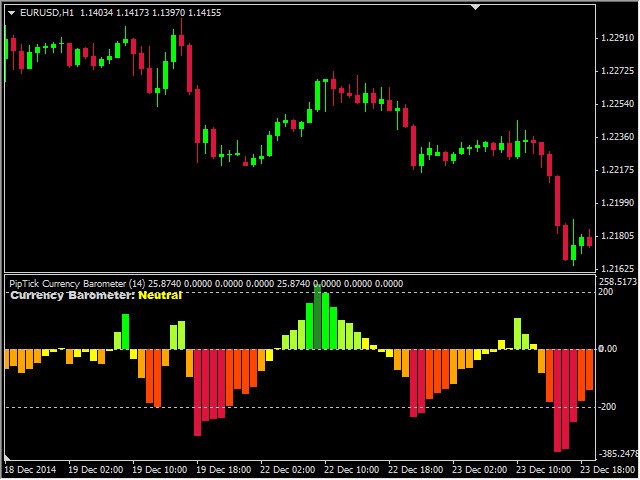
DerWährungsbarometer-Indikator ist ein einzigartiges Instrument, das die Stärke von zwei im Paar vertretenen Währungen misst und die Differenz zwischen ihnen vergleicht. Das Ergebnis wird in Form eines Histogramms angezeigt, an dem Sie einfach erkennen können, welche Währung die stärkste ist. Dieser Indikator wurde entwickelt, um die Stärken und Schwächen von acht Hauptwährungen (USD, EUR, GBP, CHF, CAD, JPY, AUD und NZD) zu messen und funktioniert bei 28 Währungspaaren. Der Indikator verwendet die CI-Methode (Commodity Channel Index), um die Stärke und Schwäche der Währungen zu berechnen.
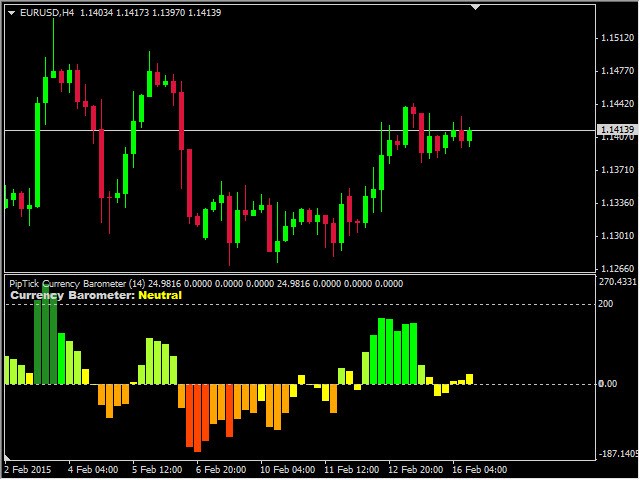
Auswertung
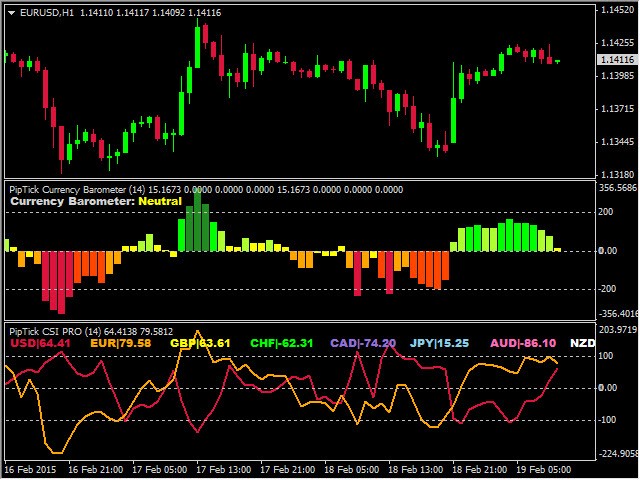
Der Indikator ist in drei Zonen unterteilt.
- Überkaufte Zone - oberhalb der Linie 200.
- Normale Zone - zwischen den Linien 200 und -200.
- Überverkaufte Zone - unter der Linie von -200.
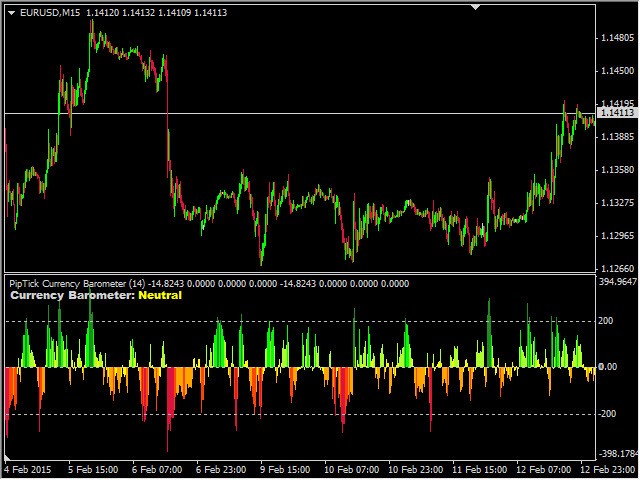
Da das Währungsbarometer die erste Währung des Paares mit der zweiten vergleicht, ist es besser, eine differenzierte Skala zu verwenden.
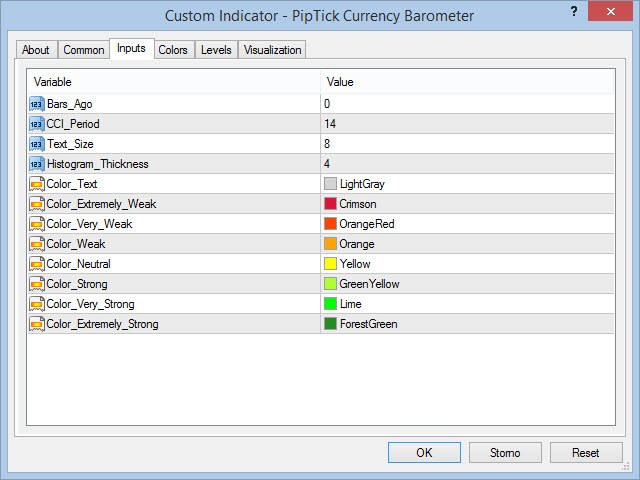
- Extrem stark - ForestGreen.
- Sehr stark - LimeGreen.
- Stark - GrünTief.
- Neutral - Gelb.
- Schwach - Orange.
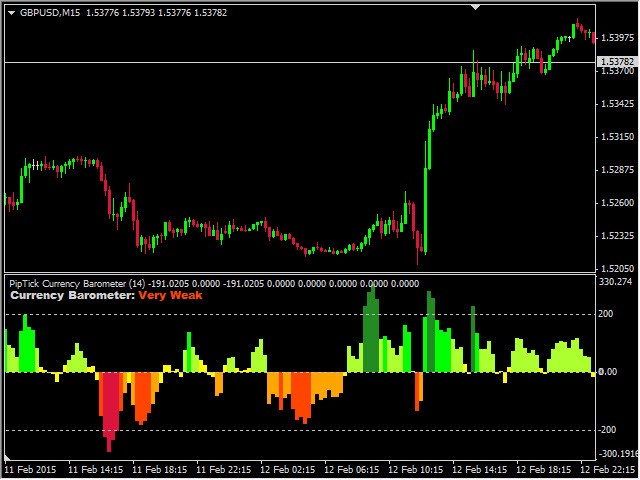
- Sehr Schwach - OrangeRot.
- Extrem schwach - Karminrot.
Wie verwendet man das Währungsbarometer?
Wir sind sicher, dass es viele Möglichkeiten gibt, unser Währungsbarometer zu nutzen. Sie können zum Beispiel Divergenzen zwischen dem Kurs und dem Indikator handeln. Natürlich können Sie auch mit der klassischen Trendstrategie handeln - eine starke Währung kaufen und eine schwache verkaufen. Diese Strategie sollten Sie jedoch nicht anwenden, wenn sich das Währungsbarometer im Extrembereich befindet. Umgekehrt ist dies oft eine Gelegenheit, in die entgegengesetzte Richtung zu handeln (Umkehrstrategie).
Wichtigste Merkmale
- Ein einfacher Vergleich der Stärke von zwei Währungen.
- Der Indikator funktioniert mit 28 Paaren.
- Automatische Erkennung des Währungspaares.
- Überkaufte und überverkaufte Bereiche für den Einstieg oder Ausstieg in den Handel.
- Funktioniert auf jedem Zeitrahmen (M1, M5, M15, M30, H1, H4, D1, W1, und MN).
- Nicht wiederholend.
- Bereit für Backtesting (anpassbare Rückblicksperiode).
- Anpassbare Parameter (Farben, Liniendicke, Zeitraum...).
- Hochgeschwindigkeitsberechnung.
- Der Indikator arbeitet auch mit Präfixen und Suffixen von Symbolen (EURUSD.m, EURUSD-pro...).
- Er kann für die Erstellung eines EA (Expert Advisor) verwendet werden.
- Verfügbar für MT4 und MT5.