Conheça o Mercado MQL5 no YouTube, assista aos vídeos tutoriais
Como comprar um robô de negociação ou indicador?
Execute seu EA na
hospedagem virtual
hospedagem virtual
Teste indicadores/robôs de negociação antes de comprá-los
Quer ganhar dinheiro no Mercado?
Como apresentar um produto para o consumidor final?
Indicadores Técnicos para MetaTrader 5 - 9

O Preço médio ponderado por volume é semelhante a uma média móvel, exceto que o volume é incluído para ponderar o preço médio durante um período.
O preço médio ponderado por volume [VWAP] é uma média ponderada dinâmica projetada para refletir com mais precisão o preço médio verdadeiro de uma segurança em um determinado período. Matematicamente, o VWAP é o somatório do dinheiro (ou seja, Volume x Preço) transacionado dividido pelo volume total em qualquer horizonte de tempo, normalmente do merca
FREE
Spike Trap is a simple but powerful tool that identifies sharp market spikes and waits for price pullbacks to highlight high-probability entry and exit zones. By combining volatility detection with smart retracement logic, it helps traders capitalize on fast price moves with precision and reduced risk. Ideal for scalping or long-term trading in volatile markets. Spike Trap can be used to trade synthetic indices such as Boom and Crash offered by Deriv Broker as well as Pain and Gain indices offer

40% off. Original price: $50 (Ends on February 15)
Advanced Bollinger Bands Scanner is a multi symbol multi timeframe Bollinger bands dashboard that monitors and analyzes the Bollinger Bands indicator from one chart. This panel scans the Bollinger bands indicator in up to 28 configurable instruments and 9 timeframes for price overbought/oversold, price consolidation (Bollinger bands squeeze), and consolidation breakout (squeeze break) with a deep scan feature to scan all market watch symbols
Multi-Currency Strength Dashboard PRO MT5 (v2.6) – Medidor de força de moedas com painel visual Multi-Currency Strength Dashboard PRO é um indicador para MetaTrader 5 que mede em tempo real a força relativa de 8 moedas principais (USD, EUR, GBP, JPY, CHF, CAD, AUD, NZD) analisando até 28 pares Forex (dependendo dos símbolos disponíveis no seu broker). O objetivo é fornecer uma visão rápida e estruturada da força/fraqueza das moedas, ajudando a selecionar pares para análise (moeda forte contra mo

Ichimoku Trend Alert is the Ichimoku Kinko Hyo indicator with Alerts and signal filters.
Ichimoku Trend Alert features: Optional check of Ichimoku cloud, Tenkan sen(Conversion Line), Kijun sen(Base Line), Senkou span A, Senkou span B, and Chikou span relative to price, and more. Popup, email, and phone notification alerts for selected symbols and timeframes.
There are 9 classic Ichimoku trend filters you can enable/disable in settings: Price/Cloud Order: Checks the price position relative to
FREE

Peak Trough Analysis is the great tool to detect peaks and troughs in your chart. Peak Trough Analysis tool can use three different peaks and troughs detection algorithm. The three algorithm include the orignal Fractals Indicator by Bill Williams, the Modified Fractals indicator and ZigZag indicator. You can use this peak and trough analysis tool to detect the price pattern made up from Equilibrium Fractal-Wave process. For further usage, there are good guide line on how to use this peak trough
FREE

This is the Cumulative Volume Delta (CVD) , it's an indicator that calculates the long and short volumes plotting it then as a line on the chart, the most efficient way to use this indicator is by comparing the CVD line to the current chart and looking at the Divergence beetween the two of them, so that you can identify fake-outs and liquidty sweeps. for example in the picture that i put below you can see that the price has made a lower low but the CVD didn't, that means the volumes didn't suppo
FREE

Indicador Avançado de Calendário Econômico Este indicador exibe diretamente no gráfico todos os eventos econômicos futuros relevantes para o par ou instrumento selecionado, permitindo antecipar momentos de alta volatilidade e planejar as estratégias de trading com maior precisão. Principais funcionalidades Exibição de eventos futuros até 5 dias à frente (personalizável). Filtro por nível de impacto da notícia (alto, médio, baixo). Opção para mostrar linhas verticais dos eventos e marcadores nume
FREE

Custom Spread Indicator *Please write a review, thanks!
Also MT4 version is available
Spread Indicator show the current spread in pips with color codes. Handle 3 levels, Low, Medium, High. You can set levels and colors for each level (eg. Low: Green, Medium: Orange, High: Red), and can choose display position on the chart.
There is two spread calculation mode: -> Server spread value -> Ask - Bid value
Can set opacity, for better customization. When spread jump bigger, then display do not
FREE
Fractals_Price Indicator Description
The Fractals_Price indicator is a technical analysis tool that identifies fractal patterns on price charts. Fractals are recurring patterns that signal potential trend reversals or continuation points. This indicator marks both upward and downward fractals with colored arrows and can display price labels at these points.
Key Features Identifies upward fractals (magenta arrows) marking potential resistance levels Identifies downward fractals (blue arrows)
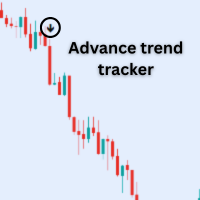
Features: 1. Buy arrows= when Up trend start. 2.Sell arrows = when Down trend start 3.Alert System= when Signal appear then Mt5 itself Pop up a alert Box. 4. You can get notifications on your phone real time through Mt5 app.
Note: this indicator will work on trending market. So try to trade volatile market.
Best Pair: Only trade in New York session NASDAQ (US100) S&P ( US500) Dow Jones (US30)
Note : Don't Trade Forex pair.
FREE

Apresentando Quantum Breakout PRO , o inovador Indicador MQL5 que está transformando a maneira como você negocia Breakout Zones! Desenvolvido por uma equipe de traders experientes com experiência comercial de mais de 13 anos, Quantum Breakout PRO foi projetado para impulsionar sua jornada comercial a novos patamares com sua estratégia de zona de fuga inovadora e dinâmica.
O Quantum Breakout Indicator lhe dará setas de sinal em zonas de breakout com 5 zonas-alvo de lucro e su

Introducing Order Blocks Breaker , a brand-new way to identify and leverage order blocks in your trading strategy. After developing multiple order block tools with unique concepts, I’m proud to present this tool that takes things to the next level. Unlike previous tools, Order Blocks Breaker not only identifies order blocks but also highlights Breaker Order Blocks —key areas where the price is likely to retest after a breakout. MT4 - https://www.mql5.com/en/market/product/124101/ This t

Introducing Indicator for PainX and GainX Indices Traders on Weltrade Get ready to experience the power of trading with our indicator, specifically designed for Weltrade broker's PainX and GainX Indices. Advanced Strategies for Unbeatable Insights Our indicator employs sophisticated strategies to analyze market trends, pinpointing optimal entry and exit points. Optimized for Maximum Performance To ensure optimal results, our indicator is carefully calibrated for 5-minute timeframe charts on

Royal Scalping Indicator is an advanced price adaptive indicator designed to generate high-quality trading signals. Built-in multi-timeframe and multi-currency capabilities make it even more powerful to have configurations based on different symbols and timeframes. This indicator is perfect for scalp trades as well as swing trades. Royal Scalping is not just an indicator, but a trading strategy itself. Features Price Adaptive Trend Detector Algorithm Multi-Timeframe and Multi-Currency Trend Low

MTF SuperTrend Confluence: Precision Trend Analysis Across Multiple Timeframes Tired of conflicting signals and market noise on a single timeframe? Gain a decisive trading edge by seeing the bigger picture. The MTF SuperTrend Confluence indicator is your all-in-one solution for high-probability trend analysis, meticulously engineered to filter out uncertainty and pinpoint powerful market movements. This powerful tool plots up to three fully customizable SuperTrend indicators from different timef
ICONIC Reversal Engine Quality over quantity. Trade only the reversals that matter. The Problem: Noise, Overload, False Signals Most indicators flood charts with arrows but ignore context.
A hammer in a strong downtrend is irrelevant. An engulfing without volume is a trap.
Result: analysis paralysis, missed moves, costly errors. The Solution: Your Analytical Co-Pilot The ICONIC Reversal Engine is not “just another arrow.” It explains why a setup matters.
Every signal is stress-tested through a
FREE

100 % PER MONTH PROFIT---- MY NEW SIGNAL HERE -------> https://www.mql5.com/en/signals/2162238?source=Site+Signals+My#
The Commodity Channel Index (CCI) measures the current price level relative to an average price level over a given period of time. CCI is relatively high when prices are far above their average. CCI is relatively low when prices are far below their average. Using this method, CCI can be used to identify overbought and oversold levels.
You can set the period of CCI.
The indi

This is Heiken Ashi smoothed version, where you can choose on what type smoothness you want to make your strategy base. You can choose between EMA or MA, on the period you want. And you can choose colors.
Definition:
The Heikin-Ashi technique averages price data to create a Japanese candlestick chart that filters out market noise. Heikin-Ashi charts, developed by Munehisa Homma in the 1700s, share some characteristics with standard candlestick charts but differ based on the values used to cre
FREE

Gym Bro Strategy is a technical indicator based on the classic Weekly Pivot Point system. It is designed to assist traders in identifying trend direction, potential entry zones, and risk management levels using a fitness-themed visualization interface. The name "Gym Bro" refers to the indicator's unique visual metaphor, which categorizes market trends into "Bulking" (Upward Momentum) or "Cutting" (Downward Momentum) phases. This thematic approach simplifies complex price action into clearly def
FREE

This indicator displays Pivot-Lines, preday high and low, preday close and the minimum and maximum of the previous hour. You just have to put this single indicator to the chart to have all these important lines, no need to setup many single indicators.
Why certain lines are important Preday high and low : These are watched by traders who trade in a daily chart. Very often, if price climbs over or falls under a preday low/high there is an acceleration in buying/selling. It is a breakout out of a
FREE

Fractal Model Indicator for Metatrader , meticulously crafted around the renowned Fractal Model by TTrades. This powerful tool empowers traders to navigate price action with precision, leveraging multi-timeframe analysis to anticipate momentum shifts, swing formations, and trend continuations. Designed for MetaTrader , the Fractal Model Indicator combines advanced algorithmic insights with customizable features, making it an essential addition for traders seeking to capitalize on expansive mar

This is a derivative of John Carter's "TTM Squeeze" volatility indicator, as discussed in his book "Mastering the Trade" (chapter 11).
Gray dot on the midline show that the market just entered a squeeze (Bollinger Bands are with in Keltner Channel). This signifies low volatility, market preparing itself for an explosive move (up or down). Blue dot signify "Squeeze release".
Mr.Carter suggests waiting till the first blue after a gray dot, and taking a position in the direction of the moment
FREE

Line Profit Indicador da linha visual de lucro na moeda de depósito. Funciona apenas se houver posições abertas no mercado para o símbolo no qual o indicador está instalado. Você pode mover a linha com o mouse ou ativar o rastreamento automático do preço da Proposta. Descrição das configurações do indicador: colotLine - cor da linha WidthLine - largura da linha colotText - cor do texto FontSize - a altura do texto Anchor - um método de âncora para texto FollowBid - segue o preço do Bid
FREE

Understanding the levels of the previous day or week is very important information for your trading.
This indicateur allow to draw Previous day High/Low Previous week High/Low
Congifuration High & Low for: Previous day, week Line Style, color Label position, size, color Any questions or comments, send me a direct message here https://www.mql5.com/en/users/mvonline
FREE

Bar Countdown é um simples indicador para MetaTrader 5 que mostra o tempo restante de cada vela. Ele pode ser colocado em qualquer canto do gráfico ou perto do fechamento de preço. Escolha o formato do contador entre HR:MIN:SEC ou MIN:SEC
É muito fácil de usar, configure a cor, o tamanho e a posição no gráfico do contador e pronto!!! A contagem regressiva começa agora!
Atualizações:
28/02/2021; v1.0: Versão inicial 16/03/2021; v1.1: Pequenas alterações no código
Ag
FREE

# Wave Trend Oscillator (WTO) User Guide
## Overview Wave Trend Oscillator is a powerful technical analysis tool used to analyze price momentum and trend direction. It visualizes market conditions using two main lines (WT1 and WT2) and a histogram.
## Components 1. **WT1 (Green Line)**: Main trend indicator 2. **WT2 (Red Line)**: Signal line 3. **Histogram (Blue)**: Shows the difference between WT1 and WT2 4. **Arrows**: Mark crossover points - Green Arrow: WT1 crosses above WT2 (Buy signa

RSI Entry Points is the upgrade of the standard RSI indicator to avoid lagging. Indicator draws the clouds and the arrows to have clear picture where price is and what to wait for. Why standard RSI is lagging? because mostly we do not use it correctly and it is with very weak visual flexibility, less informativity. With my current upgrade I tried to Fix both problems same time and I got much better results and more exact entries than standard RSI has. To make yourself sure check out the screens

Este indicador foi projetado para tornar as revisões de muitos gráficos em diferentes escalas de tempo mais rápidas e fáceis de fazer. Acompanhe o tempo e o preço em vários gráficos Alterar símbolo em um gráfico e todos os outros gráficos do mesmo símbolo também serão alterados. Fácil de usar, rápido para dominar O indicador permite identificar o preço e a hora em que o ponteiro do mouse está no gráfico atual, em todos os outros gráficos abertos no mesmo Símbolo. Isso permite que você veja rapid
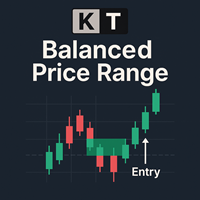
O KT Balanced Price Range destaca a área de sobreposição entre dois Fair Value Gaps (FVGs) consecutivos e opostos. Esse conceito, conhecido como Faixa de Preço Balanceada (BPR), é amplamente utilizado por traders de price action, especialmente os que seguem os métodos de Smart Money Concepts (SMC) e Inner Circle Trader (ICT). Traders frequentemente usam essas zonas BPR para encontrar oportunidades de trade com alta probabilidade, especialmente durante pullbacks ou em momentos de continuação de t

Introduction to Double Harmonic Volatility Indicator Use of the Fibonacci analysis for financial trading can nearly go back to 85 years from today since the birth of Elliott Wave Theory by R. N. Elliott. Until now, traders use the Fibonacci analysis to identify the patterns in the price series. Yet, we could not find any one attempted to use Fibonacci analysis for the Volatility. Harmonic Volatility Indicator was the first technical analysis applying the Fibonacci analysis to the financial Volat

This indicator significantly expands the capabilities of the usual ZigZag due to the addition of parabolic channels at the earliest stage of their origin. Download the demo version and test it in the tester. All graphics in the tester are working. But the ZigZag algorithm is special here, because it is implemented on a unique author's ultrafast loop-less algorithm for calculating parabolic regression and calculating its standard deviation. The features of this ZigZag are: Fast calculation, rega

LinReg (5-Line Regression Channel) — Free Indicator LinReg draws a five-line linear regression channel to visualize trend structure and price deviation. What makes this version different This release is a Market-validation-safe build : Optimized to avoid heavy processing during Strategy Tester multi-symbol validation. Focused on stable performance and clean plotting without slowdowns. Visual structure (5 lines) 2 Blue lines (outer bounds) 1 Red line (regression midline) 2 Purple lines (inner bou
FREE

Este indicador foi desenvolvido para exibir fractais no gráfico de preços, ajudando os traders a identificar extremos locais importantes. Os fractais representam pontos específicos no gráfico que seguem a definição clássica: um máximo local é formado quando a vela central é mais alta que as duas adjacentes em ambos os lados, e um mínimo local ocorre quando a vela central é mais baixa que as duas adjacentes. Outros produtos -> AQUI Principais características e benefícios : Exibição flexível — o
FREE

Versão aprimorada do MACD Histogram (para monitorar mudanças no momentum do mercado) O indicador MACD padrão do MT5 utiliza o valor da própria linha MACD para construir o histograma. Em condições de movimentos rápidos ou mercados laterais, esses histogramas mudam lentamente e frequentemente não refletem claramente a aceleração ou desaceleração da força de alta ou baixa. Isso é especialmente perceptível quando o preço ainda não mostra uma reversão clara, resultando em sinais atrasados. Nesta vers
FREE

Indicador Crypto_Forex "CCI com zonas de Sobrevenda/Sobrecompra Dinâmicas" para MT5, sem repintura.
- O Índice de Canal de Commodities (CCI) é excelente para negociação de momentum na direção da tendência. - É ótimo para entradas de Venda em zonas de Sobrecompra dinâmicas e entradas de Compra em zonas de Sobrevenda dinâmicas na direção da tendência principal. - Este indicador também é excelente para combinar com entradas de Ação de Preço. - Zona de Sobrecompra Dinâmica - acima da linha amarela
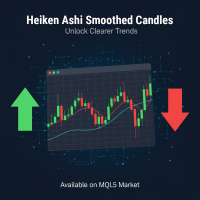
Indicador Heiken Ashi Smoothed para MT5 Heiken Ashi avançado com filtro de suavização. Reduz ruído, elimina falsos sinais e identifica tendências cedo. Ideal para Forex, índices e cripto em H1-D1. Como funciona e como é suavizado? O Heiken Ashi tradicional calcula as velas fazendo a média dos valores de abertura, fechamento, máxima e mínima de períodos anteriores, o que já reduz o impacto de flutuações menores. No entanto, o Heiken Ashi Smoothed eleva esse enfoque ao aplicar um filtro de suaviza
FREE

Este indicador é uma ferramenta interativa de marcação das Ondas de Elliott para MetaTrader 4 e 5.
Ele permite que o usuário coloque manualmente rótulos de ondas diretamente no gráfico, selecionando o tamanho do rótulo, a cor e o tipo de onda (correções ABC, impulsos de cinco ondas ou estruturas WXY) a partir de um menu no próprio gráfico.
Com um único clique no gráfico, o indicador posiciona sequencialmente os rótulos de ondas apropriados no preço e no tempo escolhidos, ajudando os traders a vi
FREE

Ulimate MTF Support & Resistance - 5 Star Best Seller New Year Sale - save $20 (normal price $79) Beginner or Professional our best selling multi-timeframe Pivot Prof will enhance your trading and bring you great trade opportunities with the Support and Resistance levels that professionals use. Pivot trading is a simple effective method for entering and exiting the market at key levels and has been used by professionals for decades and works on all symbols: Forex, Crypto, Stocks, Indicies et

This is a simple order block locator. Searched for the existence of order blocks only at extremums. If you want multi criteria order block location check my other indicator which is more powerful here These order blocks are ICT order blocks without any buttering.
The indicator can be a useful tool for detecting reversals, continuations. You can also use the indicator as confluence with your other tools
FREE

Spike Phantom is a specialized indicator for PainX and GainX synthetic indices that generates trading signals with automatic alert notifications.
Features The indicator analyzes market conditions using proprietary algorithms and displays buy/sell arrows directly on the chart. It works specifically with PainX and GainX indices on M5 timeframe. Signal generation combines multiple technical analysis methods to identify potential trading opportunities. The system provides two TP levels and SL cal

O Matrix Arrow Indicator Multi Timeframe Panel MT5 é um complemento gratuito e um grande trunfo para o seu Matrix Arrow Indicator MT5 . Ele mostra o sinal atual do Matrix Arrow Indicator MT5 para 5 intervalos de tempo personalizados pelo usuário e para 16 símbolos / instrumentos modificáveis no total. O usuário tem a opção de habilitar / desabilitar qualquer um dos 10 indicadores padrão, que compõem o Indicador de Seta de Matriz MT5 . Todos os atributos dos 10 indicadores padrão também são aj
FREE
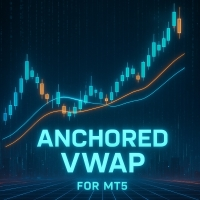
Anchored VWAP (AVWAP) para MT5 Leve sua análise de gráficos para o próximo nível com o Anchored VWAP para MT5 , uma ferramenta poderosa e flexível projetada para traders que buscam níveis de preço chave precisos, rápidos e claros . Este indicador oferece análise de VWAP em estilo institucional, similar à funcionalidade do TradingView, mas totalmente otimizado para MT5. Principais Recursos Múltiplos pontos de ancoragem por gráfico: Adicione quantas linhas AVWAP desejar, cada uma com data e hora d
FREE

Donchian Channel (ou canal de Donchian) é um indicador criado por Richard Donchian. Ele é formado tomando a máxima mais alta e a mais baixa mais baixa do último período especificado em velas. A área entre alta e baixa é o canal para o período escolhido.
Sua configuração é simples. É possível ter a média entre a linha superior e inferior além de alertas quando o preço atinge um dos lados. Se tiver alguma dúvida ou encontrar alguma falha, me contate. Faça bom uso!
FREE

Cybertrade Auto Fibonacci retração e projeção - MT5
O Fibonacci automático é um indicador que traça automaticamente a retração e projeção de Fibonacci com base no número de barras que você seleciona na configuração do indicador. Estão disponíveis 9 níveis diferentes para retração e 3 níveis para projeção que podem ser customizados conforme desejado. Funciona em períodos maiores do que o período visível no gráfico. Todos os valores estão disponíveis em forma de buffers para simplificar possí
FREE

O indicador foi desenvolvido para mostrar as linhas de tendência de preços, e a linha do canal de alta e o de baixa. Com essas linhas é possível identificar a tendência dos preços mais facilmente. Ele utiliza as diferentes trendlines e pontos de resistência e suporte para gerar automaticamente as melhores linhas de tendência TLH e TLL, e mostra os ângulos em pips ( percentage in points ) de cada linha. Além disso mostra os pontos identificados como suportes e resistências através do algoritmo
FREE
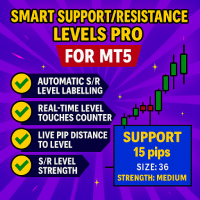
Indicador Avançado de Informações de Níveis de Suporte/Resistência para MetaTrader 5 Conheça o Indicador Avançado de Informações de Níveis de Suporte/Resistência, o seu companheiro definitivo para visualização de informações importantes de S/R em tempo real. Esta ferramenta do MT5 rotula automaticamente suas linhas horizontais com métricas críticas de S/R—classificação de suporte/resistência, número de toques, distância em pips em tempo real, força do nível e idade histórica—tudo isso à primeira

Desbloqueie insights poderosos do mercado com este indicador que exibe um livro visual (order book) no gráfico, inspirado no Visual Book do Profit da Nelogica. Ele apresenta barras horizontais representando volumes de compra (azul) e venda (vermelho), com destaque em amarelo para volumes grandes, facilitando a identificação de zonas de alta liquidez. O preço tende a ir para onde há as maiores concentrações de ordens, tornando-o uma ferramenta essencial para identificar níveis de suporte e resist
FREE

Ritz Smart OHLC Candle + Dual-Timeframe RSI Sentiment Analysis Ritz Smart OHLC Candle is an advanced price-action candle indicator that enhances standard OHLC candles with smart momentum analysis, volatility validation, and directional bias filtering — all displayed directly through candle colors. This indicator is designed for traders who want clean charts, early momentum detection, and reduced false signals, without adding extra lines or panels. Main Features Smart OHLC Strength Analysis, Ev

Haven Bands Reversion – Um indicador profissional para negociação de reversão à média Apresentamos o Haven Bands Reversion – uma ferramenta poderosa e precisa, criada para traders que utilizam estratégias de reversão à média. Diferente das Bandas de Bollinger clássicas, este indicador baseia-se na Média Móvel Ponderada pelo Volume (VWMA) , o que torna seus canais mais sensíveis à atividade real do mercado. O mais importante é que o indicador gera sinais que não repintam , fornecendo pontos de en
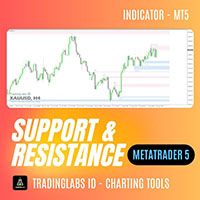
Classic Support & Resistance Tired of drawing support and resistance levels manually?
Now you can save time and trade with confidence using the Classic Support & Resistance Indicator. This tool automatically plots key support and resistance zones on your MT4 chart with high accuracy and clean visualization. Designed especially for traders who rely on Breakout – Retest Entry strategies and market structure analysis. Key Features: Auto Support & Resistance Zones
Automatically identifies and plots

This indicator draws price channels. Easy to use. It has various settings, for example, you can configure it to show channels only for buy or sell, you can display trend lines instead of channels. There are many trading strategies that are based on trading in channels, you can trade on the rebound from the borders of the channels, or the breakdown of the channel. Parameters History - the maximum number of bars for building channels; Distance - the minimum distance from one maximum (or minimum

The SMC ICT Indicator integrates the key concepts of Smart Money Concepts and Inner Circle Trader into a practical and precise tool.
It displays essential levels and patterns on the chart for clear analysis according to the ICT approach.
Optimized for agile processing, it allows smooth backtesting with no repainting, freezes, or delays—ensuring precision and efficiency in your trading.
Included Concepts It includes Fair Value Gap (FVG), Order Blocks, Imbalance, Gap, Equal High and Equal Low, a
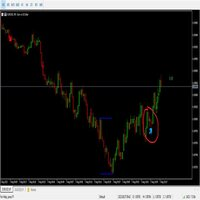
King Binary Profit System
1 minute candle
3-4 minute expire
Alright. This indicator works on MT5 and is very easy to use. When you receive a signal from it, you wait for that candle with the signal to close and you enter your trade at the beginning of the next new candle. A red arrow means sell and a green arrow means buy. All arrows comes with a long dotted like for easy identification of trade signal. Are you okay with that?

Este indicador encontra e exibe os padrões de análise técnica de fundo duplo e topo duplo. Sinais (exibe uma mensagem na tela) se a forma foi formada recentemente. Freqüentemente, após o aparecimento desses padrões, a tendência se inverte ou ocorre uma correção. Para não procurá-los você mesmo, ou para não perder o seu aparecimento, basta adicionar um indicador ao gráfico. O indicador pode ser usado em diferentes prazos e pares de moedas, há configurações para uma melhor busca em um determinado
FREE

Apresentamos o Koala FVG para o MT5: seu indicador profissional de padrões Fair Value Gap (FVG). Koala FVG: Seu Caminho para uma Operação Precisa no MT5 Desbloqueie o potencial do padrão Fair Value Gap (FVG) com o Koala FVG, um indicador de ponta projetado para o MetaTrader 5. Por tempo limitado, acesse gratuitamente esta ferramenta profissional antes que ela se torne um indicador premium. Principais Características: Detecção de Padrões FVG: O Koala FVG identifica inteligentemente Padrões FVG Qu
FREE

Session Breakout Master is a high-performance trading tool designed to capture explosive moves following the breakout of major trading session ranges (Asia, Europe, and USA). It automatically visualizes volatility zones and utilizes a Moving Average filter to ensure you stay on the right side of the market trend. Key Features: Automated Session Mapping: No more manual drawing. The indicator identifies and plots Asia, Europe, and USA session boxes automatically. Trend Filtering: Built-in MA filte
FREE

Description. The basis for the formation of the Renko chart is the price range. If the price goes beyond its limits, the chart shows a box above or below the previous one. As a result, we see price movement without additional "noise" and important support and resistance levels. Features.
For use in conjunction with the Expert Advisor, an additional buffer is implemented-a box counter. For convenience and to increase the speed of testing, the user can use the "new box" event, which the indicator
FREE
O que é o SMA Reentry SMA Reentry é um indicador profissional que sinaliza pontos de reentrada a favor da tendência utilizando duas médias móveis simples (SMA): uma rápida e uma lenta. O indicador mostra claramente quando o preço retorna acima ou abaixo da média móvel rápida, em presença de uma tendência definida pela SMA lenta. É a ferramenta ideal para quem procura sinais claros de pullback, breakout e reentrada em tendências já estabelecidas. Como funciona Identifica a tendência principal atr
FREE

Veja "O que há de novo" para uma análise das funções mais recentes. A versão 1.4 foi apenas uma organização, nada de especial.
//+---------------------------------------------------------------------------------------------------------------+ Criei isso porque precisava de um indicador fractal personalizável. Ele também verifica volumes decrescentes para fornecer algum tipo de confirmação. Detalhes abaixo: Visão Geral Este indicador foi projetado para ajudar a identificar pontos-chave de reversã
FREE

O indicador identifica quando ocorre uma divergência entre o preço e um oscilador / indicador. Ele identifica divergências regulares e ocultas. Ele tem uma opção de filtro RSI que torna possível filtrar apenas as configurações mais fortes. O indicador também oferece opções para esperar pelo rompimento do canal Donchian ou para o preço cruzar uma média móvel (veja a captura de tela # 3) para confirmar a divergência antes de sinalizar a oportunidade de negociação. Combinado com suas própri

The Simple ICT Concepts Indicator is a powerful tool designed to help traders apply the principles of the Inner Circle Trader (ICT) methodology. This indicator focuses on identifying key zones such as liquidity levels, support and resistance, and market structure, making it an invaluable asset for price action and smart money concept traders.
Key Features Market Structure: Market structure labels are constructed from price breaking a prior swing point. This allows a user to determine the curren

This wonderful tool works on any pair producing alerts whenever the market enters the overbought and oversold zones of the market. The signals come as BUY or SELL but it does not necessarily mean you should go on and execute order, but that you should begin to study the chart for potential reversal. For advanced signal tools check out some of our premium tools like Dual Impulse.
FREE

Negociação dinâmica:
1.pp pivot
2. r1 r2 r3, s1 s2 s3 Necessary for traders: tools and indicators Waves automatically calculate indicators, channel trend trading Perfect trend-wave automatic calculation channel calculation , MT4 Perfect trend-wave automatic calculation channel calculation , MT5 Local Trading copying Easy And Fast Copy , MT4 Easy And Fast Copy , MT5 Local Trading copying For DEMO Easy And Fast Copy , MT4 DEMO Easy And Fast Copy , MT5 DEMO
Cooperação QQ: 556024 "
Cooperação
FREE

The indicator that shows the countdown to the change of candles is equipped with an alert when the bar changes (the alert is not active if installed on the M1 time frame). Displays seconds if installed in time frame M1, displays minutes and seconds if installed in time frame above M1, and displays hours and minutes if installed in time frame h1 and above. The time displayed is calculated based on the running time.
FREE

O Indicador de Faixa de Nova York é uma ferramenta de análise baseada em sessão, desenvolvida para traders que aplicam os conceitos de ICT (Inner Circle Trader) , negociação Smart Money e métodos institucionais de ação de preço . Projetado especificamente para a sessão de Nova York, este indicador captura a faixa de preço entre 12h e 14h GMT , um período crítico que se sobrepõe ao Fechamento de Londres e à Abertura de Nova York . Ele identifica as máximas e mínima

Smart Trendlines – No.1 Trendlines Indicator Smart Trendlines is a precision tool that automatically draws trendlines based on every valid pivot point, helping traders identify key support and resistance zones. It continuously adjusts as new market pivots form, providing a live and accurate reflection of price structure. Whether you’re tracking trends, preparing for reversals, or anticipating breakouts — this indicator keeps you one step ahead. It works seamlessly across all assets including For

SNR + FVG + HTF Sweeps Levels Indicator Documentation — Version 71.10 Smart Money Concepts (SMC) / Inner Circle Trader (ICT) Methodology By Ultimate Trader Overview This indicator combines three institutional trading concepts into a single chart overlay for MetaTrader 5. It identifies where institutions sweep liquidity at key structural levels, detects the displacement (Fair Value Gap) that follows, and maps the support and resistance zones where these events occur. The result is a high-probabil
FREE

Are you tired of drawing Support & Resistance levels for your Quotes? Are you learning how to spot Support & Resistances? No matter what is your case, Auto Support & Resistances will draw those levels for you! AND, it can draw them from other timeframes, right into you current chart, no matter what timeframe you are using... You can also Agglutinate regions/zones that are too much closer to each other and turning them into one single Support & Resistance Level. All configurable.
SETTINGS
Timefr
FREE
AlgoRhythm ZLSMA - The Ultimate Trend Trading Solution Unlock the power of precision trading with AlgoRhythm ZLSMA , an advanced technical indicator designed to deliver razor-sharp trend signals. Engineered for MetaTrader 5, this cutting-edge Zero Lag Smoothed Moving Average (ZLSMA) combines sophisticated smoothing techniques, multi-timeframe analysis, and dynamic bands to give traders a competitive edge in any market. Whether you're a scalper, swing trader, or long-term investor, AlgoRhythm ZLS
FREE
O Mercado MetaTrader é o melhor lugar para vender robôs de negociação e indicadores técnicos.
Você apenas precisa desenvolver um aplicativo para a plataforma MetaTrader com um design atraente e uma boa descrição. Nós vamos explicar como publicar o seu produto no Mercado e oferecer a milhões de usuários MetaTrader.
Você está perdendo oportunidades de negociação:
- Aplicativos de negociação gratuitos
- 8 000+ sinais para cópia
- Notícias econômicas para análise dos mercados financeiros
Registro
Login
Se você não tem uma conta, por favor registre-se
Para login e uso do site MQL5.com, você deve ativar o uso de cookies.
Ative esta opção no seu navegador, caso contrário você não poderá fazer login.