Regardez les tutoriels vidéo de Market sur YouTube
Comment acheter un robot de trading ou un indicateur
Exécutez votre EA sur
hébergement virtuel
hébergement virtuel
Test un indicateur/robot de trading avant d'acheter
Vous voulez gagner de l'argent sur Market ?
Comment présenter un produit pour qu'il se vende bien
Indicateurs techniques pour MetaTrader 5 - 9

Trend Battle Indicator
Overview The Trend Battle Indicator is a professional technical analysis tool that reveals the battle between buyers (Bulls) and sellers (Bears) in the market through a comprehensive dashboard. Using an intuitive visual interface, the indicator offers a unique perspective on market power dynamics by analyzing the last twenty bars to provide precise insights into momentum and directional strength. Additionally, the panel provides automatic real-time updates for bars in for

Peak Trough Analysis is the great tool to detect peaks and troughs in your chart. Peak Trough Analysis tool can use three different peaks and troughs detection algorithm. The three algorithm include the orignal Fractals Indicator by Bill Williams, the Modified Fractals indicator and ZigZag indicator. You can use this peak and trough analysis tool to detect the price pattern made up from Equilibrium Fractal-Wave process. For further usage, there are good guide line on how to use this peak trough
FREE
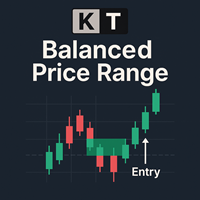
KT Balanced Price Range met en évidence la zone de chevauchement entre deux Fair Value Gaps (FVG) opposés consécutifs. Ce concept, appelé Balanced Price Range (BPR), est populaire parmi les traders de price action, en particulier ceux qui suivent les méthodes Smart Money Concepts (SMC) et Inner Circle Trader (ICT). Les traders utilisent souvent ces zones BPR pour repérer des configurations à forte probabilité, notamment lors de pullbacks ou pour des opportunités de poursuite de tendance. Ces zon

Advanced Stochastic Scalper MT5 is a professional indicator based on the popular Stochastic Oscillator. Advanced Stochastic Scalper is an oscillator with dynamic overbought and oversold levels, while in the standard Stochastic Oscillator, these levels are static and do not change. This allows Advanced Stochastic Scalper to adapt to the ever-changing market. When a buy or a sell signal appears, an arrow is drawn on the chart and an alert is triggered allowing you to open a position in a timely ma

Candle Counter is an indicator that prints the number of candles from the first candle of the day . The first candle of the day will be the number 1 and each new candle will be increased by 1 in this count.
Input Parameters Choose from even, odd or all Distance from candle to Print the number Text Font Size Text Font Color
If you still have questions, please contact me by direct message: https://www.mql5.com/en/users/robsjunqueira/
FREE

Bar Countdown is a simple indicator for MetaTrader 5 that shows the time remaining of the each candle. It can be placed in any corner of the chart or near of the price close and it'll help you to know
if the current candle is ending. Choose the counter format between HR:MIN:SEC and MIN:SEC It is so easy to use, configure the color, size and counter position on the chart and that's it!!! The Countdown starts now!
Updates: 2021/02/28; v1.0: Initial release 2021/03/16; v1.1: Minor code changes
FREE

Orderflow Smart Flip ( DEMO version,modleling must choose " Every tick based on real ticks") — Insight into Institutional Footprints, Capturing Reversals, Making Every Line Data-Driven. Important notice: Before placing an order, please contact me first, and I will provide you with professional answers and services
Product Introduction Say Goodbye to Guesswork. Embrace the Data Truth. [The last two screenshots show scenarios where the OrderFlow Bubbles Pro indicator is used in combination.] Ord

This is a derivative of John Carter's "TTM Squeeze" volatility indicator, as discussed in his book "Mastering the Trade" (chapter 11).
Gray dot on the midline show that the market just entered a squeeze (Bollinger Bands are with in Keltner Channel). This signifies low volatility, market preparing itself for an explosive move (up or down). Blue dot signify "Squeeze release".
Mr.Carter suggests waiting till the first blue after a gray dot, and taking a position in the direction of the moment
FREE

This wonderful tool works on any pair producing alerts whenever the market enters the overbought and oversold zones of the market. The signals come as BUY or SELL but it does not necessarily mean you should go on and execute order, but that you should begin to study the chart for potential reversal. For advanced signal tools check out some of our premium tools like Dual Impulse.
FREE

Fair Value Gap Finder detects fair value gaps and generates a signal when price returns to one. Set the minimum and maximum fvg size, customize the colors, style, and length, then let the indicator highlight them for you.
Key Features: Automatic FVG highlights - The indicator detects all fair value gaps that fit your criteria and marks them on the chart.
Entry Signal - A signal is created whenever price retests a fair value gap.
Notification - Alerts notify you when a fair value gap or a new
FREE

This is Heiken Ashi smoothed version, where you can choose on what type smoothness you want to make your strategy base. You can choose between EMA or MA, on the period you want. And you can choose colors.
Definition:
The Heikin-Ashi technique averages price data to create a Japanese candlestick chart that filters out market noise. Heikin-Ashi charts, developed by Munehisa Homma in the 1700s, share some characteristics with standard candlestick charts but differ based on the values used to cre
FREE

Filigrane centralisé
Ajoute un filigrane centré avec le nom de l'actif et la période choisie.
Il est possible de remplacer le type de police, la taille de police, la couleur de police et le caractère de séparation.
Le filigrane est positionné derrière les bougies, ne perturbant pas la visualisation.
Il a un recentrage automatique si la fenêtre est redimensionnée.
J'espère que cet indicateur vous aidera, bon trading ;)
FREE
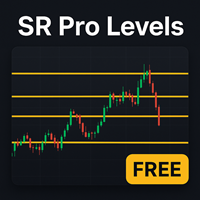
Obtenez une structure de marché claire en quelques secondes – sans dessin manuel !
L’ Indicateur HTF Auto Support & Resistance marque automatiquement sur votre graphique les niveaux clés de support et de résistance. Ces niveaux sont basés sur une unité de temps supérieure (HTF), ce qui les rend bien plus fiables que les lignes aléatoires à court terme. Fonctionnalités principales : Détection automatique des zones de support et résistance les plus fortes Analyse multi-unité de temps : choisissez
FREE

Line Profit Indicator of the visual line of profit in the deposit currency. Works only if there are open positions in the market for the symbol on which the indicator is installed. You can move the line with the mouse or enable automatic tracking of the Bid price. Description of indicator settings: colotLine - line color WidthLine - line width colotText - text color FontSize - the height of the text Anchor - an anchor method for text FollowBid - follow the Bid price
FREE
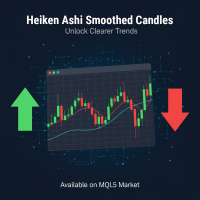
Indicateur Heiken Ashi Smoothed pour MT5 Heiken Ashi avancé avec filtre de lissage. Réduit le bruit, élimine les faux signaux et détecte les tendances tôt. Idéal pour Forex, indices et crypto (H1-D1). Fonctionnement et lissage Le Heiken Ashi traditionnel calcule les bougies en moyennant les valeurs d'ouverture, de clôture, de haut et de bas des périodes précédentes, réduisant déjà l'impact des fluctuations mineures. Cependant, le Heiken Ashi Smoothed élève cette approche en appliquant un filtre
FREE

Libérez des perspectives de marché puissantes avec cet indicateur qui affiche un carnet d'ordres visuel sur le graphique, inspiré du Visual Book de Profit de Nelogica. Il présente des barres horizontales représentant les volumes d'achat (bleu) et de vente (rouge), avec un surlignage en jaune pour les gros volumes, facilitant l'identification des zones de forte liquidité. Le prix a tendance à se déplacer vers les zones avec les plus fortes concentrations d'ordres, ce qui en fait un outil clé pour
FREE
Ekom Spike Detector
Navigate the volatile world of Boom and Crash indices with the Ekom Spike Detector Indicator. This powerful tool detects explosive price movements, providing traders with precise buy and sell signals 24/7.
Key Features:
Spike Detection : Identify high-probability spike patterns in real-time Clear Visual Signals : Displays clear buy and sell arrows on the chart for easy decision-making Customizable : Easily switch from either Boom based on individuals choice Reliable : Te
FREE

The indicator plots a trend channel using the technique by Gilbert Raff. The channel axis is a first-order regression. The upper and lower lines show the maximum distance the Close line had moved away from the axis line. Therefore, the upper and lower lines can be considered as resistance and support lines, respectively. A similar version of the indicator for the MT4 terminal
As a rule, most movements of the price occur within a channel, going beyond the support or resistance line only for a sh
FREE

Cybertrade Auto Fibonacci retraction and projection - MT5
Auto Fibonacci is an indicator that automatically plots the Fibonacci retracement and projection based on the number of bars you select in the indicator setting. You can customize nine different levels of retraction and three levels of projection. It works on periods longer than the period visible on the chart. All values are available in the form of buffers to simplify possible automations. This indicator is the same one we use in ou
FREE

This indicator displays the wave structure of the market in the form several wave levels nested in each other. For each of these levels an automatic preliminary (draft) marking of waves in Elliott's style (123..., ABC... etc.) is created. This markup is completely automatic and absolutely univocal. The indicator is especially useful for beginner wave analysts, because among all the possible versions for wave marking, it allows you to immediately take the most adequate version as a ba

Custom Spread Indicator *Please write a review, thanks!
Also MT4 version is available
Spread Indicator show the current spread in pips with color codes. Handle 3 levels, Low, Medium, High. You can set levels and colors for each level (eg. Low: Green, Medium: Orange, High: Red), and can choose display position on the chart.
There is two spread calculation mode: -> Server spread value -> Ask - Bid value
Can set opacity, for better customization. When spread jump bigger, then display do not
FREE

ICT Silver Bullet
If you are searching for a reliable indicator to trade the ICT Silver Bullet concept, or ICT concepts, Smart Money Concepts, or SMC, this indicator will respond to your need! Before version 2.2, this indicator was focused only on ICT Silver Bullet, but moving forward, we will include the different elements for smart money concept trading. This indicator will help you identify the following: FVG - fair value gaps Market structure: BOS and CHOCH. It is based on swing high and l

Dark Inversion is an Indicator for intraday trading. This Indicator is based on Counter Trend strategy but use also Volatility. We can enter in good price with this Indicator, in order to follow the inversions on the current instrument. Hey, I made an Expert Advisor based on this indicator, if you are interested: Dark Titan MT5
Key benefits
Easily visible Inversion Lines Intuitive directional arrows Automated adjustment for each timeframe and instrument Easy to use even for beginners Never r
FREE

Special offer : ALL TOOLS , just $35 each! New tools will be $30 for the first week or the first 3 purchases ! Trading Tools Channel on MQL5 : Join my MQL5 channel to update the latest news from me Découvrez la puissance du concept Inversion Fair Value Gap (IFVG) de l’ICT avec l’ Indicateur Inversion Fair Value Gaps ! Cet outil de pointe pousse les Fair Value Gaps (FVG) à un niveau supérieur en identifiant et affichant les zones de FVG inversées — des zones clés de support et de ré

L'indicateur montre une divergence haussière et baissière. L'indicateur lui-même (comme le stochastique ordinaire) est affiché dans une sous-fenêtre. Interface graphique : Dans la fenêtre principale, des objets graphiques « ligne de tendance » sont créés - produits du prix « bas » au prix « bas » (pour une divergence haussière) et produits du prix « haut » au prix « haut » (pour une divergence baissière). ). L'indicateur dessine dans sa fenêtre exclusivement à l'aide de tampons graphiques : «

What is the Volume Weighted Average Price (VWAP)? The volume weighted average price (VWAP) is a trading benchmark used by traders that gives the average price an instrument has traded at throughout the day, based on both volume and price. It is important because it provides traders with insight into both the trend and value of the instrument.
What is the Difference between VWAP and AVWAP? While VWAP is having as starting point the beggining of the day,week,month etc. in the AVWAP you can pla

Comment interpréter l'indicateur Delta Volume Score : 1. Le Panneau de Métriques (Aggressive Score System) Le panneau situé dans le coin supérieur droit est le "cerveau" de l'indicateur. Il résume la bataille entre acheteurs et vendeurs. Buyer Score : Représente le volume accumulé des ordres d'achat au marché (agression). Seller Score : Représente le volume accumulé des ordres de vente au marché (agression). Aggressive Score : C'est le solde net (Delta). S'il est positif et vert, les acheteurs o
FREE

CDI Asymmetric Channel PRO – Feature Overview This indicator is a hybrid channel tool that combines three powerful approaches: statistical modeling (long-term) , wave-following logic (short-term) , and quantified distortion analysis (subwindow) —all anchored by a shared fractal peak detection engine. 1. Hybrid Adaptive Algorithm While using a unified fractal detection engine, the indicator simultaneously applies three distinct calculation models with different roles: 1-1. Short-Term (Small Chann

Multi timeframe ZigZag indicator. It displays the support/resistance horizontal lines and their breakouts, as well as draws the current targets of the market. It can also display lines of the Fractals indicator and candles from other periods (up to Quarterly). So, you can actually see the supply and demand levels. Indicator – connects key lows and highs to show trend lines. You can also use it as indicator for the Break of Structure(BOS) & Market Structure Shift(MSS). The indicator redraws the

Strifor Lot Calculator is a tool for MetaTrader 5 that helps traders calculate the correct lot size based on risk and stop-loss.
It allows you to trade more consciously, manage risks better, and save time on manual calculations. Advantages Accurate risk control – automatically calculates the lot size according to your chosen risk %. Two working modes – manual input or quick calculation using chart lines. Supports all popular instruments – forex pairs, gold (XAUUSD), oil (USOIL/WTI), indices (US
FREE

Price Volume Trend (PVT) Oscillator Description: The PVT Oscillator is a volume indicator that serves as an alternative to the standard On-Balance Volume (OBV). While ordinary volume indicators can be noisy and hard to read, this tool converts volume flow into a clear Histogram Oscillator, similar to a MACD, but for Volume. It is designed to detect first Trend Reversals and Divergences by analyzing the difference between a Fast and Slow PVT moving average. Why is this better than standard OBV?
FREE

Indicador gratuito para Metatrader 5 que muestra en pantalla una caja rectangular para cada una de las sesiones de mercado "Londres, New York y Tokio". Se puede establecer la zona horaria de forma automática o mediante un valor de offset. Parámetros de configuración para cada una de las sesiones. Visible / No visible Hora Inicial Hora Final Caja sólida o transparente. Estilo del borde de la caja. Grosor del borde de la caja. Color.
FREE

C'est un indicateur très simple et facile à utiliser pour tout le monde. Cependant, il est très visuel, utile et efficace. Il convient à tous les symboles Forex et à toutes les périodes. Mais d'après mes tests et mes investigations, je ne recommande pas de l'utiliser avec les délais M1, M5, M15. Paramètre. - Choisissez l'alerte On/Off (par défaut ON). - Sélectionnez le temps (secondes) entre 2 alertes. La valeur par défaut est 30 secondes Comment ça fonctionne? - Tendance haussière—Lorsque la c
FREE

Cet indicateur trouve et affiche les modèles d'analyse technique Double Bottom et Double Top. Signale (affiche un message à l'écran) si la forme a été formée récemment. Souvent, après l'apparition de ces modèles, la tendance s'inverse ou une correction se produit. Afin de ne pas les rechercher vous-même, ou de ne pas rater leur apparition, il suffit d'ajouter un indicateur au graphique. L'indicateur peut être utilisé sur différentes périodes et paires de devises, il existe des paramètres pour u
FREE

Projective SR – Supports et Résistances Projetés en Temps Réel Projective SR est un indicateur avancé qui détecte automatiquement les points clés de support et de résistance sur le graphique et les projette de manière diagonale et dynamique vers le futur , anticipant ainsi les zones potentielles où le prix pourrait réagir. Contrairement aux indicateurs traditionnels qui n'affichent que des niveaux fixes, Projective SR analyse la géométrie des prix , identifie les points pivots les plus pertinent
FREE

SMC Precision AI Unlock the edge of institutional trading with SMC Precision AI – an advanced AI-powered Smart Money Concept (SMC) based FIBO Retrenchment indicator built for serious traders who want precision, clarity, and high-probability trade setups.
Key Features It Plots Fibo Retrenchment Zones.
AI-Powered Signals – Enhanced by real-time AI logic to adapt to changing market conditions with Reasonable accuracy
Signal Clarity – It Draws Fibo Bands- When the Lower Line Is drawn it indicat

Phoenix Auto Fibonacci Monitor (MT5)
Outil professionnel d'analyse Fibonacci et des fluctuations pour MetaTrader 5. Détecte automatiquement les fluctuations dominantes du marché et fournit des informations avancées sur les retracements de Fibonacci grâce à un tableau de bord visuel en temps réel.
Présentation
Phoenix Auto Fibonacci Monitor identifie automatiquement les fluctuations majeures du marché à l'aide d'un pivot à intervalle de temps supérieur et d'une validation ATR, puis trace des n
FREE

Multicurrency and multitimeframe modification of the ZigZag indicator. Displays the current direction of the market, the height of the last movement, the number of bars in this movement and the breaking of the previous point of the ZigZag (horizontal line). This is MTF Scanner, you can actually see the supply and demand levels.
You can specify any desired currencies and timeframes in the parameters. Also, the panel can send notifications when the ZigZag changes direction or when there was a br

Auto Candle Sequence Counter – Indicateur MT5
Présentation Auto Candle Sequence Counter est un indicateur professionnel pour MetaTrader 5 qui détecte et met en évidence automatiquement les séquences consécutives de bougies haussières et baissières. Il fournit une visualisation en temps réel, des statistiques et des alertes pour soutenir les stratégies basées sur l’action des prix.
Fonctionnalités principales
Détection de séquences de 2 à 7 bougies (haussières/baissières).
Cartographie précis
FREE

Boom and crash Gold Miner v2 trend histogram which works in conjunction with the indicator above that has arrows as shown in the video. PLEASE Note: That the top indicator and the bottom indicator are two separate indicators. the top indicator is https://www.mql5.com/en/market/product/98066 the bottom one is free. which is the histogram at the bottom. the trend histogram trading tool that helps to easy detect the trend blue color indicates an uptrend. Orange color is a down trend.
FREE
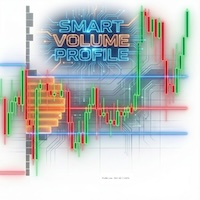
French Scan de la "Smart Money" (Marqueurs de Volume): Des flèches indiquent un volume anormal (supérieur à la moyenne) avec un code couleur vert/rouge clair. Cela aide à identifier l'entrée des gros investisseurs et à filtrer les faux signaux. Alertes Décisives (Alerts): Pas besoin de surveiller l'écran en permanence. Le système vous avertit immédiatement lorsque le prix croise la ligne POC (Point de Contrôle), souvent un point décisif pour la continuation ou le retournement. Structure de March
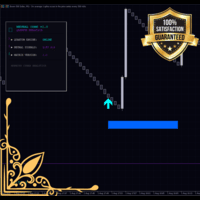
Monet Signal Master - Advanced Neural Trading System Version 1.00 Author: MONETFX Introduction Monet Signal Master is a professional technical indicator for MetaTrader 5 that generates non-repainting buy and sell signals using advanced multi-oscillator analysis. The indicator combines Stochastic and RSI crossovers with SuperTrend filtering to identify high-probability trading opportunities. Features include a cyberpunk-style dashboard, visual risk management zones, and comprehensive alert system
FREE

Candle Range Theory - CRT
Mark Candle Range Theory - CRT bars on the chart.
Options:
choose between 2 bar CRT or CRT that include inside bars Show higher time frame CRT on lower time frame chart show current time frame CRT on chart with higher time frame CRT Alert when new CRT has formed Show / Hide Labels
Button Menu to select Options
for more information on using Candle Range Theory - CRT look on X for @Romeotpt
@SpeculatorFL
Manual

RBC Range Bar Chart is a classical range bar chart indicator. The indicator features price ranges for charting: High/Low price range is a classical option for analysis. It also has Open, High, Low and Close prices. In the first option, two price values are analyzed at the same time, while other options only use one price. Conventionally, range bars are drawn using tick data but since tick data is not available on the server, charting is only possible based on bar data from standard time frames.

Description. The basis for the formation of the Renko chart is the price range. If the price goes beyond its limits, the chart shows a box above or below the previous one. As a result, we see price movement without additional "noise" and important support and resistance levels. Features.
For use in conjunction with the Expert Advisor, an additional buffer is implemented-a box counter. For convenience and to increase the speed of testing, the user can use the "new box" event, which the indicator
FREE

This is a simple Candle Stick Pattern Indicator, which shows in the current time period all standardisized Patterns in the chart. All Patterns will be calculatet automatically based on standard conditions. Following Candle Stick Patterns are included: Bullish Hammer | Bearish Hammer Bullish Inverted Hammer | Bearish Inverted Hammer Bullish Engulfing | Bearish Engulfing Piercing | Dark Cloud Cover Bullish 3 Inside | Bearish 3 Inside There are only a few settings at the begining to take. Every Pat
FREE

Smart Entry Levels - Fractal and ATR Based Indicator Smart Entry Levels identifies key support and resistance zones using classical fractal detection and ATR-based volatility measurement. The indicator is designed for clarity, stability, and compliance with MQL5 Market rules. Features Upper Zone - Resistance area based on recent fractal highs Lower Zone - Support area based on recent fractal lows ATR-based sizing - Zones adapt dynamically to market volatility with selectable timeframe Non-repain
FREE

Documentation for connecting Metatrader 5 with Python with a simple drag and drop EA.
A full end-to-end solution ,fully tested ,fast and efficient!
The Pytrader ecosystem consists of a python script and a MT5 or MT4 version EA.
Further for the licensing an indicator is used.
The communication between the python script and the EA is based on sockets.
EA is the Server and the python script the Client .
It is always query(function / python script) and output(data / server).
T

TB5 Channel is a multi- timeframe channel indicator. It generates input points on different timeframes. There are 2 methods for constructing an indicator. The first method is to install the indicator on the current timeframe. In this case you will have a channel on that timeframe that you have at MT5. The second method to install an indicator is to multiply it by the timeframe index. The point of the second method is to construct a higher timeframe channel on the current chart. For example, i

This indicator belongs to the family of channel indicators. These channel indicator was created based on the principle that the market will always trade in a swinging like pattern. The swinging like pattern is caused by the existence of both the bulls and bears in a market. This causes a market to trade in a dynamic channel. it is designed to help the buyer to identify the levels at which the bulls are buying and the bear are selling. The bulls are buying when the Market is cheap and the bears a

The Super Trend is one of the best trend-following indicator for MT5 platforms. It's working fine for real-time trend alerts and accurate signals and it help to identify the best market entry and exit positions. This indicator is the tool you can refers to a trend following overlays. It contains two major parameters: the period and the multiplier. Besides, traders should consider default values that include 10 for every true range aтd 3 for the multiplier. 2 Types TP SL you set in input Point
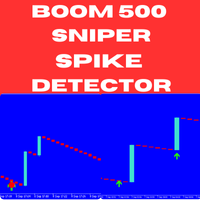
Introducing the Boom 500 Sniper Spike Detector – an advanced, non-repainting indicator specifically crafted to help you capture spikes in the Boom 500 market with precision. Whether you are an experienced trader or just starting, this indicator provides reliable signals that simplify spike trading, making it an essential addition to your trading arsenal. Key Features: Non-Repainting Signals : The Boom 500 Sniper Spike Detector generates highly reliable signals that do not repaint, allowing you t

Ghost Renko Overlay Indicator Overview Ghost Renko Overlay Indicator displays Renko bricks directly on the main price chart as a semi-transparent overlay.
Unlike traditional Renko charts that require a separate offline window, this indicator allows traders to view standard candlestick price action and Renko structure simultaneously on the same chart. The overlay helps identify trend direction, price noise, and consolidation phases without losing time-based market context. Key Features Renko bric
FREE

RABBY: The "Momentum Dislocation" Indicator for XAUUSD M1 (Also suitable for Indices like Nas100 M1)
Gold M1 (XAUUSD)
Stop Getting Trapped by M1 Noise. Start Trading the Dislocation.
The first indicator that visualizes "Price Detachment" for high-precision entries.
You don't need another arrow. You need to see the Structure of the move.
If you trade Gold (XAUUSD) on the 1-minute timeframe, you know the feeling: An indicator prints a "Buy" signal. You enter. Two minutes later, the cand

FXLAND Smart Reversal Indicator (MT5)
FXLAND Smart Reversal Indicator is a professional technical analysis tool designed to help traders identify potential price reversal zones and key market turning points with clarity and precision.
The best reversal indicator and price return by choosing only one ceiling or floor in each time frame
A masterpiece of combining mathematics and Gann, fractal matrix, Fibonacci, movement angle and time. Completely intelligent
Key Features
Detects potenti

Ultimate Boom and Crash Indicator
The Ultimate Boom and Crash Indicator is a cutting-edge tool developed by Coetsee Digital , designed to identify potential spike opportunities in the market. Crafted for traders focusing on Deriv and Weltrade synthetic markets, this indicator is optimized to operate exclusively on the 3-minute (M3), 5-minute (M5), 15-minute (M15), 30-minute (M30), and 1-hour (H1) timeframes and supports only the following pairs: PainX 1200, PainX 999, PainX 800, PainX 600, Pai

MACD Intraday Trend PRO est un indicateur développé grâce à une adaptation du MACD original créé par Gerald Appel dans les années 1960.
Au fil des années de négociation, il a été observé qu'en modifiant les paramètres du MACD avec les proportions de Fibonacci, nous obtenons une meilleure présentation de la continuité des mouvements de tendance, ce qui permet de détecter plus efficacement le début et la fin d'une tendance de prix.
En raison de son efficacité à détecter les tendances de prix, i

NeoBull Predictive Ranges est un système d'analyse technique complet pour MetaTrader 5. Il combine des calculs de volatilité avancés avec une analyse de tendance basée sur le volume. Cet outil est conçu pour fournir aux traders des informations précises sur la structure du marché et le flux d'ordres. Je mets cet outil professionnel gratuitement à la disposition de la communauté. Détails Techniques: Predictive Ranges: L'indicateur projette des zones de support et de résistance adaptatives basées
FREE

This indicator shows the TLH and TLL and some trendlines that allow us to estimate the trend of market. It also shows the values of the angles of the lines in percentage in points (pip) , the standard deviation, and the trend of each line, and when it breaks the lines of support and resistance (TLH and TLL). And finally, it also shows the points identified as supports and resistances through the fractal algorithm in the graph. The high and low trend lines are supported by the highs and lows, th
FREE

Version améliorée du MACD Histogram (pour suivre les variations de momentum) L’indicateur MACD standard de MT5 utilise la valeur de la ligne MACD elle-même pour le calcul de l’histogramme. Dans des conditions de fluctuations rapides ou de marchés latéraux, ces histogrammes évoluent lentement et ne reflètent pas toujours clairement l’accélération ou la décélération de la force haussière ou baissière. Cela est particulièrement vrai lorsque le prix ne montre pas encore de retournement clair, entraî
FREE
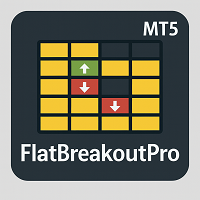
FlatBreakoutPro MT5 Multi-Symbol Flat Panel and Breakout Detector for MT5 FlatBreakoutPro MT5 is a professional tool for modern traders, designed to detect and monitor flat (sideways) zones and instantly react to breakouts across multiple instruments and timeframes. The indicator uses transparent fractal logic, guarantees clear non-repainting signals, and provides full visual control of the market situation. Who Is This Product For? Active traders who prefer breakout trading strategies (range br
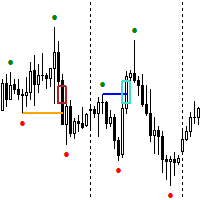
YouTube Channel: https://www.youtube.com/@trenddaytrader FREE EA for GOLD , Anticipation can be found here: https://www.mql5.com/en/market/product/123143
The Expert Advisor for this Indicator can be found here: https://www.mql5.com/en/market/product/115476 The Break of Structure (BoS) and Change of Character indicator with Fair Value Gap (FVG) filter is a specialized tool designed to enhance trading strategies by pinpointing high-probability trading opportunities on price charts. By
FREE

The Market Structure Analyzer is a powerful tool designed for traders who follow market structure and smart money concepts. This comprehensive indicator provides a suite of features to assist in identifying key market levels, potential entry points, and areas of liquidity. Here's what it offers:
1. Swing High/Low Detection : Accurately identifies and marks swing highs and lows, providing a clear view of market structure.
2. Dynamic Supply and Demand Zones: Draws precise supply and demand zone
This Demand & Supply Zone Indicator with Volume Filtering is a technical analysis tool for MetaTrader that identifies key price zones where buying (demand) or selling (supply) pressure is concentrated. It uses fractals, volume analysis, and price action to detect and highlight these zones on the chart. Key Features: Zone Detection Based on Fractals Identifies demand (support) and supply (resistance) zones using fractal patterns (local highs/lows). Zones are formed from open prices ar
FREE
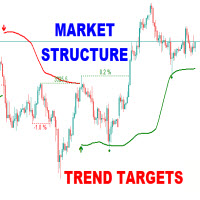
The Market Structure Trend Targets is a powerful trading indicator designed to give traders a clear, structured, and data-driven view of market momentum, breakouts, and key price reaction zones. Built on the principles of smart market structure analysis , it helps identify not only trend direction, but also precise breakout levels , trend exhaustion , and potential reversal zones — all with visual clarity and trader-friendly metrics. Key Features Breakout Points with Numbered Markers Track signi

Are you tired of drawing Support & Resistance levels for your Quotes? Are you learning how to spot Support & Resistances? No matter what is your case, Auto Support & Resistances will draw those levels for you! AND, it can draw them from other timeframes, right into you current chart, no matter what timeframe you are using... You can also Agglutinate regions/zones that are too much closer to each other and turning them into one single Support & Resistance Level. All configurable.
SETTINGS
Timefr
FREE

Smart Volume Box is designed to give MetaTrader users a powerful, analytical tool for uncovering the hidden dynamics in the market. This precision-built tool, complete with user-friendly settings, integrates essential volume insights and advanced features like Volume Profile, VWAP (Volume Weighted Average Price), and Point of Control (POC) levels. Unlike typical indicators, Smart Volume Box doesn’t provide specific trade signals but instead offers a clearer perspective on market trends, makin
Volume Profile Density V2.40 Affiche la répartition du volume par niveau de prix, mettant en évidence les zones d’intérêt institutionnel.
Contrairement au volume classique, il montre où le volume s’est réellement concentré. Principe : Barres horizontales = volume échangé à chaque prix Barre plus longue → volume plus élevé Zones rouges = supports et résistances majeurs Utilisation principale : Identifier les zones de support/résistance réelles Déterminer le POC (Point of Control) Définir la Value
FREE
This indicator is designed to automate the process of identifying and visualizing market structure, a cornerstone of price action and Smart Money Concepts (SMC) trading. It intelligently maps the flow of the market by plotting Higher Highs (HH), Higher Lows (HL), Lower Highs (LH), and Lower Lows (LL) directly on your chart. How It Works The indicator's logic is based on detecting pivot swing points using a configurable number of bars to the left and right of a candle. It then uses these pivots t
FREE

Neural-Link Pattern Scanner: Advanced Candlestick Recognition for MetaTrader 5 The Neural-Link Pattern Scanner is a professional-grade technical analysis tool designed for the MetaTrader 5 platform. It automates the detection of high-probability candlestick patterns, providing real-time visual labels directly on the trading interface. By filtering for specific mathematical price structures, this indicator helps traders identify potential reversals and trend continuations with precision. Core Fun
FREE
Le MetaTrader Market est le meilleur endroit pour vendre des robots de trading et des indicateurs techniques.
Il vous suffit de développer une application pour la plateforme MetaTrader avec un design attrayant et une bonne description. Nous vous expliquerons comment publier votre produit sur Market pour le proposer à des millions d'utilisateurs de MetaTrader.
Vous manquez des opportunités de trading :
- Applications de trading gratuites
- Plus de 8 000 signaux à copier
- Actualités économiques pour explorer les marchés financiers
Inscription
Se connecter
Si vous n'avez pas de compte, veuillez vous inscrire
Autorisez l'utilisation de cookies pour vous connecter au site Web MQL5.com.
Veuillez activer les paramètres nécessaires dans votre navigateur, sinon vous ne pourrez pas vous connecter.