MetaTrader 5용 기술 지표 - 9

MT5용 Koala FVG를 소개합니다 - 귀하의 프로페셔널한 Fair Value Gap (FVG) 패턴 인디케이터입니다. Koala FVG: MT5에서 정밀 트레이딩을 위한 당신의 길 Koala FVG를 사용하여 Fair Value Gap (FVG) 패턴의 힘을 발견하세요. 이것은 MetaTrader 5용으로 설계된 최첨단 인디케이터입니다. 한정된 시간 동안 이 프로페셔널한 도구에 무료로 액세스할 수 있습니다. 이 도구가 프리미엄 인디케이터로 전환되기 전에 무료로 이용해보세요. 주요 특징: FVG 패턴 감지: Koala FVG는 최소 및 최대 크기를 사용자 정의할 수 있는 기준에 따라 자동으로 FVG 패턴을 식별합니다. 시각적 표현: FVG 영역을 나타내는 동적 사각형을 포함한 그래픽 표시로 명확성을 경험해보세요. 세 개의 선이 정밀한 분석을 위해 FVG 레벨을 강조합니다. 화살표 입장 신호: 거래 기회를 놓치지 마세요. Koala FVG는 입장 지점을 나타내는 명확한 화살표 신
FREE

The indicator looks for consolidation (flat) in the market at a certain time, builds a box-channel and marks levels indented from it for a breakdawn. After crossing one of the levels, the indicator marks the zone for take profit and calculates the corresponding profit or loss in the direction of this entry on the panel. Thus, the indicator, adjusting to the market, finds a flat area of the market, with the beginning of a trend movement to enter it. Version for MT4: https://www.mql5.com/en/market
FREE
REVERSAL POWER PRO
The ONLY Indicator That Shows You Where Markets WILL Reverse - BEFORE They Move
WELCOME TO THE NEXT LEVEL OF TRADING PRECISION
Tired of guessing where the market will turn? Missing entries because you don't know where support/resistance REALLY is? Getting stopped out at "fake" levels? Wondering if your bias is correct before entering?
What if you had: Crystal-clear Supply/Demand Zones that markets RESPECT Daily Bias Engine telling you market directio
FREE

Indicator Guide: Key Price Levels & Structure Shifts 1. Description The indicator is a technical analysis tool for the MetaTrader 5 platform. It is designed to automatically identify specific price movements and to highlight corresponding price zones based on preceding price action. This provides a visualization of key price areas according to the indicator's internal logic. 2. Visual Elements & Their Identification The indicator identifies and draws several types of visual elements on the chart
FREE

This indicator is an MQL5 port inspired by the "Cyclic Smoothed RSI" concept originally developed by Dr_Roboto and popularized by LazyBear and LuxAlgo on TradingView. The Cyclic Smoothed RSI (cRSI) is an oscillator designed to address the two main limitations of the standard RSI: lag and fixed overbought/oversold levels. By using digital signal processing (DSP) based on market cycles, the cRSI reduces noise without sacrificing responsiveness. It features Adaptive Bands that expand and contract
FREE

Ichimoku Trend Alert is the Ichimoku Kinko Hyo indicator with Alerts and signal filters.
Ichimoku Trend Alert features: Optional check of Ichimoku cloud, Tenkan sen(Conversion Line), Kijun sen(Base Line), Senkou span A, Senkou span B, and Chikou span relative to price, and more. Popup, email, and phone notification alerts for selected symbols and timeframes.
There are 9 classic Ichimoku trend filters you can enable/disable in settings: Price/Cloud Order: Checks the price position relative to
FREE

This is a derivative of John Carter's "TTM Squeeze" volatility indicator, as discussed in his book "Mastering the Trade" (chapter 11).
Gray dot on the midline show that the market just entered a squeeze (Bollinger Bands are with in Keltner Channel). This signifies low volatility, market preparing itself for an explosive move (up or down). Blue dot signify "Squeeze release".
Mr.Carter suggests waiting till the first blue after a gray dot, and taking a position in the direction of the moment
FREE

Bar Countdown is a simple indicator for MetaTrader 5 that shows the time remaining of the each candle. It can be placed in any corner of the chart or near of the price close and it'll help you to know
if the current candle is ending. Choose the counter format between HR:MIN:SEC and MIN:SEC It is so easy to use, configure the color, size and counter position on the chart and that's it!!! The Countdown starts now!
Updates: 2021/02/28; v1.0: Initial release 2021/03/16; v1.1: Minor code changes
FREE

This indicator finds and displays the Double Bottom and Double Top technical analysis patterns. Signals (displays a message on the screen) if the shape was formed recently. Often after the appearance of these patterns, the trend reverses or a correction occurs. In order not to search for them yourself, or not to miss their appearance, it is enough to add an indicator to the chart. The indicator can be used on different timeframes and currency pairs, there are settings for a better search on a c
FREE

Do you love VWAP? So you will love the VWAP Cloud . What is it? Is your very well known VWAP indicator plus 3-levels of Standard Deviation plotted on your chart and totally configurable by you. This way you can have real Price Support and Resistance levels. To read more about this just search the web for "VWAP Bands" "VWAP and Standard Deviation".
SETTINGS VWAP Timeframe: Hourly, Daily, Weekly or Monthly. VWAP calculation Type. The classical calculation is Typical: (H+L+C)/3 Averaging Period to
FREE
** All Symbols x All Time frames scan just by pressing scanner button ** Discount: The price is $50$, But now it is just $35, Limited time offer is active.
*** Contact me to send you instruction and add you in "Swing scanner group" for sharing or seeing experiences with other users. Swing EA: https://www.mql5.com/en/market/product/124747 Introduction: Swing Scanner is the indicator designed to detect swings in the direction of the trend and possible reversal swings. The indicator st
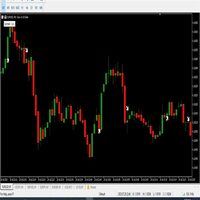
hello,
king binary sureshot mt5 binary indicator,
1 minute candle
1 minute expire
Alright. This indicator works on MT5 and is very easy to use. When you receive a signal from it, you wait for that candle with the signal to close and you enter your trade at the beginning of the next new candle. A red arrow means sell and a green arrow means buy. All arrows comes with a long dotted like for easy identification of trade signal. Are you okay with that?
FREE

이 지표로 강력한 시장 통찰력을 얻으세요. Nelogica의 Profit의 Visual Book에서 영감을 받아 차트에 시각적 주문장(order book)을 표시합니다. 매수량(파란색)과 매도량(빨간색)을 수평 막대로 보여주며, 큰 거래량은 노란색으로 강조 표시되어 고유동성 구간을 쉽게 식별할 수 있습니다. 가격은 주문이 가장 많이 집중된 영역으로 이동하는 경향이 있어 지지 및 저항 구간을 파악하는 데 필수적인 도구입니다. 완전히 사용자 맞춤 설정이 가능해 모든 트레이딩 스타일에 적합하며, 실시간 업데이트로 시장의 동적 변화를 따라갈 수 있습니다. MetaTrader 5에서 외환, 주식 및 기타 금융 시장 분석에 이상적입니다. 이 지표는 직관적이고 사용이 간편해 시장의 돌파나 반전 기회를 포착하는 데 큰 도움이 됩니다. 브로커가 시장 깊이(주문장) 데이터를 제공해야 합니다. 지금 다운로드하여 명확하고 실용적인 분석으로 트레이딩을 강화하세요!
FREE

swing trading logic and professional MQL5 development at first glance. The candlestick chart in the center represents real market structure, showing both bearish (red) and bullish (green) movements. This highlights the indicator’s ability to capture medium-term price swings , not just short scalps. The transition from red candles on the left to green candles on the right visually communicates trend reversal and continuation , which is the core of swing trading. The curved arrows play an importa
FREE

This indicator is specifically designed for boom 1000 index. The indicator contains optimised trend filters to target buy spikes in an uptrend. The indicator also add a grid buy signal to recover some loss of the first buy signal. The indicator also provides exit signals for delayed spikes which can help with risk management .Also it analyses signals for historical data and displays percentage of good signals provided by the indicator. KEY FEATURES Non-lagging indicator. Non-repaint. Enable/d
FREE

This indicator displays the wave structure of the market in the form several wave levels nested in each other. For each of these levels an automatic preliminary (draft) marking of waves in Elliott's style (123..., ABC... etc.) is created. This markup is completely automatic and absolutely univocal. The indicator is especially useful for beginner wave analysts, because among all the possible versions for wave marking, it allows you to immediately take the most adequate version as a ba

캔들 카운터는 그 날의 첫 캔들부터 캔들 개수를 출력하는 인디케이터입니다. 오늘의 첫 번째 양초는 숫자 1이 되며 새 양초는 이 개수에서 1씩 증가합니다.
입력 매개변수 짝수, 홀수 또는 모두에서 선택 촛불에서 숫자 인쇄까지의 거리 텍스트 글꼴 크기 텍스트 글꼴 색상
여전히 질문이 있는 경우 다이렉트 메시지로 저에게 연락하십시오. https://www.mql5.com/ko/users/robsjunqueira/ ----------------- 이것이 우리가 지속적으로 발전 할 수있는 유일한 방법이기 때문에 개선을위한 제안에 부담없이 문의하십시오. 또한 당사의 다른 지표 및 전문 고문에 대해 알아보십시오. 다양한 유형의 자산을 거래할 수 있는 다양한 상품이 있음을 알 수 있습니다.
FREE

ICT Silver Bullet
If you are searching for a reliable indicator to trade the ICT Silver Bullet concept, or ICT concepts, Smart Money Concepts, or SMC, this indicator will respond to your need! Before version 2.2, this indicator was focused only on ICT Silver Bullet, but moving forward, we will include the different elements for smart money concept trading. This indicator will help you identify the following: FVG - fair value gaps Market structure: BOS and CHOCH. It is based on swing high and l

Professional VWAP Trading System with Advanced Signal Detection Transform your trading with the most comprehensive VWAP indicator available for MetaTrader 5. Magic VWAP Key Levels Pro combines multiple timeframe analysis, intelligent signal detection, and professional-grade visualization to give you the edge in modern markets. CORE FEATURES: Multi-Timeframe VWAP Analysis Session, Weekly, and Monthly VWAP calculations Previous 10-day VWAP support/resistance Dynamic anchor periods (Session/Week/Mo

지표는 강세와 약세 다이버전스를 보여줍니다. 지표 자체는 (일반 확률론과 마찬가지로) 하위 창에 표시됩니다. 그래픽 인터페이스 : 메인 창에서 그래픽 개체 "추세선"이 생성됩니다. 즉, "낮은" 가격에서 "낮은" 가격(강세 다이버전스의 경우)으로 생성되고 "고가"에서 "고가" 가격(약세 다이버전스의 경우)으로 생성됩니다. ). 표시기는 그래픽 버퍼("메인", "신호", "점", "매수" 및 "판매")만을 사용하여 창을 그립니다. "매수" 및 "판매" 버퍼는 차이를 표시합니다. 이는 실제 표시기 버퍼이므로 모두 EA에서 읽을 수 있습니다. 도트 버퍼는 발산점을 보다 명확하게 시각화하는 데 사용됩니다. 옵션 : "엄격한 신호" - 이 매개변수를 "true"로 설정하면 강세 다이버전스는 "main" <= "Value Level #1"(기본값은 '25') 값에 대해서만 발생하고 약세 다이버전스는 "main" > = "Value Level #2" 값에만 적용됩니다(기본값은 '75')
거래 전략을 강화하세요 Nadaraya Watson Envelope Alert MT5 는 비모수 커널 회귀를 활용한 최첨단 지표로, 부드럽고 적응형 트렌드 분석을 제공합니다. Nadaraya-Watson 추정기에서 영감을 받은 이 도구는 가격 데이터에 가우시안 커널 평활화를 적용하여 시장 변동성에 적응하는 동적 엔벨로프를 생성하지만, 전통적인 이동 평균의 과도한 지연은 없습니다. TradingView와 같은 플랫폼에서 널리 인정받고 전 세계 트레이더로부터 반전 발견의 정확성으로 찬사를 받는 Nadaraya Watson Envelope는 2022년 이후 인기가 급증하며 Bollinger Bands의 우수한 대안으로 자리 잡았습니다. 비재도장 모드는 실시간 신뢰할 수 있는 신호를 보장하며, 재도장 옵션은 깊이 있는 분석을 위한 울트라 부드러운 시각을 제공합니다. 트레이더들은 Nadaraya Watson Envelope를 트렌드 강도, 과매수/과매도 조건, 잠재적 반전 포인트를 놀라운

AW Super Trend -가장 인기 있는 클래식 트렌드 지표 중 하나입니다. 그것은 간단한 설정을 가지고 있으며 추세로 작업할 수 있을 뿐만 아니라 이 표시기로 계산되는 손절매 수준도 표시합니다. 이익:
악기: 통화 쌍 , 주식, 상품, 지수, 암호 화폐. 기간: М15 이상. 거래 시간: 24시간 내내. 현재 추세의 방향을 보여줍니다. 손절매를 계산합니다. 거래를 할 때 사용할 수 있습니다. 세 가지 유형의 알림: 푸시, 이메일, 경고. MT4 버전 -> 여기 / 뉴스 - 여기 기능:
표시기는 해당 색상으로 현재 추세 방향을 표시합니다.
- 파란색은 현재 기간에 사용된 기호의 상승 추세를 나타냅니다.
- 선의 빨간색은 선택한 기호에서 사용된 기간의 하락 추세를 나타냅니다.
표시기를 사용하여 StopLoss를 설정할 수 있습니다.
표시선은 막대 위에 표시되지 않고 막대를 기준으로 약간 이동하여 표시됩니다. 추세선이 표시되는 이 곳은 트레이더가 손
FREE

This is Heiken Ashi smoothed version, where you can choose on what type smoothness you want to make your strategy base. You can choose between EMA or MA, on the period you want. And you can choose colors.
Definition:
The Heikin-Ashi technique averages price data to create a Japanese candlestick chart that filters out market noise. Heikin-Ashi charts, developed by Munehisa Homma in the 1700s, share some characteristics with standard candlestick charts but differ based on the values used to cre
FREE

이 지표는 가격 차트에 프랙탈을 표시하여 트레이더가 중요한 국부적 고점과 저점을 식별하는 데 도움을 줍니다. 프랙탈은 클래식한 정의에 따라 특정한 지점으로 간주되며, 중앙 캔들이 양옆의 두 개의 캔들보다 높을 때 국부적 고점이 형성되고, 중앙 캔들이 양옆의 두 개의 캔들보다 낮을 때 국부적 저점이 형성됩니다. 다른 제품 -> 여기 주요 기능 및 장점 : 유연한 표시 — 이 지표는 상향 및 하향 프랙탈을 원, 사각형, 삼각형 등 다양한 기호로 시각화할 수 있습니다. 사용자 지정 가능한 색상 — 차트에서 가시성을 높이기 위해 색상 테마를 조정할 수 있습니다. 예를 들어, 상승 프랙탈을 녹색으로, 하락 프랙탈을 빨간색으로 설정할 수 있습니다. 조정 가능한 오프셋 — 수직 오프셋을 설정하여 프랙탈 마커가 캔들과 겹치지 않도록 적절히 배치할 수 있습니다. 모든 시간 프레임과 호환 — 1분(M1)부터 월간(MN) 차트까지 모든 시간 프레임에서 정상적으로 작동하여 다용도로 사용할 수 있습니다.
FREE

Pivot trading:
1.pp pivot
2. r1 r2 r3, s1 s2 s3
Necessary for traders: tools and indicators Waves automatically calculate indicators, channel trend trading Perfect trend-wave automatic calculation channel calculation , MT4 Perfect trend-wave automatic calculation channel calculation , MT5 Local Trading copying Easy And Fast Copy , MT4 Easy And Fast Copy , MT5 Local Trading copying For DEMO Easy And Fast Copy , MT4 DEMO Easy And Fast Copy , MT5 DEMO
Cooperation QQ:556024"
Cooperation wechat
FREE
VM Breakout BB: 볼린저 밴드를 이용한 확률 기반 브레이크아웃 지표 VM Breakout BB는 볼린저 밴드를 기반으로 통계적 확률 분석(Z-스코어 및 정규 누적 분포 함수 CDF)과 RSI, ADX, Volume SMA 같은 스마트 확인 필터를 결합한 브레이크아웃 탐지 지표입니다. 이 지표는 명확한 통계적 근거를 가진 신호를 제공하고 노이즈를 줄이며 성공 확률이 더 높은 브레이크아웃을 확인하는 것을 목표로 합니다. 신호 로직
매수: 가격이 상단 밴드 위에서 종가를 기록하고, 브레이크아웃 확률이 설정된 임계값에 도달하며 확인 필터가 만족될 때(RSI/ADX/Volume이 활성화된 경우).
매도: 가격이 하단 밴드 아래에서 종가를 기록하고, 브레이크아웃 확률이 설정된 임계값에 도달하며 확인 필터가 만족될 때(활성화된 경우). ConfirmOnClosedBar 옵션은 바 마감 후에만 신호를 확정하여 오작동을 줄입니다. 사용자는 신호의 엄격도를 Relaxed, Normal 또는
FREE
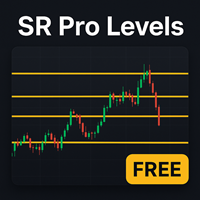
수동으로 그리지 않고 몇 초 만에 명확한 시장 구조 확인!
HTF 자동 지지/저항 지표 는 차트에 주요 지지 및 저항 레벨을 자동으로 표시합니다. 이 레벨은 높은 타임프레임(HTF)에 기반하므로, 단기 임의선보다 훨씬 신뢰성이 높습니다. 주요 기능: 가장 강한 지지/저항 구역 자동 감지 멀티 타임프레임 분석: 더 정확한 레벨을 위해 상위 타임프레임 선택 즉각적인 인식을 위한 색상 구분된 명확한 구역 주관적 오류 없음 – 고정 규칙에 따라 객관적으로 계산 모든 시장 최적화: 포렉스, 지수, 원자재, 암호화폐 바로 사용 가능 – 최적 기본 설정 포함 트레이더 장점: 시장이 전환하거나 반응할 가능성이 높은 위치를 빠르게 확인 강력한 구역에서만 거래하여 나쁜 세팅 필터링 시간을 절약하고 일관된 분석 레벨로 성공률 향상 스캘퍼, 데이 트레이더, 스윙 트레이더에 적합 사용 팁: 설정에서 원하는 상위 타임프레임 선택 (예: H4, D1, W1) 구역을 프라이스 액션 또는 캔들 패턴과 결합 시장
FREE

The Hull Moving Average is not very well know in novice and maybe in intermediate trading circles, but it is a very nice solution created by the trader Alan Hull - please visit www.AlanHull.com for full details of his creation. The purpose of this moving average is to solve both problems that all famouse and common moving averages have: Lag and Choppiness . The implementation we did has, apart of the Period configuration and Price type to use in the calculations, a "velocity" factor, which could
FREE

This MQL5 indicator draws four Exponential Moving Averages (EMAs) — 21, 50, 100, and 200 — directly on the chart window.
The EMA 21 is displayed as a color-changing line , while EMA 50, 100, and 200 are standard single-color lines.
The color of EMA 21 changes dynamically based on price position.
When the closing price is above EMA 21 , the line turns blue , indicating bullish pressure.
When the closing price is below EMA 21 , the line turns yellow , indicating bearish pressure.
If the price equa
FREE
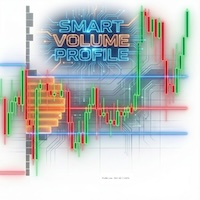
Korean "Smart Money" 스캔 (Volume Markers): 평균보다 높은 비정상적인 거래량을 녹색/빨간색 화살표로 명확하게 표시합니다. 이는 **세력(Smart Money)**의 진입을 식별하고 속임수 신호 를 걸러내는 데 도움을 줍니다. 주요 알림 (Alerts): 하루 종일 화면을 지켜볼 필요가 없습니다. 가격이 추세의 지속 또는 반전을 결정하는 중요한 지점인 **POC(매물대 중심)**를 교차할 때 시스템이 즉시 알림을 보냅니다. 실시간 시장 구조 확인 (Developing Profile): 현재 형성되고 있는 가격 주기의 프로필을 보여줍니다. 가격이 매집 구간 을 돌파하고 있는지, 아니면 평균으로 다시 회귀 하고 있는지 파악할 수 있습니다. thank you ..

This wonderful tool works on any pair producing alerts whenever the market enters the overbought and oversold zones of the market. The signals come as BUY or SELL but it does not necessarily mean you should go on and execute order, but that you should begin to study the chart for potential reversal. For advanced signal tools check out some of our premium tools like Dual Impulse.
FREE

if you want to test it : private message me ( MT5 demo testing doesn't work ) Designed to help traders gain a deeper understanding of the market’s true order flow dynamics . By visualizing the “ footprints ” left by candles, this indicator reveals how the delta ( the difference between buying and selling pressure ) changes during the candle formation, as well as how volume fluctuates at different price levels. These insights are essential for traders seeking to identify reversals, breakouts, and
Volume Profile Density V2.40 가격 수준별 거래량 분포를 표시하여 기관 투자자의 관심 구간을 보여줍니다.
시간 기반 거래량과 달리, 실제 거래가 집중된 위치를 보여줍니다. 기본 원리: 수평 막대 = 가격별 거래량 막대가 길수록 거래량이 많음 빨간 구간 = 주요 지지 / 저항 구간 주요 사용 목적: 실제 지지선과 저항선 식별 POC (Point of Control) 확인 가치 영역 (총 거래량의 70%) 설정 낮은 거래량 구간을 손절 / 목표 지점으로 활용 색상 코드: 파란색 = 낮은 거래량 (빠른 이동 구간) 노란색 = 중간 거래량 (균형 구간) 빨간색 = 높은 거래량 (기관 매매 구간) 트레이딩 전략: 빨간 구간 반등 시 매수 VAH 또는 빨간 구간 저항 시 매도 거래량 동반 POC 돌파 시 진입 POC 회귀 시 재진입 파란 구간을 목표로 설정 설정: 초보자: 1.0 / 100% / 1.0 스캘핑: 0.5 / 200% / 0.5 스윙: 2.0 / 50% / 1
FREE

[Power Volume Candle] - Indicator to see the comparison of bullish and bearish volume
Volume comparison indicator on candlestick, by calculating the volume value of the specified candle history to determine the percentage of volume strength. calculates the percentage comparison of each time frame displayed on 1 screen. Subscribe the MQL5 channel for other interesting information : (Automatic) Forex Tools Join new Public Group to Expressing Opinions and Sharing: Auto Fx Investment See other
FREE
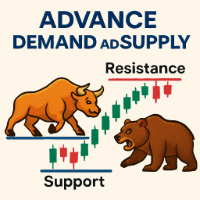
This Demand & Supply Zone Indicator with Volume Filtering is a technical analysis tool for MetaTrader that identifies key price zones where buying (demand) or selling (supply) pressure is concentrated. It uses fractals, volume analysis, and price action to detect and highlight these zones on the chart. Key Features: Zone Detection Based on Fractals Identifies demand (support) and supply (resistance) zones using fractal patterns (local highs/lows). Zones are formed from open prices ar
FREE

Place price Alerts on extended Rectangles and Trendlines - Risk reward indicator MT5 Extend Rectangles & Trendlines to the right edge Mark your supply demand zones with extended rectangle and draw support resistance lines with extended trendline. Find detailed manuals here . Find contacts on my profile . MT4 Rectangle extender indicator will simplify and make it easier for you to analyze markets and stay notified about important events. When you extend rectangle or trendline the action butt

TB5 Channel is a multi- timeframe channel indicator. It generates input points on different timeframes. There are 2 methods for constructing an indicator. The first method is to install the indicator on the current timeframe. In this case you will have a channel on that timeframe that you have at MT5. The second method to install an indicator is to multiply it by the timeframe index. The point of the second method is to construct a higher timeframe channel on the current chart. For example, i

This indicator belongs to the family of channel indicators. These channel indicator was created based on the principle that the market will always trade in a swinging like pattern. The swinging like pattern is caused by the existence of both the bulls and bears in a market. This causes a market to trade in a dynamic channel. it is designed to help the buyer to identify the levels at which the bulls are buying and the bear are selling. The bulls are buying when the Market is cheap and the bears a

Market profile was developed by Peter Steidlmayer in the second half of last century. This is a very effective tool if you understand the nature and usage. It's not like common tools like EMA, RSI, MACD or Bollinger Bands. It operates independently of price, not based on price but its core is volume. The volume is normal, as the instrument is sung everywhere. But the special thing here is that the Market Profile represents the volume at each price level.
1. Price Histogram
The Price Histogram i

The Super Trend is one of the best trend-following indicator for MT5 platforms. It's working fine for real-time trend alerts and accurate signals and it help to identify the best market entry and exit positions. This indicator is the tool you can refers to a trend following overlays. It contains two major parameters: the period and the multiplier. Besides, traders should consider default values that include 10 for every true range aтd 3 for the multiplier. 2 Types TP SL you set in input Point
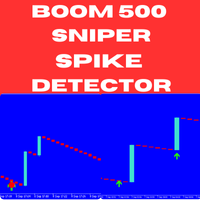
Introducing the Boom 500 Sniper Spike Detector – an advanced, non-repainting indicator specifically crafted to help you capture spikes in the Boom 500 market with precision. Whether you are an experienced trader or just starting, this indicator provides reliable signals that simplify spike trading, making it an essential addition to your trading arsenal. Key Features: Non-Repainting Signals : The Boom 500 Sniper Spike Detector generates highly reliable signals that do not repaint, allowing you t

이동 평균 및 알림이 있는 컬러 ROC - 고급 모멘텀 지표 개선된 Rate of Change (ROC)! 이 MetaTrader 5용 맞춤 지표는 시장 모멘텀의 명확하고 직관적인 뷰를 제공하며, 추세 가속 또는 감속의 정확한 신호를 찾는 트레이더에게 이상적입니다. ROC란 무엇이며 그 장점은? Rate of Change (ROC) 는 이전 기간에 대한 가격의 백분율 변화를 측정하는 순수 모멘텀 오실레이터입니다. 가격 움직임의 속도와 강도를 강조합니다: 양의 값은 상승 모멘텀 (bullish) 을 나타냅니다. 음의 값은 하락 모멘텀 (bearish) 을 나타냅니다. 제로 라인 교차는 가능한 추세 변화를 신호합니다. 가격과의 다이버전스는 조기 반전을 예측할 수 있습니다. MACD나 RSI와 같은 평활화 지표와 달리 ROC는 더 민감하고 빠르며, 가격 차트에서 명확해지기 전에 모멘텀 변화를 포착합니다. 짧은 표준 기간 (14 기간) 으로 빠른 가속을 감지하는 데 완벽하며, 특히 Fore

피닉스 추세 강도 측정기 (MT5)
메타트레이더 5용 시장 체제 및 추세 강도 분석기. ADX, RSI, 방향성 이동을 단일 패널에 통합하여 실시간 시장 상황을 분류합니다.
목적
대부분의 트레이더는 잘못된 진입이 아니라 잘못된 시장 체제에 부적합한 전략을 적용하기 때문에 실패합니다. 피닉스 추세 강도 측정기는 시장이 횡보 중인지, 추세를 형성 중인지, 강한 추세에 있는지, 아니면 소진 위험 영역에 진입했는지 트레이더가 즉시 판단할 수 있도록 돕습니다.
이 지표는 추세 강도를 위한 ADX, 방향성 편향을 위한 DI, 모멘텀 균형을 위한 RSI를 분석합니다. 이 요소들은 명확한 텍스트 기반 체제 분류(횡보, 신중한 매수/매도, 강한 매수/매도, 위험/확장)가 포함된 시각적 측정기로 통합됩니다. 패널은 새로운 바에서 업데이트되며 선택적 체제 변경 및 소진 알림을 포함합니다.
설치 방법
MQL5 마켓에서 다운로드하여 차트에 부착하세요. 사전 최적화된 기본값으로 패널이 즉시 표시됩
FREE

SMC Order Block Zones (MT5) is a Smart Money Concept (SMC) analytical indicator specially designed and optimized for Gold (XAUUSD) .
It automatically detects Order Blocks and displays them as Supply & Demand zones , helping traders identify potential institutional price levels on Gold. The indicator uses volatility-adaptive logic , making it highly suitable for the fast and aggressive movements of XAUUSD. Key Features (XAUUSD Optimized) Specially designed for Gold (XAUUSD) Automatic Order Block
FREE

Indicator Description (based on AVPT EA ):
This indicator visualizes a Volume Profile-based liquidity architecture on the chart by analyzing where trading volume is concentrated across price levels over a specified lookback period. It calculates key volume structures such as:
Point of Control (POC): the price level with the highest traded volume.
Value Area (VA): the range containing a configurable percentage of total volume (typically ~70%).
High-Volume Nodes (HVNs): price levels with sign
FREE

Ultimate Boom and Crash Indicator
The Ultimate Boom and Crash Indicator is a cutting-edge tool developed by Coetsee Digital , designed to identify potential spike opportunities in the market. Crafted for traders focusing on Deriv and Weltrade synthetic markets, this indicator is optimized to operate exclusively on the 3-minute (M3), 5-minute (M5), 15-minute (M15), 30-minute (M30), and 1-hour (H1) timeframes and supports only the following pairs: PainX 1200, PainX 999, PainX 800, PainX 600, Pai

MACD Intraday Trend PRO는 1960년대 Gerald Appel이 만든 원본 MACD를 개조하여 개발한 지표입니다.
수년간의 거래를 통해 MACD의 매개변수를 피보나치 비율로 변경함으로써 추세 움직임의 연속성을 더 잘 표현함으로써 가격 추세의 시작과 끝을 보다 효율적으로 감지할 수 있다는 것이 관찰되었습니다.
가격 추세를 감지하는 효율성으로 인해 상단과 하단의 차이를 매우 명확하게 식별하여 거래 기회를 더 잘 활용할 수도 있습니다.
특징 표시기 MACD Intraday Trend PRO는 모든 통화 쌍, 모든 시간대 및 Renko 차트에서 작동합니다. 5가지 모드를 선택하여 추세 감지 속도를 설정할 수 있습니다. 가장 빠른 빠른 정상 느린 가장 느림
자원 6개의 구성 가능한 경고가 있습니다. MACD는 신호 라인에서 후퇴 MACD가 신호선을 넘다 MACD는 레벨 0을 교차 신호선이 레벨 0을 넘습니다. MACD 변경 트렌드 색상 신호선 변경 TREND 색상

Auto Candle Sequence Counter – MT5 인디케이터
개요 Auto Candle Sequence Counter 는 MetaTrader 5용 전문 인디케이터로, 연속되는 강세 및 약세 캔들을 자동으로 탐지하고 표시합니다. 수동으로 캔들을 세는 대신, 실시간 시각화, 통계 및 알림 기능을 제공하여 트레이더의 가격 행동 전략을 지원합니다.
주요 기능
연속 2~7개의 강세/약세 캔들 감지
정확한 매핑으로 신호 누락 방지
Doji 탐지 (민감도 0.01–0.10 조정 가능)
약하거나 불필요한 캔들 필터링
전문적인 시각화 (녹색 = 강세, 빨강 = 약세, 노랑 = 도지)
실시간 통계 패널 (강세/약세 시퀀스 수)
알림 시스템: 팝업, 소리, 모바일 푸시
장점
추세 지속 또는 피로 신호를 신속하게 파악
수요공급, 지지/저항, SMC 전략과 결합 가능
스캘핑, 스윙, 데이 트레이딩에 적합
수동 계산 대신 자동화로 시간 절약
설정
시퀀스 임계값: 2–
FREE

NeoBull Predictive Ranges는 MetaTrader 5를 위한 포괄적인 기술적 분석 시스템입니다. 고급 변동성 계산과 거래량 기반 추세 분석을 하나의 지표로 결합했습니다. 이 도구는 트레이더에게 시장 구조와 주문 흐름(Order Flow)에 대한 정확한 정보를 제공하기 위해 개발되었습니다. 이 전문 도구를 커뮤니티에 무료로 제공합니다. 기능 및 기술적 세부 사항: Predictive Ranges (동적 변동성 채널): 적응형 지지 및 저항 구역을 차트에 표시합니다. 기존 밴드와 달리 현재 시장 속도에 적응하여 신뢰할 수 있는 반전 또는 돌파 지점을 제공합니다. Volumatic VIDYA: 수정된 Variable Index Dynamic Average(VIDYA)를 핵심으로 사용하며, 누적 매수 및 매도 거래량을 분석합니다. 녹색 선은 매수세가 강한 상승 추세를, 빨간색 선은 매도세가 강한 하락 추세를 나타냅니다. 대시보드: 실시간 거래량 델타(매수자 vs 매도자)를
FREE

Description. The basis for the formation of the Renko chart is the price range. If the price goes beyond its limits, the chart shows a box above or below the previous one. As a result, we see price movement without additional "noise" and important support and resistance levels. Features.
For use in conjunction with the Expert Advisor, an additional buffer is implemented-a box counter. For convenience and to increase the speed of testing, the user can use the "new box" event, which the indicator
FREE

This is a simple Candle Stick Pattern Indicator, which shows in the current time period all standardisized Patterns in the chart. All Patterns will be calculatet automatically based on standard conditions. Following Candle Stick Patterns are included: Bullish Hammer | Bearish Hammer Bullish Inverted Hammer | Bearish Inverted Hammer Bullish Engulfing | Bearish Engulfing Piercing | Dark Cloud Cover Bullish 3 Inside | Bearish 3 Inside There are only a few settings at the begining to take. Every Pat
FREE
UT Bot with Alerts The UT Bot Alerts Indicator for MetaTrader 5 is a versatile trading tool that generates buy and sell signals based on ATR-based trailing stop logic. It displays signals with arrows, draws an entry price line, and includes a candle countdown timer. The indicator offers customizable alerts (pop-up, email, push notifications) and a text label showing signal details. Users can adjust ATR sensitivity, label positions, and timer settings, making it suitable for various markets and
FREE

무료 AUX 지표, EA 지원 및 전체 가이드를 얻으시려면 방문하세요 – https://www.mql5.com/en/blogs/post/763955 트렌드를 포착하세요. 패턴을 읽으세요. 진입 시점을 타이밍하세요.
30초 이내의 3단계! 분석 없이도 쉽게 거래하세요 — 당신의 스마트 어시스턴트가 워크플로우를 단순화해 드립니다. 더 이상 차트 과부하 없음. 스마트 바이어스 감지로 자신감 있게 거래하세요. 모든 통화, 암호화폐, 주식, 금속, 지수 및 모든 시간대와 호환됩니다. 그냥 클릭하고 실행하세요 — 정말 간단합니다. 속도와 명확성을 원하는 바쁜 트레이더에게 이상적입니다. TPTSyncX는 추세, 패턴, 그리고 캔들스틱 트리거 분석을 하나로 통합하여 깨끗하고 지능적인 시각 시스템으로 동기화하는 강력한 올인원 MetaTrader 5 인디케이터입니다. 명확성, 정밀성, 속도를 원하는 트레이더를 위해 설계되었으며, 가격 행동, 구조적 패턴 및 시장 타이밍 도구의 조합을 통해 높은 확

Smart Volume Box is designed to give MetaTrader users a powerful, analytical tool for uncovering the hidden dynamics in the market. This precision-built tool, complete with user-friendly settings, integrates essential volume insights and advanced features like Volume Profile, VWAP (Volume Weighted Average Price), and Point of Control (POC) levels. Unlike typical indicators, Smart Volume Box doesn’t provide specific trade signals but instead offers a clearer perspective on market trends, makin

Indicador gratuito para Metatrader 5 que muestra en pantalla una caja rectangular para cada una de las sesiones de mercado "Londres, New York y Tokio". Se puede establecer la zona horaria de forma automática o mediante un valor de offset. Parámetros de configuración para cada una de las sesiones. Visible / No visible Hora Inicial Hora Final Caja sólida o transparente. Estilo del borde de la caja. Grosor del borde de la caja. Color.
FREE

VR Donchian 표시기는 Donchian 채널의 향상된 버전입니다. 개선 사항은 채널의 거의 모든 기능에 영향을 주었지만 주요 운영 알고리즘과 채널 구성은 그대로 유지되었습니다. 현재 추세에 따라 볼 표시기에 레벨 색상 변경이 추가되었습니다. 이는 거래자에게 추세 또는 플랫의 변화를 명확하게 보여줍니다. 스마트폰, 이메일 또는 MetaTrader 터미널 자체를 통해 두 채널 수준 중 하나의 돌파에 대해 거래자에게 알리는 기능이 추가되었습니다. 가격표가 추가되어 거래자가 차트에서 가격 수준을 볼 수 있습니다. 고전적인 Donchian 지표의 작동 알고리즘은 트레이더가 지표가 계산할 기간 수를 직접 설정할 수 있다는 사실로 인해 최적화되고 가속화되었습니다. 고전적인 Donchian 지표는 MetaTrader 터미널에서 사용할 수 있는 전체 내역을 계산하며, 이는 MetaTrader 터미널에 수학적 계산을 많이 로드합니다. VR Donchian 지표는 트레이더가 설정에 설정한 금액만
FREE

The indicator plots a trend channel using the technique by Gilbert Raff. The channel axis is a first-order regression. The upper and lower lines show the maximum distance the Close line had moved away from the axis line. Therefore, the upper and lower lines can be considered as resistance and support lines, respectively. A similar version of the indicator for the MT4 terminal
As a rule, most movements of the price occur within a channel, going beyond the support or resistance line only for a sh
FREE

Boom and Crash Gold miner v2 Trading indicator based on market momentum works on m1 for boom and crash 1000 and M5 time frame for normal trading pairs wait for blue arrow to appear plus change of candle stick color and candlesticks must be above the 2 modified moving averages then you can buy the market. wait for orange arrow to appear plus change of candle stick color and candlesticks must be below the 2 modified moving averages then you can sell the market.

BeST_Oscillators Collection is a Composite MT5 Indicato r including the Chaikin , Chande and TRIX Oscillators from which by default Chaikin and TRIX Oscillators but not Chande Momentum Oscillator are contained in MT5 platform. It also provides for each Oscillator the option of displaying or not a Mov. Average as a Signal Line and the resulting Signals as Arrows in a Normal (all arrows) or in a Reverse Mode (without showing up any resulting successive and of same type arrows).
Analytically fo
FREE

اسم المصدر: مؤشر أسعار الأسهم الخاص بمؤشر القوة النسبية 2 "مستويات سليمان" 지표와 "RSI Trend V" شكرا جزيلا. يبلغ عدد مستويات سليمان 9,800 مليون جنيه إسترليني، وهو ما يزيد عن 9,800 مليون دولار أمريكي شكرا جزيلا. شكرا جزيلا. مستويات سليمان في اللعبة: 노란색 박스 (자금 흐름 감지) - 노란색 박스 설명: ""الحصول على معلومات إضافية عن العمل" 기능 - 처음부터 개발됨": 특정 캔들에서 은행 및 기관의 자금 유입을 감지합니다. هذا هو السبب في أن هذا هو ما يحدث في المستقبل. اسم المنتج: """""""""""""" " 지표 기능 - 처음부터 개발됨": 재표시되지 독창적인 컬러 레벨 시스템. "هذا هو السبب
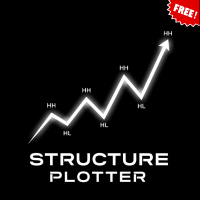
This indicator is designed to automate the process of identifying and visualizing market structure, a cornerstone of price action and Smart Money Concepts (SMC) trading. It intelligently maps the flow of the market by plotting Higher Highs (HH), Higher Lows (HL), Lower Highs (LH), and Lower Lows (LL) directly on your chart. How It Works The indicator's logic is based on detecting pivot swing points using a configurable number of bars to the left and right of a candle. It then uses these pivots t
FREE

이것은 매우 간단한 지표이며 모든 사람이 사용하기 쉽습니다. 그러나 매우 시각적이고 유용하며 효과적입니다. 모든 Forex 기호 및 모든 기간에 적합합니다. 그러나 내 테스트 및 조사에서 M1, M5, M15 기간과 함께 사용하지 않는 것이 좋습니다. 환경. - 경고 켜기/끄기를 선택합니다(기본값 켜짐). - 2개의 알림 사이의 시간(초)을 선택합니다. 기본값은 30초입니다.
어떻게 작동합니까?
- Uptrend - 막대 색상이 녹색일 때. - 하향 추세 - 막대 색상이 주황색일 때. - 막대의 색상이 변경되면 반전이 발생합니다.
사용에 대한 권장 사항
상승 추세에서 매수하고 막대의 고점은 거의 동일합니다(녹색). 하락세에서 매도하고 막대의 고점은 대략 동일합니다(주황색). 반전이 막 발생했을 때 시장에 진입하는 것을 피하고 2~3바 연속을 고려하십시오. 원하는 경우 Uptrend 및 Downtrend의 막대 색상을 변경할 수도 있습니다.
KPL 스윙 인디케이터와 결합하면
FREE

A simple indicator that automatically highlights all FVGs (Fair Value Gaps) formed on the chart, as well as FVGs on history. It is possible to select colors for FVGs of different directions (long or short), select the time interval, select the color of middle point and you can also choose whether to delete filled FVGs or leave them on the chart (the option is beneficial for backtesting). The indicator can be very useful for those, who trade according to the concept of smart money, ICT, or simply
FREE
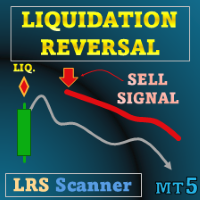
특별 할인 : ALL TOOLS , 개당 $35 ! 새 도구 는 $30 이며 첫 1주 또는 첫 3회 구매 에 해당합니다! Trading Tools Channel on MQL5 : 최신 소식을 확인하려면 제 MQL5 채널에 참여하세요 Liquidation Reversal Signals 는 Z-score 거래량 극값 과 Supertrend 상태 변화 를 결합하여 방향성 청산 단계 를 표시하고 반전 지점 을 확인하도록 설계된 인디케이터입니다. 추세가 단순히 “색이 바뀔” 때마다 화살표를 찍는 대신, 이 도구는 워크플로를 두 개의 명확한 레이어로 분리합니다: 청산 이벤트: 하위 타임프레임의 방향성 거래량(상승/하락 거래량)이 정의된 임계값을 초과하는 통계적으로 유의미한 스파이크를 만들 때 기록됩니다. 반전 신호: 기록된 청산 이벤트가 Timeout 창 안에서 유효한 동안 Supertrend가 상태를 전환할 때만 확인됩니다. 이

This indicator automatically identifies demand and supply zones on a number of 1000 candles or more, and you can change that number of settings.
It also carries a high level of accuracy in describing the type of each zone, as it contains:
Weak areas .
Untested areas . Strong areas . Role-taking areas . Areas tested + number of times visited . Areas to which a return is expected, depending on the direction . The indicator contains alert zones.
For signals and more free indicators, you can foll
FREE
Haven RSI Candlestick 은 기존의 상대강도지수(RSI) 라인 차트를 직관적인 캔들스틱 차트 형식으로 변환하는 혁신적인 기술 지표입니다.
이 도구는 기술적 분석에 의존하며 시장 모멘텀과 잠재적 반전 지점을 더 빠르고 깊이 있게 해석하고자 하는 트레이더를 위해 설계되었습니다. 기타 제품 -> 여기 . 주요 특징: RSI의 캔들스틱 시각화: 핵심 기능입니다. 이제 RSI 창 내에서 직접 프라이스 액션(Price Action) 기법과 캔들스틱 패턴 분석(예: '장악형', '도지')을 적용하여 모멘텀 변화의 신호를 더 일찍 감지할 수 있습니다. 클래식 분석과 RSI 동적 결합: 메인 차트의 캔들스틱 패턴과 RSI 캔들스틱 차트의 패턴을 교차 검증합니다. 가격 차트와 RSI 차트 모두에서 유사한 반전 신호가 동시에 나타나면 거래의 신뢰도가 크게 향상됩니다. 모든 상품 및 타임프레임에 적합: 통화, 주식, 암호화폐, 원자재 등 어떤 상품을 거래하든, 이 지표는 M1부터 MN까지
FREE

The MACD 2 Line Indicator is a powerful, upgraded version of the classic Moving Average Convergence Divergence (MACD) indicator.
This tool is the embodiment of versatility and functionality, capable of delivering comprehensive market insights to both beginner and advanced traders. The MACD 2 Line Indicator for MQL4 offers a dynamic perspective of market momentum and direction, through clear, visually compelling charts and real-time analysis.
Metatrader4 Version | How-to Install Product | How-t
FREE

Strifor Lot Calculator is a tool for MetaTrader 5 that helps traders calculate the correct lot size based on risk and stop-loss.
It allows you to trade more consciously, manage risks better, and save time on manual calculations. Advantages Accurate risk control – automatically calculates the lot size according to your chosen risk %. Two working modes – manual input or quick calculation using chart lines. Supports all popular instruments – forex pairs, gold (XAUUSD), oil (USOIL/WTI), indices (US
FREE

Product: Phantom Shadow Reversal Engine Version: 3.0 (Elite Edition) Developer: Trade With Thangam
THE ULTIMATE SCALPING TOOL FOR XAUUSD & MAJOR PAIRS
The Phantom Shadow Reversal Engine is not just another indicator; it is a complete trading system designed for precision scalping and day trading.
Instead of relying on lagging signals, this system uses a "Proprietary Shadow Engine" that analyzes Market
FREE
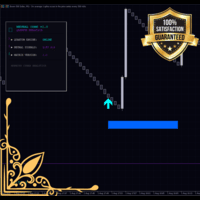
Monet Signal Master - Advanced Neural Trading System Version 1.00 Author: MONETFX Introduction Monet Signal Master is a professional technical indicator for MetaTrader 5 that generates non-repainting buy and sell signals using advanced multi-oscillator analysis. The indicator combines Stochastic and RSI crossovers with SuperTrend filtering to identify high-probability trading opportunities. Features include a cyberpunk-style dashboard, visual risk management zones, and comprehensive alert system
FREE
MetaTrader 마켓은 과거 데이터를 이용한 테스트 및 최적화를 위해 무료 데모 거래 로봇을 다운로드할 수 있는 유일한 스토어입니다.
어플리케이션의 개요와 다른 고객의 리뷰를 읽어보시고 터미널에 바로 다운로드하신 다음 구매 전 트레이딩 로봇을 테스트해보시기 바랍니다. 오직 MetaTrader 마켓에서만 무료로 애플리케이션을 테스트할 수 있습니다.
트레이딩 기회를 놓치고 있어요:
- 무료 트레이딩 앱
- 복사용 8,000 이상의 시그널
- 금융 시장 개척을 위한 경제 뉴스
등록
로그인
계정이 없으시면, 가입하십시오
MQL5.com 웹사이트에 로그인을 하기 위해 쿠키를 허용하십시오.
브라우저에서 필요한 설정을 활성화하시지 않으면, 로그인할 수 없습니다.