Guarda i video tutorial del Market su YouTube
Come acquistare un Robot di Trading o un indicatore
Esegui il tuo EA
hosting virtuale
hosting virtuale
Prova un indicatore/robot di trading prima di acquistarlo
Vuoi guadagnare nel Market?
Come presentare un prodotto per venderlo con successo
Indicatori tecnici per MetaTrader 5 - 9

Smart Volume Box is designed to give MetaTrader users a powerful, analytical tool for uncovering the hidden dynamics in the market. This precision-built tool, complete with user-friendly settings, integrates essential volume insights and advanced features like Volume Profile, VWAP (Volume Weighted Average Price), and Point of Control (POC) levels. Unlike typical indicators, Smart Volume Box doesn’t provide specific trade signals but instead offers a clearer perspective on market trends, makin

High Low Today (MT5) is a free, easy-to-use MetaTrader 5 indicator that displays the current day’s High and Low price levels on your chart. It even offers optional push notifications to alert you when the price touches or breaks these key levels. With a clean and minimalist design, it provides valuable intraday insights without cluttering your chart. Marks the current day’s High and Low on the chart (key intraday support/resistance levels) Clean, lightweight, and unobtrusive – only the essenti
FREE

Custom Spread Indicator *Please write a review, thanks!
Also MT4 version is available
Spread Indicator show the current spread in pips with color codes. Handle 3 levels, Low, Medium, High. You can set levels and colors for each level (eg. Low: Green, Medium: Orange, High: Red), and can choose display position on the chart.
There is two spread calculation mode: -> Server spread value -> Ask - Bid value
Can set opacity, for better customization. When spread jump bigger, then display do not
FREE

L' indicatore ICT NewYork Open Killzone è progettato per i trader che seguono gli Smart Money Concepts (SMC) , i modelli di trading ICT e le strategie basate sulla liquidità nel mercato Forex . Questo strumento indica la New York Open Killzone , che si estende dalle 11:00 alle 14:00 GMT , un momento critico in cui il volume istituzionale spesso porta a movimenti significativi. L'indicatore evidenzia gli intervalli di sessione , gli intervalli dei market maker
Special offer : ALL TOOLS , just $35 each! New tools will be $30 for the first week or the first 3 purchases ! Trading Tools Channel on MQL5 : Join my MQL5 channel to update the latest news from me Supply Demand Retest and Break Multi Timeframe , questo strumento traccia le zone di offerta e domanda basate su candele a forte momentum, permettendoti di identificare queste zone su più timeframe utilizzando la funzione timeframe selector . Con etichette di retest e break, insieme
Offerta speciale : ALL TOOLS , solo $35 ciascuno! Nuovi strumenti a $30 per la prima settimana o per i primi 3 acquisti ! Canale Trading Tools su MQL5 : unisciti al mio canale MQL5 per ricevere gli ultimi aggiornamenti Stochastic Z-Score è un oscillatore di momentum che normalizza il prezzo con un punteggio Z, lo limita tramite logica stocastica e lo rende più fluido con HMA; ALMA fornisce un contesto di lungo periodo. Offre un segnale chiaro e reattivo, oltre a istogramma opzional

Verve AI Reversal Pro Indicator Pro è il compagno di trading definitivo per chi richiede precisione assoluta e intuizioni di mercato senza pari. Sfruttando la potenza dell’intelligenza artificiale all’avanguardia, questo strumento sofisticato analizza continuamente l’azione del prezzo, il volume e la volatilità per individuare punti di inversione ad alta probabilità prima che si manifestino completamente. Integrando perfettamente algoritmi di machine learning avanzati con principi collaudati di

KT OBV Divergence mostra le divergenze regolari e nascoste che si formano tra il prezzo e l'oscillatore OBV (On Balance Volume).
Caratteristiche
Le divergenze asimmetriche vengono scartate per garantire maggiore precisione e ridurre il disordine visivo. Supporta strategie di trading sia per inversioni di tendenza che per continuazioni. Completamente compatibile e pronto per l'integrazione in un Expert Advisor. Utilizzabile sia per gli ingressi che per le uscite dal mercato. Tutti gli avvisi sta
Il Pin bar tracker è un indicatore progettato per trovare i modelli di pin bar nei grafici di valute, oro e bitcoin in qualsiasi intervallo di tempo, include uno strumento che calcola automaticamente il rapporto rischio-rendimento, il lotto e i possibili punti di stop loss e take profit. Caratteristiche: - Funziona in qualsiasi intervallo di tempo - Calcola automaticamente i lotti - Mostra i livelli di stop loss e take profit - Invia un avviso quando rileva un Pin Bar
FREE

BOOM AND CRASH PRO SPIKER This indicator is specifically designed for all boom and crash indices. The indicator targets buy spike signals for boom indices and sell spike signals for crash indices. The indicator contains optimized trend filters to target buy spikes in an uptrend and sell spikes in a downtrend. The indicator also adds a grid signal to recover some loss of the first signal. The indicator also provides exit signals for delayed spikes which can help with risk management. Also, it an
FREE
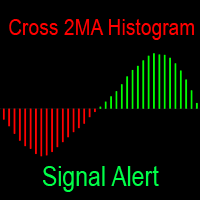
L'indicatore mostra la differenza tra le due medie mobili sotto forma di un grafico a barre. Le medie mobili hanno enormi opportunità di personalizzazione. Notifica in tutti i modi quando il colore dell'istogramma cambia: emette un segnale acustico nel terminale, invia una notifica al telefono e una lettera alla posta: ora non perderai sicuramente l'affare. Indicatore di intersezione delle medie mobili completamente gratuito sotto forma di linee sul grafico: https://www.mql5.com/it/market/produc
FREE

Questo cruscotto scopre e visualizza le zone di domanda e offerta sul grafico, sia in modalità scalping che a lungo termine, a seconda della vostra strategia di trading per i simboli selezionati. Inoltre, la modalità scanner del cruscotto vi aiuta a controllare tutti i simboli desiderati in un colpo d'occhio e a non perdere nessuna posizione adatta / versione MT4
Indicatore gratuito: Basic Supply Demand
Caratteristiche Consente di visualizzare le opportunità di trading su più
Candle Timer Countdown (CTC) – Minimalist & Precise Candle Timer Candle Timer Countdown (CTC) is a lightweight and non-intrusive MetaTrader indicator that displays the remaining time of the current candlestick on your chart. Designed with simplicity and clarity in mind, this tool helps traders stay aware of candle closures without cluttering the chart. Key Features: Real-Time Candle Countdown
Always know how many seconds are left before the current candle closes – works on all timeframes. Minima
FREE

This is a derivative of John Carter's "TTM Squeeze" volatility indicator, as discussed in his book "Mastering the Trade" (chapter 11).
Gray dot on the midline show that the market just entered a squeeze (Bollinger Bands are with in Keltner Channel). This signifies low volatility, market preparing itself for an explosive move (up or down). Blue dot signify "Squeeze release".
Mr.Carter suggests waiting till the first blue after a gray dot, and taking a position in the direction of the moment
FREE

Pivot trading:
1.pp pivot
2. r1 r2 r3, s1 s2 s3
Necessary for traders: tools and indicators Waves automatically calculate indicators, channel trend trading Perfect trend-wave automatic calculation channel calculation , MT4 Perfect trend-wave automatic calculation channel calculation , MT5 Local Trading copying Easy And Fast Copy , MT4 Easy And Fast Copy , MT5 Local Trading copying For DEMO Easy And Fast Copy , MT4 DEMO Easy And Fast Copy , MT5 DEMO
Cooperation QQ:556024"
Cooperation wechat
FREE

Bar Countdown With Symbol Info is a sleek, non-intrusive Heads-Up Display (HUD) designed to keep essential market data in front of your eyes without cluttering the chart. It combines a smart candle timer with a comprehensive symbol information strip.
Key Features: Smart Candle Countdown: Follow-Price Mode: The timer attaches dynamically to the Bid price line, moving up and down with the market so your eyes never leave the action. Dynamic Coloring: The background changes color in real-time
FREE

Super Trend Plus L'indicatore descritto è un sistema di trading che utilizza quattro Supertrend settati con diversi parametri. L'idea alla base di questo sistema è che quando tre Supertrend si muovono nella stessa direzione, si ha una forte conferma del trend, ma l'ingresso avviene solo quando anche il quarto Supertrend si muove nella stessa direzione degli altri tre. Ad esempio, si potrebbe utilizzare il primo Supertrend con un coefficiente moltiplicatore della volatilità di 3 e un periodo d

This all-in-one indicator displays real-time market structure (internal & swing BOS / CHoCH), order blocks, premium & discount zones, equal highs & lows, and much more...allowing traders to automatically mark up their charts with widely used price action methodologies. Following the release of our Fair Value Gap script, we received numerous requests from our community to release more features in the same category. "Smart Money Concepts" (SMC) is a fairly new yet widely used term amongst price a

Indicator Description (based on AVPT EA ):
This indicator visualizes a Volume Profile-based liquidity architecture on the chart by analyzing where trading volume is concentrated across price levels over a specified lookback period. It calculates key volume structures such as:
Point of Control (POC): the price level with the highest traded volume.
Value Area (VA): the range containing a configurable percentage of total volume (typically ~70%).
High-Volume Nodes (HVNs): price levels with sign
FREE
UT Bot with Alerts The UT Bot Alerts Indicator for MetaTrader 5 is a versatile trading tool that generates buy and sell signals based on ATR-based trailing stop logic. It displays signals with arrows, draws an entry price line, and includes a candle countdown timer. The indicator offers customizable alerts (pop-up, email, push notifications) and a text label showing signal details. Users can adjust ATR sensitivity, label positions, and timer settings, making it suitable for various markets and
FREE

Sonic R Indicator Description Overview The Sonic R Indicator for MT5 is designed to help traders analyze market trends using moving averages and volume analysis. This tool assists in identifying potential price movements by displaying trend zones and volume strength, making it suitable for various trading strategies. Key Features Dual EMA Trend Channels – Uses 34-period Exponential Moving Averages (EMA) to visualize price movement. Volume Analysis – A color-coded histogram to indicate changes i

[Power Volume Candle] - Indicator to see the comparison of bullish and bearish volume
Volume comparison indicator on candlestick, by calculating the volume value of the specified candle history to determine the percentage of volume strength. calculates the percentage comparison of each time frame displayed on 1 screen. Subscribe the MQL5 channel for other interesting information : (Automatic) Forex Tools Join new Public Group to Expressing Opinions and Sharing: Auto Fx Investment See other
FREE

Sblocca potenti intuizioni di mercato con questo indicatore che mostra un libro ordini visivo sul grafico, ispirato al Visual Book di Profit di Nelogica. Visualizza barre orizzontali che rappresentano i volumi di acquisto (blu) e di vendita (rosso), con evidenziatura in giallo per i volumi elevati, facilitando l'identificazione delle zone ad alta liquidità. Il prezzo tende a muoversi verso le aree con le maggiori concentrazioni di ordini, rendendolo uno strumento essenziale per individuare livel
FREE

NeoBull Predictive Ranges è un sistema completo di analisi tecnica per MetaTrader 5. Combina calcoli avanzati di volatilità con un'analisi dei trend basata sui volumi. Questo strumento è stato progettato per fornire ai trader informazioni precise sulla struttura del mercato e sull'Order Flow. Offro questo strumento professionale gratuitamente alla community. Dettagli Tecnici: Predictive Ranges: L'indicatore proietta zone di supporto e resistenza adattive basate sull'ATR. Volumatic VIDYA: Il cuor
FREE
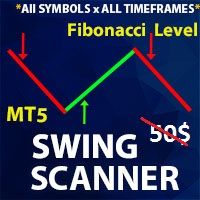
** All Symbols x All Time frames scan just by pressing scanner button ** Discount: The price is $50$, But now it is just $35, Limited time offer is active.
*** Contact me to send you instruction and add you in "Swing scanner group" for sharing or seeing experiences with other users. Swing EA: https://www.mql5.com/en/market/product/124747 Introduction: Swing Scanner is the indicator designed to detect swings in the direction of the trend and possible reversal swings. The indicator st
Ottieni una struttura di mercato chiara in pochi secondi – senza disegnare manualmente!
L’ Indicatore HTF Auto Support & Resistance segna automaticamente sul grafico i livelli chiave di supporto e resistenza. Questi livelli si basano su un timeframe superiore (HTF), quindi sono molto più affidabili delle linee casuali a breve termine. Caratteristiche principali: Rilevamento automatico delle zone di supporto e resistenza più forti Analisi multi-timeframe: scegli un timeframe più alto per livelli
FREE

SMC Order Block Zones (MT5) is a Smart Money Concept (SMC) analytical indicator specially designed and optimized for Gold (XAUUSD) .
It automatically detects Order Blocks and displays them as Supply & Demand zones , helping traders identify potential institutional price levels on Gold. The indicator uses volatility-adaptive logic , making it highly suitable for the fast and aggressive movements of XAUUSD. Key Features (XAUUSD Optimized) Specially designed for Gold (XAUUSD) Automatic Order Block
FREE

Indicator Guide: Key Price Levels & Structure Shifts 1. Description The indicator is a technical analysis tool for the MetaTrader 5 platform. It is designed to automatically identify specific price movements and to highlight corresponding price zones based on preceding price action. This provides a visualization of key price areas according to the indicator's internal logic. 2. Visual Elements & Their Identification The indicator identifies and draws several types of visual elements on the chart
FREE

AW Super Trend - Questo è uno degli indicatori di tendenza classici più popolari. Ha un'impostazione semplice, ti consente di lavorare non solo con la tendenza, ma mostra anche il livello di stop loss, che viene calcolato da questo indicatore. Benefici:
Strumenti: Coppie di valute , azioni, materie prime, indici, criptovalute. Tempi: М15 e superiori. Tempo di negoziazione: tutto il giorno. Mostra la direzione del trend attuale. Calcola lo stop loss. Può essere utilizzato quando si lavor
FREE

ICT Silver Bullet
If you are searching for a reliable indicator to trade the ICT Silver Bullet concept, or ICT concepts, Smart Money Concepts, or SMC, this indicator will respond to your need! Before version 2.2, this indicator was focused only on ICT Silver Bullet, but moving forward, we will include the different elements for smart money concept trading. This indicator will help you identify the following: FVG - fair value gaps Market structure: BOS and CHOCH. It is based on swing high and l
Professional VWAP Trading System with Advanced Signal Detection Transform your trading with the most comprehensive VWAP indicator available for MetaTrader 5. Magic VWAP Key Levels Pro combines multiple timeframe analysis, intelligent signal detection, and professional-grade visualization to give you the edge in modern markets. CORE FEATURES: Multi-Timeframe VWAP Analysis Session, Weekly, and Monthly VWAP calculations Previous 10-day VWAP support/resistance Dynamic anchor periods (Session/Week/Mo

L’indicatore mostra una divergenza rialzista e ribassista. L'indicatore stesso (come il normale stocastico) viene visualizzato in una sottofinestra. Interfaccia grafica : Nella finestra principale vengono creati oggetti grafici "linea di tendenza" - prodotti dal prezzo "Basso" al prezzo "Basso" (per divergenza rialzista) e prodotti dal prezzo "Alto" al prezzo "Alto" (per divergenza ribassista) ). L'indicatore disegna nella sua finestra utilizzando esclusivamente buffer grafici: “Main”, “Signa
Eleva la tua strategia di trading con l' Nadaraya Watson Envelope Alert MT5 , un indicatore all'avanguardia che sfrutta la regressione kernel non parametrica per fornire un'analisi delle tendenze fluida e adattiva. Ispirato allo stimatore Nadaraya-Watson, questo strumento applica lo smoothing kernel gaussiano ai dati di prezzo, creando envelope dinamiche che si adattano alla volatilità del mercato senza il ritardo eccessivo delle medie mobili tradizionali. Largamente acclamato su piattaforme com

Smart SR Levels Support and Resistance - Professional Strength-Based Support & Resistance Indicator MT5
Key Features: • Automatic detection of significant Support and Resistance levels • Line thickness based on level strength (number of touches + volume factor) • Custom colours for Support and Resistance • Multi-timeframe support • Clean background lines (no overlap with candles) • Labels showing S/R type and strength value
Perfect for price action traders, supply-demand zones, and institutio
FREE

Monitor dei pattern candlestick Phoenix (MT5)
Strumento di rilevamento e monitoraggio dei pattern candlestick in tempo reale per MetaTrader 5. Identifica automaticamente i pattern candlestick classici su più simboli e visualizza statistiche complete sui pattern attraverso un dashboard visivo.
Panoramica
Phoenix Candlestick Pattern Monitor rileva e traccia i pattern Doji, Hammer, Shooting Star, Bullish Engulfing, Bearish Engulfing, Morning Star, Evening Star, Three White Soldiers e Three Black
FREE

Filigrana centralizzata
Aggiunge una filigrana centrata con il nome della risorsa e il periodo scelto.
È possibile ignorare il tipo di carattere, la dimensione del carattere, il colore del carattere e il carattere separatore.
La filigrana è posizionata dietro le candele, non disturbando la visualizzazione.
Ha il ricentramento automatico se la finestra viene ridimensionata.
Spero che questo indicatore ti aiuti, buon trading;)
FREE

The Volume Weighted Average Price is similar to a moving average, except volume is included to weight the average price over a period. Volume-Weighted Average Price [VWAP] is a dynamic, weighted average designed to more accurately reflect a security’s true average price over a given period . Mathematically, VWAP is the summation of money (i.e., Volume x Price) transacted divided by the total volume over any time horizon, typically from market open to market close.
VWAP reflects the capitali
FREE

Description. The basis for the formation of the Renko chart is the price range. If the price goes beyond its limits, the chart shows a box above or below the previous one. As a result, we see price movement without additional "noise" and important support and resistance levels. Features.
For use in conjunction with the Expert Advisor, an additional buffer is implemented-a box counter. For convenience and to increase the speed of testing, the user can use the "new box" event, which the indicator
FREE

The indicator plots a trend channel using the technique by Gilbert Raff. The channel axis is a first-order regression. The upper and lower lines show the maximum distance the Close line had moved away from the axis line. Therefore, the upper and lower lines can be considered as resistance and support lines, respectively. A similar version of the indicator for the MT4 terminal
As a rule, most movements of the price occur within a channel, going beyond the support or resistance line only for a sh
FREE

L'indicatore VR Donchian è una versione migliorata del canale Donchian. I miglioramenti hanno interessato quasi tutte le funzioni del canale, ma l'algoritmo operativo principale e la costruzione del canale sono stati preservati. All'indicatore a sfera è stato aggiunto un cambiamento nel colore dei livelli a seconda della tendenza attuale: questo mostra chiaramente al trader un cambiamento di tendenza o un livello piatto. È stata aggiunta la possibilità di informare il trader del superamento di u
FREE
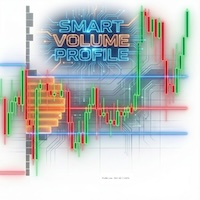
Italian Scansione "Smart Money" (Volume Markers): Le frecce indicano un volume anomalo (superiore alla media) con chiari colori verde/rosso. Aiuta a identificare l'ingresso dei grandi investitori e a filtrare i falsi segnali. Avvisi Critici (Alerts): Non serve fissare lo schermo. Il sistema ti avvisa immediatamente quando il prezzo incrocia la linea POC (Point of Control), che è spesso un punto decisivo per la continuazione o l'inversione. Struttura di Mercato Istantanea (Developing Profile): Mo

if you want to test it : private message me ( MT5 demo testing doesn't work ) Designed to help traders gain a deeper understanding of the market’s true order flow dynamics . By visualizing the “ footprints ” left by candles, this indicator reveals how the delta ( the difference between buying and selling pressure ) changes during the candle formation, as well as how volume fluctuates at different price levels. These insights are essential for traders seeking to identify reversals, breakouts, and

The indicator displays the orders book, as well as increases its depth, remembering the location of orders that have gone beyond the current "window" view.
Indicator capability Display the levels of open positions. Simulation of placing/cancelling/editing pending orders directly in the displayed orders book.
Indicator features The orders book display works only on those trading symbols for which it is broadcast by the broker. To reset the information about the rows that were recorded in the Sm
FREE

Did You Have A Profitable Trade But Suddenly Reversed? In a solid strategy, exiting a trade is equally important as entering.
Exit EDGE helps maximize your current trade profit and avoid turning winning trades to losers.
Never Miss An Exit Signal Again
Monitor all pairs and timeframes in just 1 chart www.mql5.com/en/blogs/post/726558
How To Trade You can close your open trades as soon as you receive a signal
Close your Buy orders if you receive an Exit Buy Signal. Close your Sell orders if
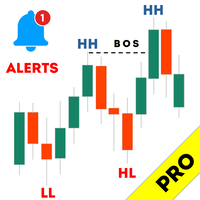
Haven Market Structure PRO - Il Tuo Analista di Mercato Professionale Presentiamo Haven Market Structure PRO – non è solo un indicatore, ma un sistema completo per automatizzare l'analisi del movimento dei prezzi, basato sui concetti chiave di Price Action e Smart Money. Questa versione PRO è stata creata per i trader che desiderano ottenere il massimo controllo sul grafico e vedere un quadro completo del mercato. Altri prodotti -> QUI Comprendere la struttura del mercato è il fondamento di

This is Wilder's ADX with cloud presentation of DI+ & DI- lines. Features
4 standard lines of the ADX indicator: DI+, DI-, ADX, ADXR cloud presentation of DI+/DI- lines with transparent colors applicable to all time-frames and all markets
What Is ADX
J. Welles Wilder Jr., the developer of well-known indicators such as RSI, ATR, and Parabolic SAR, believed that the Directional Movement System, which is partially implemented in ADX indicator, was his most satisfying achievement. In his 1978 book,
FREE

Auto Candle Sequence Counter – Indicatore MT5
Descrizione Auto Candle Sequence Counter è un indicatore professionale per MetaTrader 5 che rileva automaticamente sequenze consecutive di candele rialziste e ribassiste. Fornisce visualizzazione in tempo reale, statistiche e avvisi per migliorare l’analisi dell’azione dei prezzi.
Caratteristiche principali
Rilevamento di sequenze da 2 a 7 candele (rialziste/ribassiste).
Mappatura precisa senza perdita di segnali.
Rilevamento dei doji (sensibili
FREE

Questo indicatore è progettato per visualizzare i frattali sul grafico dei prezzi, aiutando i trader a identificare i massimi e minimi locali importanti. I frattali sono punti particolari sul grafico che corrispondono alla definizione classica: un massimo locale si forma quando la candela centrale è più alta delle due candele vicine su entrambi i lati, e un minimo locale si forma quando la candela centrale è più bassa delle due candele vicine. Altri prodotti -> QUI Funzionalità principali e van
FREE

TB5 Channel is a multi- timeframe channel indicator. It generates input points on different timeframes. There are 2 methods for constructing an indicator. The first method is to install the indicator on the current timeframe. In this case you will have a channel on that timeframe that you have at MT5. The second method to install an indicator is to multiply it by the timeframe index. The point of the second method is to construct a higher timeframe channel on the current chart. For example, i

This indicator belongs to the family of channel indicators. These channel indicator was created based on the principle that the market will always trade in a swinging like pattern. The swinging like pattern is caused by the existence of both the bulls and bears in a market. This causes a market to trade in a dynamic channel. it is designed to help the buyer to identify the levels at which the bulls are buying and the bear are selling. The bulls are buying when the Market is cheap and the bears a

Market profile was developed by Peter Steidlmayer in the second half of last century. This is a very effective tool if you understand the nature and usage. It's not like common tools like EMA, RSI, MACD or Bollinger Bands. It operates independently of price, not based on price but its core is volume. The volume is normal, as the instrument is sung everywhere. But the special thing here is that the Market Profile represents the volume at each price level.
1. Price Histogram
The Price Histogram i

The Super Trend is one of the best trend-following indicator for MT5 platforms. It's working fine for real-time trend alerts and accurate signals and it help to identify the best market entry and exit positions. This indicator is the tool you can refers to a trend following overlays. It contains two major parameters: the period and the multiplier. Besides, traders should consider default values that include 10 for every true range aтd 3 for the multiplier. 2 Types TP SL you set in input Point
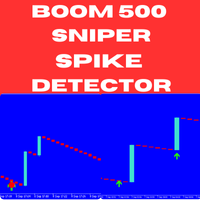
Introducing the Boom 500 Sniper Spike Detector – an advanced, non-repainting indicator specifically crafted to help you capture spikes in the Boom 500 market with precision. Whether you are an experienced trader or just starting, this indicator provides reliable signals that simplify spike trading, making it an essential addition to your trading arsenal. Key Features: Non-Repainting Signals : The Boom 500 Sniper Spike Detector generates highly reliable signals that do not repaint, allowing you t

ROC Colorato con Media Mobile e Avvisi - Indicatore Avanzato di Momentum Rate of Change (ROC) migliorato! Questo indicatore personalizzato per MetaTrader 5 offre una visione chiara e intuitiva del momentum del mercato, ideale per trader che cercano segnali precisi di accelerazione o decelerazione delle tendenze. Cos'è il ROC e i suoi vantaggi? Il Rate of Change (ROC) è un oscillatore di momentum puro che misura la variazione percentuale del prezzo rispetto a un periodo precedente. Evidenzia la v

The Hull Moving Average is not very well know in novice and maybe in intermediate trading circles, but it is a very nice solution created by the trader Alan Hull - please visit www.AlanHull.com for full details of his creation. The purpose of this moving average is to solve both problems that all famouse and common moving averages have: Lag and Choppiness . The implementation we did has, apart of the Period configuration and Price type to use in the calculations, a "velocity" factor, which could
FREE

Ultimate Boom and Crash Indicator
The Ultimate Boom and Crash Indicator is a cutting-edge tool developed by Coetsee Digital , designed to identify potential spike opportunities in the market. Crafted for traders focusing on Deriv and Weltrade synthetic markets, this indicator is optimized to operate exclusively on the 3-minute (M3), 5-minute (M5), 15-minute (M15), 30-minute (M30), and 1-hour (H1) timeframes and supports only the following pairs: PainX 1200, PainX 999, PainX 800, PainX 600, Pai

Bar Countdown is a simple indicator for MetaTrader 5 that shows the time remaining of the each candle. It can be placed in any corner of the chart or near of the price close and it'll help you to know
if the current candle is ending. Choose the counter format between HR:MIN:SEC and MIN:SEC It is so easy to use, configure the color, size and counter position on the chart and that's it!!! The Countdown starts now!
Updates: 2021/02/28; v1.0: Initial release 2021/03/16; v1.1: Minor code changes
FREE
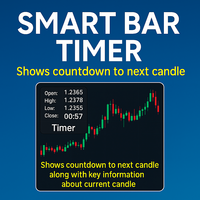
L' Enhanced Bar Timer è un indicatore versatile e personalizzabile per MetaTrader 5 (MT5) che fornisce informazioni in tempo reale sulla candela corrente, inclusi un timer di conto alla rovescia per la prossima barra, dettagli della candela, volume e spread. Visualizzato nell'angolo specificato dall'utente della finestra del grafico, questo indicatore offre un formato a più linee o a linea singola, consentendo ai trader di monitorare i dati di mercato critici a colpo d'occhio, migliorando il pro
FREE

Questo è un indicatore molto semplice e facile da usare per tutti. Tuttavia, è molto visivo, utile ed efficace. È adatto a ogni simbolo Forex e a qualsiasi periodo di tempo. Ma dai miei test e indagini, non consiglio di usarlo con i tempi M1, M5, M15. Collocamento.
- Scegli avviso On/Off (predefinito ON). - Selezionare il tempo (secondi) tra 2 avvisi. L'impostazione predefinita è 30 secondi Come funziona? - Uptrend: quando il colore della barra è verde. - Trend ribassista: quando il colore del
FREE

This wonderful tool works on any pair producing alerts whenever the market enters the overbought and oversold zones of the market. The signals come as BUY or SELL but it does not necessarily mean you should go on and execute order, but that you should begin to study the chart for potential reversal. For advanced signal tools check out some of our premium tools like Dual Impulse.
FREE

Dark Inversion is an Indicator for intraday trading. This Indicator is based on Counter Trend strategy but use also Volatility. We can enter in good price with this Indicator, in order to follow the inversions on the current instrument. Hey, I made an Expert Advisor based on this indicator, if you are interested: Dark Titan MT5
Key benefits
Easily visible Inversion Lines Intuitive directional arrows Automated adjustment for each timeframe and instrument Easy to use even for beginners Never r
FREE

Line Profit Indicator of the visual line of profit in the deposit currency. Works only if there are open positions in the market for the symbol on which the indicator is installed. You can move the line with the mouse or enable automatic tracking of the Bid price. Description of indicator settings: colotLine - line color WidthLine - line width colotText - text color FontSize - the height of the text Anchor - an anchor method for text FollowBid - follow the Bid price
FREE

Ottieni l’indicatore AUX GRATUITO, il supporto EA e la guida completa, visita per favore – https://www.mql5.com/en/blogs/post/763955 Individua la tendenza. Leggi il pattern. Cronometra l'ingresso.
3 passaggi in meno di 30 secondi! Opera senza sforzo — nessuna analisi richiesta, il tuo assistente intelligente è pronto a semplificare il tuo flusso di lavoro Basta sovraccarico di grafici. Opera con fiducia utilizzando il rilevamento intelligente del bias. Compatibile con tutte le valute, criptova

Divergence Force Indicatore di Divergenza Descrizione Divergence Force è un indicatore progettato per identificare le divergenze tra il prezzo di un asset e il MACD (Moving Average Convergence Divergence). Questo indicatore traccia automaticamente le linee di tendenza sui massimi e minimi del prezzo e del MACD, evidenziando le potenziali opportunità di trading. Funzionalità Principali Identificazione Automatica delle Divergenze : L'indicatore rileva automaticamente le divergenze rialziste e rib
FREE

Understanding the levels of the previous day or week is very important information for your trading.
This indicateur allow to draw Previous day High/Low Previous week High/Low
Congifuration High & Low for: Previous day, week Line Style, color Label position, size, color Any questions or comments, send me a direct message here https://www.mql5.com/en/users/mvonline
FREE

VM Breakout BB: Indicatore di breakout basato sulla probabilità con Bande di Bollinger VM Breakout BB è un indicatore di rilevamento dei breakout basato sulle Bande di Bollinger combinato con analisi statistica della probabilità (Z-score e funzione di distribuzione cumulativa normale, CDF) e filtri di conferma intelligenti quali RSI, ADX e Volume SMA. L’indicatore mira a fornire segnali con una chiara base statistica, ridurre il rumore e confermare breakout con maggiore probabilità di successo.
FREE
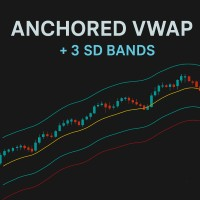
VWAP Ancorato (AVWAP) con Bande di Deviazione Standard – MT5 Porta il tuo trading al livello successivo con VWAP ancorati precisi, arricchiti da bande dinamiche di deviazione standard. Progettato per trader che richiedono velocità, chiarezza e informazioni operative sul mercato. Caratteristiche principali: Molteplici ancore: Aggiungi VWAP illimitati con date e orari di inizio personalizzati. Bande Std Dev avanzate: Fino a 3 bande per VWAP con moltiplicatori completamente regolabili per un’analis
FREE

Product: Phantom Shadow Reversal Engine Version: 3.0 (Elite Edition) Developer: Trade With Thangam
THE ULTIMATE SCALPING TOOL FOR XAUUSD & MAJOR PAIRS
The Phantom Shadow Reversal Engine is not just another indicator; it is a complete trading system designed for precision scalping and day trading.
Instead of relying on lagging signals, this system uses a "Proprietary Shadow Engine" that analyzes Market
FREE

Time Session OPEN-HIGH-LOW-CLOSE This Indicator Will Draw Lines Of OHLC Levels Of Time Session Defined By User. It Will Plot Floating Lines On Current Day Chart. Time Session Can Of Current Day Or Previous Day. You Can Plot Multiple Session Lines By Giving Unique ID To Each Session. It Can Even Show Historical Levels Of Time Session Selected By User On Chart To Do Backdating Test. You Can Write Text To Describe The Lines.
FREE

A simple indicator that automatically highlights all FVGs (Fair Value Gaps) formed on the chart, as well as FVGs on history. It is possible to select colors for FVGs of different directions (long or short), select the time interval, select the color of middle point and you can also choose whether to delete filled FVGs or leave them on the chart (the option is beneficial for backtesting). The indicator can be very useful for those, who trade according to the concept of smart money, ICT, or simply
FREE
Sai perché MetaTrader Market è il posto migliore per vendere strategie di trading e indicatori tecnici? Non c'è bisogno di pubblicità o di protezione del software, nessun problema di pagamento. Tutto ciò è fornito da MetaTrader Market.
Ti stai perdendo delle opportunità di trading:
- App di trading gratuite
- Oltre 8.000 segnali per il copy trading
- Notizie economiche per esplorare i mercati finanziari
Registrazione
Accedi
Se non hai un account, registrati
Consenti l'uso dei cookie per accedere al sito MQL5.com.
Abilita le impostazioni necessarie nel browser, altrimenti non sarà possibile accedere.