Historical Similarity Matcher

Historical Similarity Matcher Indicator


Overview

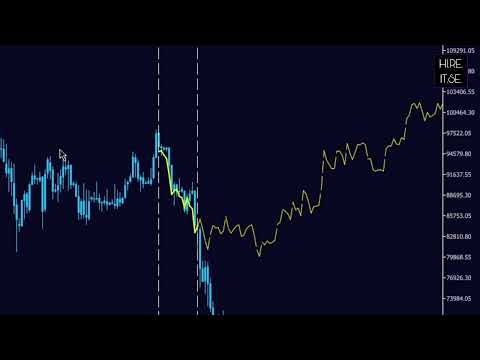
The Historical Similarity Matcher is a technical analysis indicator for MetaTrader 5. It scans historical price data to find segments that show statistical similarity to a user-selected reference period on the chart. When matches are found, the indicator displays the historical patterns and draws projections of potential future price movement based on how those historical segments continued.

This indicator is provided for educational and analytical purposes only. It does not constitute financial, investment, or trading advice. There are no guarantees of results or profitability. Past performance is not indicative of future results. Trading involves substantial risk of loss. Users are solely responsible for their own trading decisions and outcomes.
---------------------------------------------------------------------------------------------------------------------------------------------------


Features

- Identifies historical price segments with correlation to the selected reference period
- Supports direct and inverse pattern matching
- Displays multiple matching historical patterns (up to a configurable number)
- Draws individual projection lines for each match based on historical continuations
- Optional OpenCL support for faster calculation on compatible hardware (falls back to CPU if not available)
- Works on any timeframe and symbol
- Allows scanning on a different timeframe than the current chart
- Provides buttons on the chart for starting the scan and exporting results
- Exports screenshots of each match and a CSV file with match details
---------------------------------------------------------------------------------------------------------------------------------------------------


How It Works

1. The user selects a reference period by placing two vertical lines on the chart or by setting dates in the inputs.
2. The “SCAN” button starts the analysis.
3. The indicator compares the reference period to historical segments using Pearson correlation on logarithmic returns.
4. Matches are ranked by correlation strength and filtered according to user settings.
5. For each displayed match:
   - The historical pattern is overlaid on the reference period (yellow lines).
   - A projection line is drawn forward from the current bar, scaled to current price levels.
6. Match information (date and correlation) is shown on the chart.
---------------------------------------------------------------------------------------------------------------------------------------------------


 Input Parameters

Time Range Settings
- UseAutoBars: Adjust vertical lines automatically when changing timeframe
- init_start_date: Start date of reference period
- init_end_date: End date of reference period

Match Filtering
- MinCorrelation: Minimum correlation threshold (default: 0.1)
- MaxCorrelation: Maximum correlation threshold (default: 1.0)
- num_matches: Maximum number of matches to display (default: 10)
- MinBarDistance: Minimum distance in bars between matches (default: 10)

Pattern Options
- InvertIfNegative: Include inverse patterns (default: true)

Visualization
- ProjectionFutureBars: Number of bars to project forward (default: 100)
- show_match: Display overlaid historical patterns (default: true)

Multi-Timeframe
- Scan_Timeframe: Timeframe used for scanning (default: current chart timeframe)

 Visual Settings
- start_line_color: Color of the start vertical line
- end_line_color: Color of the end vertical line
---------------------------------------------------------------------------------------------------------------------------------------------------


 How to Use

1. Attach the indicator to a chart.
2. Set the reference period using the vertical lines or date inputs.
3. Click the “SCAN” button.
4. Review the displayed matches and projections.
5. (Optional) Click the “CAPTURE” button to save screenshots and a CSV file to the MQL5/Files folder.
---------------------------------------------------------------------------------------------------------------------------------------------------

Interpretation

Correlation values range from -1 to +1 (absolute value indicates strength):
- 0.9–1.0: Very strong similarity
- 0.7–0.9: Strong similarity
- 0.5–0.7: Moderate similarity
- 0.3–0.5: Weak similarity
- Negative values indicate inverse movement
---------------------------------------------------------------------------------------------------------------------------------------------------


Limitations

- Historical similarity does not predict future price movement.
- Markets change over time; past patterns may not repeat under current conditions.
- Unexpected events can invalidate any analysis.
- The indicator should be used together with other forms of analysis and proper risk management.
---------------------------------------------------------------------------------------------------------------------------------------------------


Technical Information

- Compatibility: MetaTrader 5 (build 3661 and later)
- Supported instruments: Any symbol
- Supported timeframes: All standard timeframes
- Author: GEORGE
---------------------------------------------------------------------------------------------------------------------------------------------------

This indicator is intended only for personal analytical and educational use. Trading carries significant risk. Users must conduct their own research and are fully responsible for all trading decisions and outcomes.

© 2026 GEORGE. All rights reserved. For personal analytical and educational use only.
Prodotti consigliati
Owl Smart Levels MT5
Sergey Ermolov
4.03 (32)
Versione MT4  |  FAQ L' indicatore Owl Smart Levels è un sistema di trading completo all'interno dell'unico indicatore che include strumenti di analisi di mercato popolari come i frattali avanzati di Bill Williams , Valable ZigZag che costruisce la corretta struttura a onde del mercato, e i livelli di Fibonacci che segnano i livelli esatti di entrata nel mercato e luoghi per prendere profitti. Descrizione dettagliata della strategia Istruzioni per lavorare con l'indicatore Consulente-assistente
Enhanced Candlestick DCA EA - Professional Trading Strategy Description The Enhanced Candlestick DCA EA is a sophisticated multi-strategy trading system that combines Japanese candlestick pattern analysis with advanced Dollar Cost Averaging (DCA) position management. Developed with both safety and profitability in mind, this EA dynamically adapts to changing market conditions through its intelligent entry system and comprehensive risk management framework. Key Features Entry System Candlestick P
Supply Demand Ranger
Krzysztof Janusz Stankiewic
5 (4)
The indicator draws supply and demand zones. The zone timeframe can be set independently of the chart timeframe. For instance, it is possible to set M5 zones on an H4 chart. The importance of zones can be adjusted using the zone strength parameter. Demand zones are displayed if at least one candle in the range of the zone is entirely above the zone. Similarly, supply zones are displayed if at least one candle within the zone is entirely below the zone.
TREND REVERTING PRO A Forex Indicator for Traders Who Want   Real, Reliable Signals - Not Market Noise. Most indicators don’t fail because they lack signals - they fail because they generate   false signals in ranging or choppy markets . Trend Reverting PRO  was built specifically to solve this:   Filters market noise   and reduces false entries Works in   real market conditions Shows signals   only on valid setups This tool doesn’t predict the future - it helps you   react correc
Outside Day Reversal EA
Munkh Od Jargalsaikhan
Outside day trading strategy looks for a specific pattern in the price chart of a security. The pattern is characterized by a larger range than the previous day, with the high of the day higher than the previous day's high and the low of the day lower than the previous day's low. Works with many symbols, such as BTCUSD, GBPUSD,USDCAD, oil, gas, and others. PLEASE RATE! Thank you very much! FEATURES: - Real Strategy - Daily Bar Strategy - Exit the trade if the day was profitable - ATR multiple s
FREE
WanaScalper
Isaac Wanasolo
1 (1)
A scalping indicator based on mathematical patterns, which on average gives signals with relatively small SL, and also occasionally helps to catch big moves in the markets (more information in the video) This indicator has three main types of notifications: The first type warns of a possible/upcoming signal on the next bar The second type indicates the presence of a ready signal to enter the market/open a position The third type is for SL and TP levels - you will be notified every time price re
Strumenti per il guadagno e la ricerca. Il nucleo dei segnali e della strategia di trading si basa sull'algoritmo dell'autore per la formazione di modelli di previsione dei prezzi. Applicabile a qualsiasi strumento! Integrato con un sistema di controllo basato sull'MA "Volpe a nove code" , aggiornando e regolando il segnale nel modo più accurato possibile per il mercato, lo strumento e il periodo di lavoro. Idoneo: tutti gli strumenti in tutti i mercati (ci sono eccezioni). A chi è rivolto: h
QUANTFUSION BTC — PROFESSIONAL SMART MONEY INDICATOR   PREMIUM BITCOIN TRADING SYSTEM — SMART MONEY DETECTION   QuantFusion BTC is an advanced technical indicator, specifically designed and  o ptimized for Bitcoin/USD trading. It integrates institutional Smart Money   Concepts with sophisticated multi‑timeframe analysis to identify high‑probability  trading opportunities.      KEY FEATURES      KURISKO 4‑STOCHASTIC SYSTEM      •
L'indicatore costruisce le quotazioni attuali, che possono essere confrontate con quelle storiche e su questa base fanno una previsione del movimento dei prezzi. L'indicatore ha un campo di testo per una rapida navigazione fino alla data desiderata. Opzioni: Simbolo - selezione del simbolo che visualizzerà l'indicatore; SymbolPeriod - selezione del periodo da cui l'indicatore prenderà i dati; IndicatorColor - colore dell'indicatore; HorisontalShift - spostamento delle virgolette disegnate d
AW Candle Patterns
AW Trading Software Limited
L'indicatore AW Candle Patterns è una combinazione di un indicatore di tendenza avanzato combinato con un potente scanner di modelli di candele. È uno strumento utile per riconoscere ed evidenziare i trenta modelli di candele più affidabili. Inoltre, è un analizzatore di trend attuale basato su barre colorate con a       pannello di trend multi-timeframe plug-in che può essere ridimensionato e posizionato. Una capacità unica di regolare la visualizzazione dei modelli in base al filtraggio delle
New Product Description for MadoCryptoXPro --- MadoCryptoXPro — The Smartest Crypto Warrior ️ Battle-tested on BTC & ETH. Built for real-time chaos. --- MadoCryptoXPro isn’t just another technical bot. It’s a battlefield machine designed to handle the madness of BTCUSD and ETHUSD with surgical precision. Whether the market is flat, trending, or just plain psycho — it stays focused, adapts fast, and protects your capital like a vault guard on Red Bull. --- Core Features: Smart
TradeForge AlphaGain AI
Akshay Chunilal Patil
AlphaGain AI – Trading preciso con intelligenza artificiale avanzata AlphaGain AI è un Expert Advisor (EA) per MetaTrader 5 ad alte prestazioni, alimentato da AI e dati storici per generare segnali di qualità, adatti a trader che desiderano risultati costanti e automatizzati. Caratteristiche principali: Motore IA: rileva configurazioni candlestick, zone di volatilità, logica di momentum; Addestrato su oltre 10 anni di dati; Strategia dinamica di entrata/uscita: SL/TP, trailing stop, pun
Fractal 358 Plus
Renato Fridschtein
Fractal 358 Plus is a predictive indicator that provides the clearest sight of price movements. Identifying graphic patterns such as Caixote (Crate), Pivot and Inside Candle , it shows entries and exits spots, as well as threats to your trades in the markets. It comes ready to use with B3 Mini Index (WIN$ series) and can be adjusted to use with any asset and timeframe. Fractal 358 unravels price movement Based on the Fibonacci sequence, Fractal 358 is a new and different way of reading and und
ICT Order Blocks Premium Indicator Professional Market Structure Analysis Based on ICT Methodology OrderBlocks ICT   is an advanced technical analysis tool that identifies high-probability trading zones based on the Inner Circle Trader (ICT) methodology. This professional-grade indicator detects key market turning points using institutional order block analysis, revealing where smart money is likely accumulating positions. Key Features: Smart Filtering Technology : Eliminates weak and insignific
Price reach indicator. It also serves as the perfect term for supports and resistance. I use it in two experts. The basic tool for professional trading. The indicator analyzes the last 500 bar and uses this to determine the levels ( but it doesn't predict the future ) . Personally, I use it on TF H1.  It is very simple. Four lines on chart and that's all. Only two input parameters.  Thousands of indicators. Why this? Is good ? No! Is very good. Please test the indicator prior to purchasing. You
An indicator for accurately determining price reversal points on all timeframes and all currency pairs. With the help of technical analysis of the market and mathematical diagnostic models, this indicator determines the price reversal points and the current trend direction with great efficiency. The indicator displays this information on the chart in the form of arrows and lines. The arrows show the trend reversal points and the lines show the current trend direction. INDICATOR trades in real t
Elite Harmony Signals Pro Panoramica Elite Harmony Signals è un indicatore sofisticato di analisi tecnica che visualizza rettangoli dinamici che forniscono zone di trading chiare e segnali di conferma per decisioni migliorate. Caratteristiche Principali Zone Rettangolo Dinamiche Estensione in Tempo Reale : I rettangoli si estendono automaticamente all'azione corrente del prezzo Chiusura Intelligente : I rettangoli si chiudono solo quando appaiono segnali opposti Conferma Visiva : Zone di trading
Candle Pattern Finder MT5
Pavel Zamoshnikov
4.2 (5)
This indicator searches for candlestick patterns. Its operation principle is based on Candlestick Charting Explained: Timeless Techniques for Trading Stocks and Futures by Gregory L. Morris. If a pattern is detected, the indicator displays a message at a bar closure. If you trade using the MetaTrader 4 terminal, then you can download the full analogue of the " Candle Pattern Finder for MT4 " indicator It recognizes the following patterns: Bullish/Bearish (possible settings in brackets) : Hammer
Click2FiboDrawer – Instantly Draw Fibonacci Retracement Lines with 2 Clicks Click2FiboDrawer is a powerful manual drawing tool for discretionary traders who use Fibonacci retracements in their technical analysis. With just two mouse clicks, you can draw clean and precise Fibonacci levels directly on your chart — no clutter, no menus, no hassle. Even during fast-paced scalping sessions, this tool enables you to quickly add Fibonacci retracement levels and react to market moves in real-time. It’s
The Binary Tend Follower indicator has been designed especially for Binary options trading. The best time frame to use the indicator on is a 1M chart with 1Min expiry's as soon as the signal candle closes. There is no need to over complicate your trading as all the thinking has been done for you. The indicator was designed as simple as possible to take out all the subjectivity of trying to follow a complicated strategy, and allowing the trader to focus on extremely simple entry's.  Buy: When the
Engulfing RSI
Mykhailo Zakervashevych
Engulfing RSI Indicator Category:   Multi-Timeframe, Candlestick Pattern Confirmation Overview: The Engulfing RSI is a powerful confluence tool that combines the classic candlestick reversal pattern (Bullish or Bearish Engulfing) with the momentum readings of the Relative Strength Index (RSI). It doesn't just show the pattern; it validates it with overbought/oversold context, filtering out weak signals and highlighting higher-probability trade setups. Core Logic: The indicator scans for Engulf
Terra Infinity is a flat indicator. This improved version of the CalcFlat indicator has three additional lines that significantly increase its effectiveness. Unlike its predecessor with two static levels, Terra Infinity adds three dynamic lines above the main histogram, which are interpreted as follows: base signal line, minimum signal line, maximum signal line. These lines are formed using the additional parameter Avg, which is the average value of the histogram. Averaging produces a line cl
The indicator detects divergence signals - the divergences between the price peaks and the MACD oscillator values. The signals are displayed as arrows in the additional window and are maintained by the messages in a pop-up window, e-mails and push-notifications. The conditions which formed the signal are displayed by lines on the chart and in the indicator window. The indicator parameters MacdFast - fast MACD line period MacdSlow - slow MACD line period MacdSignal - MACD signal line period Macd
Trend Monitor MT5
Pavel Zamoshnikov
4.5 (2)
The indicator generates early signals basing on ADX reading data combined with elements of price patterns. Works on all symbols and timeframes. The indicator does not redraw its signals. You see the same things on history and in real time. For better visual perception signals are displayed as arrows (in order not to overload the chart). Features The best results are obtained when the indicator works on two timeframes. For example: M30 – the indicator shows the main trend; M5 – the indicator gen
Bober Real MT5
Arnold Bobrinskii
4.76 (17)
Bober Real MT5 is a fully automatic Forex trading Expert Advisor. This robot was made in 2014 year and did a lot of profitbale trades during this period. So far over 7000% growth on my personal account. There was many updates but 2019 update is the best one. The robot can run on any instrument, but the results are better with EURGBP, GBPUSD, on the M5 timeframe. Robot doesn't show good results in tester or live account if you run incorrect sets. Set files for Live accounts availible only for cu
Smart FVG indicator
Ahmad Kazbar
5 (10)
Smart FVG Indicator MT5 – Rilevamento di Fair Value Gap e Imbalance in MetaTrader 5 Il Smart FVG Indicator MT5 è uno strumento professionale per identificare aree di Fair Value Gap (FVG) e Imbalance direttamente sui grafici di MetaTrader 5 . Progettato per i trader che utilizzano i Smart Money Concepts (SMC) e l’analisi ICT , aiuta a comprendere la struttura del mercato e la liquidità. L’indicatore analizza automaticamente l’azione dei prezzi per rilevare zone valide di FVG e Imbalance, aggiorna
FREE
Trend reversal identification: The K-line countdown indicator helps traders capture trend reversal signals by identifying excessive buying and selling behavior in the market. This indicator is particularly effective when the market is in extreme states. Risk management: This indicator can help traders identify potential risks in the market before the trend reverses and adjust positions in time to avoid losses. For example, you might consider reducing your long position when a bullish countdown c
Universal Soul Reaper
Pieter Gerhardus Van Zyl
Universal Soul Reaper is an atmospheric market-flow oscillator designed to interpret price behavior as a cycle of spiritual energy. Instead of reacting to raw price alone, it visualizes the state of the market’s soul —revealing when momentum is awakening, stabilizing, or fading. The indicator operates in a separate window and presents three interwoven entities: the Ectoplasmic Veil , the Spirit Boundary , and the Soul Core . Together, they form a living framework that helps traders sense pressu
VSA target
Evgenii Bazhenov
Obiettivo VSA L'indicatore identifica un acquirente professionista o un venditore professionista sul grafico utilizzando il sistema VSA (Volume Spread Analysis) e costruisce una zona di supporto alla tendenza rispetto a queste barre (Candele) e ai livelli target.  Comportamento: 1. In questo indicatore, è possibile scegliere la modalità in cui verrà determinato solo l'acquirente professionista o il venditore professionista e entrambi i partecipanti professionali saranno determinati contemporane
Overview Heiken Ashi CE Filtered MT5 is a technical indicator for the MetaTrader 5 platform. It integrates smoothed candlestick charting with a dynamic exit strategy and a customizable trend filter to deliver clear buy and sell signals. The indicator is designed to improve trend detection and signal reliability by reducing market noise. If you want to see more high-quality products or order the development/conversion of your own products, visit my partners' website: 4xDev Get 10% OFF on manual
Gli utenti di questo prodotto hanno anche acquistato
SuperScalp Pro
Van Minh Nguyen
5 (2)
SuperScalp Pro – Sistema avanzato di indicatore per scalping con filtri multipli SuperScalp Pro è un sistema avanzato di indicatore per scalping che combina il classico Supertrend con molteplici filtri di conferma intelligenti. L’indicatore funziona in modo efficiente su tutti i timeframe da M1 a H4 ed è particolarmente adatto per XAUUSD, BTCUSD e le principali coppie Forex. Può essere utilizzato come sistema stand-alone o integrato in modo flessibile nelle strategie di trading esistenti. L’indi
Se acquisti questo indicatore, riceverai il mio Trade Manager Professionale + EA  GRATUITAMENTE. Innanzitutto è importante sottolineare che questo sistema di trading è un indicatore Non-Repainting, Non-Redrawing e Non-Lagging, il che lo rende ideale sia per il trading manuale che per quello automatico. Corso online, manuale e download di preset. Il "Sistema di Trading Smart Trend MT5" è una soluzione completa pensata sia per i trader principianti che per quelli esperti. Combina oltre 10 indicat
ARIPoint
Temirlan Kdyrkhan
ARIPoint is a powerful trading companion designed to generate high-probability entry signals with dynamic TP/SL/DP levels based on volatility. Built-in performance tracking shows win/loss stats, PP1/PP2 hits, and success rates all updated live. Key Features: Buy/Sell signals with adaptive volatility bands Real-time TP/SL/DP levels based on ATR Built-in MA Filter with optional ATR/StdDev volatility Performance stats panel (Success, Profit/Loss, PP1/PP2) Alerts via popup, sound, push, or email Cu
FX Trend MT5 NG
Daniel Stein
5 (1)
FX Trend NG: La Nuova Generazione di Intelligenza di Trend Multi-Mercato Panoramica FX Trend NG è uno strumento professionale di analisi del trend multi-timeframe e monitoraggio dei mercati. Ti consente di comprendere la struttura completa del mercato in pochi secondi. Invece di passare tra numerosi grafici, puoi identificare immediatamente quali strumenti sono in trend, dove il momentum sta diminuendo e dove esiste un forte allineamento tra i timeframe. Offerta di Lancio – Ottieni FX Trend NG
Azimuth Pro
Ottaviano De Cicco
5 (4)
LAUNCH PROMO Azimuth Pro price is initially set at 299$ for the first 100 buyers. Final price will be 499$ . THE DIFFERENCE BETWEEN RETAIL AND INSTITUTIONAL ENTRIES ISN'T THE INDICATOR — IT'S THE LOCATION. Most traders enter at arbitrary price levels, chasing momentum or reacting to lagging signals. Institutions wait for price to reach structured levels where supply and demand actually shift. Azimuth Pro maps these levels automatically: swing-anchored VWAP, multi-timeframe structure lines, an
Entry In The Zone and SMC Multi Timeframe is a real-time market analysis tool developed based on Smart Money Concepts (SMC). It is designed to analyze market structure, price direction, reversal points, and key zones across multiple timeframes in a systematic way. The system displays Points of Interest (POI) and real-time No Repaint signals, with instant alerts when price reaches key zones or when signals occur within those zones. It functions as both an Indicator and a Signal System (2-in-1), c
Divergence Bomber
Ihor Otkydach
4.89 (81)
Ogni acquirente dell’indicatore riceverà inoltre gratuitamente: L’utilità esclusiva “Bomber Utility”, che gestisce automaticamente ogni operazione, imposta i livelli di Stop Loss e Take Profit e chiude le posizioni secondo le regole della strategia I file di configurazione (set file) per adattare l’indicatore a diversi asset I set file per configurare il Bomber Utility in tre modalità: “Rischio Minimo”, “Rischio Bilanciato” e “Strategia di Attesa” Una guida video passo-passo per installare, conf
Power Candles MT5
Daniel Stein
5 (6)
Power Candles – Segnali di ingresso basati sulla forza per tutti i mercati Power Candles porta l’analisi di forza collaudata di Stein Investments direttamente sul grafico dei prezzi. Invece di reagire solo al prezzo, ogni candela viene colorata in base alla reale forza di mercato, consentendo di identificare immediatamente accumuli di momentum, accelerazioni della forza e transizioni di trend pulite. Un’unica logica per tutti i mercati Power Candles funziona automaticamente su tutti i simboli di
FX Power MT5 NG
Daniel Stein
5 (31)
FX Power: Analizza la Forza delle Valute per Decisioni di Trading Più Intelligenti Panoramica FX Power è lo strumento essenziale per comprendere la reale forza delle principali valute e dell'oro in qualsiasi condizione di mercato. Identificando le valute forti da comprare e quelle deboli da vendere, FX Power semplifica le decisioni di trading e rivela opportunità ad alta probabilità. Che tu segua le tendenze o anticipi inversioni utilizzando valori estremi di Delta, questo strumento si adatta
Atomic Analyst MT5
Issam Kassas
4.07 (28)
Innanzitutto, vale la pena sottolineare che questo indicatore di trading non è repaint, non è ridisegno e non presenta ritardi, il che lo rende ideale sia per il trading manuale che per quello automatico. Manuale utente: impostazioni, input e strategia. L'Analista Atomico è un indicatore di azione del prezzo PA che utilizza la forza e il momentum del prezzo per trovare un miglior vantaggio sul mercato. Dotato di filtri avanzati che aiutano a rimuovere rumori e segnali falsi, e aumentare il pote
Top indicator for MT5   providing accurate signals to enter a trade without repainting! It can be applied to any financial assets:   forex, cryptocurrencies, metals, stocks, indices .  Watch  the video  (6:22) with an example of processing only one signal that paid off the indicator! MT4 version is here It will provide pretty accurate trading signals and tell you when it's best to open a trade and close it. Most traders improve their trading results during the first trading week with the help of
Ogni giorno, molti trader affrontano una sfida comune: il prezzo sembra rompere un livello chiave, entrano in un'operazione, e poi il mercato si inverte, attivando il loro stop loss. Questo è noto come falsa rottura (false breakout) — un movimento di prezzo che supera brevemente un livello di supporto o resistenza prima di invertire la direzione. Questi movimenti possono causare l'attivazione degli stop loss prima che la direzione effettiva del prezzo diventi chiara. Nell'analisi tecnica, questo
Trend Screener Pro MT5
STE S.S.COMPANY
4.84 (100)
Indicatore di tendenza, soluzione unica rivoluzionaria per il trading di tendenze e il filtraggio con tutte le importanti funzionalità di tendenza integrate in un unico strumento! È un indicatore multi-timeframe e multi-valuta al 100% non ridipingibile che può essere utilizzato su tutti i simboli/strumenti: forex, materie prime, criptovalute, indici e azioni. Trend Screener è un indicatore di tendenza che segue un indicatore efficiente che fornisce segnali di tendenza a freccia con punti nel gra
L'indicatore " Dynamic Scalper System MT5 " è progettato per il metodo di scalping, ovvero per il trading all'interno di onde di trend. Testato sulle principali coppie di valute e sull'oro, è compatibile con altri strumenti di trading. Fornisce segnali per l'apertura di posizioni a breve termine lungo il trend, con ulteriore supporto al movimento dei prezzi. Il principio dell'indicatore. Le frecce grandi determinano la direzione del trend. Un algoritmo per generare segnali per lo scalping sott
L’indicatore evidenzia le zone in cui viene dichiarato interesse sul mercato , per poi mostrare la zona di accumulo degli ordini . Funziona come un book degli ordini su larga scala . Questo è l’indicatore per i grandi capitali . Le sue prestazioni sono eccezionali. Qualsiasi interesse ci sia nel mercato, lo vedrai chiaramente . (Questa è una versione completamente riscritta e automatizzata – non è più necessaria un’analisi manuale.) La velocità di transazione è un indicatore concettualmente nuo
Super Signal – Skyblade Edition Sistema professionale di segnali di tendenza senza repaint / senza ritardo con tasso di vincita eccezionale | Per MT4 / MT5 Funziona meglio su timeframe più bassi, come 1 minuto, 5 minuti e 15 minuti. Caratteristiche principali: Super Signal – Skyblade Edition è un sistema intelligente di segnali progettato specificamente per il trading di tendenza. Utilizza una logica di filtraggio multilivello per identificare esclusivamente i movimenti direzionali forti, supp
Grabber System MT5
Ihor Otkydach
4.82 (22)
Ti presento un eccellente indicatore tecnico: Grabber, che funziona come una strategia di trading "tutto incluso", pronta all’uso. In un solo codice sono integrati strumenti potenti per l’analisi tecnica del mercato, segnali di trading (frecce), funzioni di allerta e notifiche push. Ogni acquirente di questo indicatore riceve anche gratuitamente: L’utility Grabber: per la gestione automatica degli ordini aperti Video tutorial passo dopo passo: per imparare a installare, configurare e utilizzare
Smart Stop Indicator – Precisione intelligente dello stop-loss direttamente sul grafico Panoramica Smart Stop Indicator è la soluzione ideale per i trader che desiderano posizionare il loro stop-loss in modo chiaro e metodico, senza dover indovinare o affidarsi all’intuizione. Questo strumento combina la logica classica del price action (massimi e minimi strutturali) con un moderno riconoscimento dei breakout per identificare il prossimo livello di stop realmente logico. In trend, in range o i
Quantum TrendPulse
Bogdan Ion Puscasu
5 (20)
Ecco   Quantum TrendPulse   , lo strumento di trading definitivo che combina la potenza di   SuperTrend   ,   RSI   e   Stocastico   in un unico indicatore completo per massimizzare il tuo potenziale di trading. Progettato per i trader che cercano precisione ed efficienza, questo indicatore ti aiuta a identificare con sicurezza le tendenze di mercato, i cambiamenti di momentum e i punti di entrata e uscita ottimali. Caratteristiche principali: Integrazione SuperTrend:   segui facilmente l'andame
Quantum Entry   è un potente sistema di trading basato sull'azione del prezzo, costruito su una delle strategie più popolari e conosciute tra i trader: la strategia di   Breakout ! Questo indicatore genera segnali di acquisto e vendita chiari e cristallini basati sulla rottura di aree chiave di supporto e resistenza. A differenza dei tipici indicatori di breakout, utilizza calcoli avanzati per confermare con precisione la rottura! Quando si verifica una rottura, ricevi avvisi immediati. Nessun r
FX Levels MT5
Daniel Stein
5 (13)
FX Levels: Supporti e Resistenze di Precisione Eccezionale per Tutti i Mercati Panoramica Rapida Cercate un modo affidabile per individuare livelli di supporto e resistenza in ogni mercato—coppie di valute, indici, azioni o materie prime? FX Levels fonde il metodo tradizionale “Lighthouse” con un approccio dinamico all’avanguardia, offrendo una precisione quasi universale. Basato sulla nostra esperienza reale con i broker e su aggiornamenti automatici giornalieri più quelli in tempo reale, FX
Bill Williams Advanced
Siarhei Vashchylka
5 (10)
Bill Williams Advanced is designed for automatic chart analysis using Bill Williams' "Profitunity" system. The indicator analyzes four timeframes at once. Manual (Be sure to read before purchasing) Advantages 1. Analyzes the chart using Bill Williams' "Profitunity" system. Signals are displayed in a table in the corner of the screen and on the price chart. 2. Finds all known AO and AC signals, as well as zone signals. Equipped with a trend filter based on the Alligator. 3. Finds "Divergence Bar
Support And Resistance Screener è in un indicatore di livello per MetaTrader che fornisce più strumenti all'interno di un indicatore. Gli strumenti disponibili sono: 1. Screener della struttura del mercato. 2. Zona di ritiro rialzista. 3. Zona di ritiro ribassista. 4. Punti pivot giornalieri 5. Punti pivot settimanali 6. Punti pivot mensili 7. Forte supporto e resistenza basati sul modello e sul volume armonici. 8. Zone a livello di banca. OFFERTA A TEMPO LIMITATO: il supporto HV e l'indicatore
Trend indicator AI mt5
Ramil Minniakhmetov
5 (15)
Trend Ai indicator è un ottimo strumento che migliorerà l'analisi di mercato di un trader combinando l'identificazione della tendenza con punti di ingresso utilizzabili e avvisi di inversione. Questo indicatore consente agli utenti di navigare nelle complessità del mercato forex con fiducia e precisione Oltre ai segnali primari, l'indicatore Ai di tendenza identifica i punti di ingresso secondari che si presentano durante i pullback o i ritracciamenti, consentendo ai trader di capitalizzare le
Questo cruscotto mostra gli ultimi   pattern armonici   disponibili per i simboli selezionati, in modo da risparmiare tempo ed essere più efficienti /   versione MT4 . Indicatore gratuito:   Basic Harmonic Pattern Colonne dell'indicatore Symbol :   vengono visualizzati i simboli selezionati Trend:   rialzista o ribassista Pattern:   tipo di pattern (gartley, butterfly, bat, crab, shark, cypher o ABCD) Entry:   prezzo di ingresso SL:   prezzo di stop loss TP1:   1 prezzo di take profit TP2:
Dark Support Resistance  is an Indicator for intraday trading. This Indicator is programmed to identify  Support and Resistance Lines , providing a high level of accuracy and reliability. Key benefits Easily visible lines Only the most important levels will be displayed Automated adjustment for each timeframe and instrument Easy to use even for beginners Never repaints, never backpaints, Not Lag 100% compatible with Expert Advisor development All types of alerts available: Pop-up, Email, Push
Innanzitutto, vale la pena sottolineare che questo Strumento di Trading è un Indicatore Non-Ridipingente, Non-Ridisegnante e Non-Laggante, il che lo rende ideale per il trading professionale. Corso online, manuale utente e demo. L'Indicatore Smart Price Action Concepts è uno strumento molto potente sia per i nuovi che per i trader esperti. Racchiude più di 20 utili indicatori in uno solo, combinando idee di trading avanzate come l'Analisi del Trader del Circolo Interno e le Strategie di Tradin
[ Il mio canale ] , [ I miei prodotti ] Il Lorentzian Distance Classifier è un indicatore di trading basato sul machine learning che utilizza la distanza di Lorentz come metrica principale all’interno del framework degli Approximate Nearest Neighbors (ANN). Invece di fare affidamento sulla tradizionale distanza euclidea, tratta l’azione dei prezzi finanziari come se avvenisse in uno spazio “distorto” prezzo-tempo (simile al modo in cui gli oggetti massicci curvano lo spazio-tempo nella relativit
IX Power MT5
Daniel Stein
4.92 (12)
IX Power: Scopri approfondimenti di mercato per indici, materie prime, criptovalute e forex Panoramica IX Power è uno strumento versatile progettato per analizzare la forza di indici, materie prime, criptovalute e simboli forex. Mentre FX Power offre la massima precisione per le coppie di valute utilizzando i dati di tutte le coppie disponibili, IX Power si concentra esclusivamente sui dati di mercato del simbolo sottostante. Questo rende IX Power una scelta eccellente per mercati non correlat
Super Signal Market Slayer No repaint | Alta precisione | Indicatore di trend intelligente multi-mercato Nel trading, la vera difficoltà non è aprire un’operazione, ma riconoscere chiaramente quando un trend sta realmente iniziando. Market Slayer nasce proprio per questo. È un indicatore intelligente senza repaint, progettato specificamente per il trading intraday. Grazie a conferme multilivello e filtri di trend, fornisce segnali Buy / Sell chiari e affidabili solo nei momenti chiave. Vantaggi
Filtro:
Nessuna recensione
Rispondi alla recensione