Volume indicator
- 지표
- 버전: 1.0
- 활성화: 10

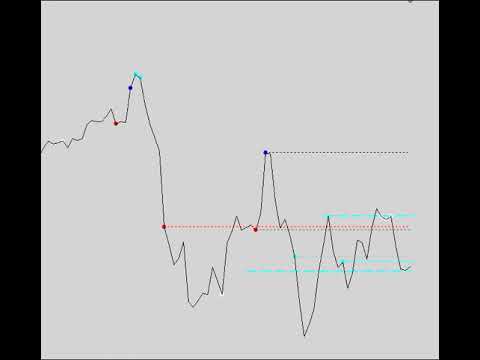
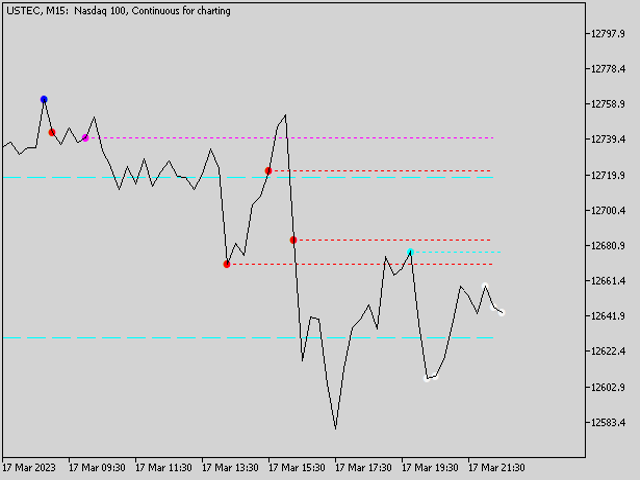
이 표시기는 두 가지 기간으로 작동하며 작업 차트에 직접 이벤트를 시각적으로 표시하고 지원/저항 수준 역할을 하는 수평 수준을 표시할 수 있습니다.
형성된 볼륨의 다른 값은 차트의 오른쪽으로 향하는 레벨이 생성되는 해당 막대에 색상 표시로 표시됩니다. 작업 차트에는 이전 기간에서 받은 수준도 표시됩니다. 수준 표시 및 해당 속성은 표시기 설정에서 설정됩니다. 된 기간의 수준은 일반적으로 더 높은 우선 순위를 갖습니다. 각 레벨에는 레벨에 대한 필수 정보가 포함된 툴팁이 있습니다. 평균 범위 값(ATR)은 실제 수준을 얻기 위해 사용됩니다. 틱 및 실제(사용 가능한 경우) 볼륨 값을 모두 사용할 수 있습니다.
거래량 지표는 "더 나은 거래량 지표"라는 지표에서 구현된 아이디어를 기반으로 합니다.
지표 알고리즘은 현재 작동하도록 조정되었으며 과거 데이터 분석을 위한 것이 아닙니다.
표시된 이벤트
- VCU - 큰 바 범위에서 볼륨 업의 절정
- VCN - 큰 바 범위에서 볼륨 클라이맥스 중립
- VCD - 큰 바 범위에서 볼륨 다운 클라이맥스
- HVC - 낮은 막대 범위의 높은 볼륨
- VCHVC - VCU, VCN, VCD의 조합
- LV - 낮은 바 볼륨
*표시기에 의해 표시되는 이벤트에 대한 자세한 설명은 원래 이름으로 공개 도메인에 있습니다.
입력 매개변수
- Volume mode: Tick / Real - 볼륨 데이터 수집 모드 선택
- Range for calculate, pcs - 계산할 막대 수
- Dot size multiplier - 레이블 크기를 변경하는 승수
- Displayed of levels for current period - 현재 기간의 레벨 표시
- Displayed of levels for high period - 이전 기간의 레벨 표시
- High period for plotting - 건물 수준의 시니어 기간
- Number of displayed levels, pcs - 표시된 레벨 수
- Style of Current period lines - 현재 기간 레벨 스타일
- Style of High period lines - 시니어 레벨 스타일
- Line for VCU, VCN, VCD, HVC, VCHVC, LV true:ON / false:OFF - 레벨 표시
- Color of VCU, VCN, VCD, HVC, VCHVC, LV mark - 라벨 색상
- Period for ATR calculate - 평균 범위(ATR) 계산 기간
- Bars for ATR calculate - 평균 범위(ATR)를 계산하기 위한 막대 수