• Aperçu
  • Avis
  • Commentaires

Volume indicator

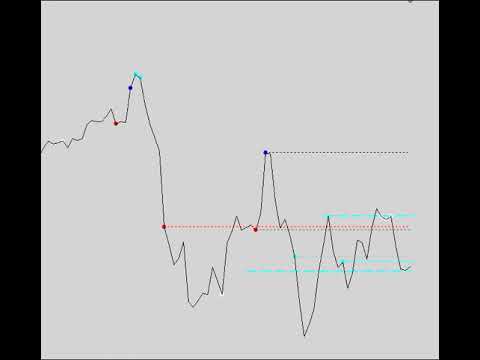
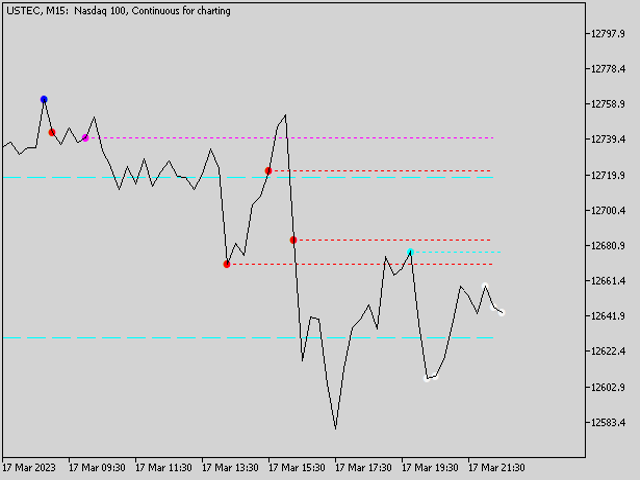
L'indicateur fonctionne avec deux périodes de temps, a un affichage visuel des événements directement sur le graphique de travail et est capable d'afficher des niveaux horizontaux qui servent de niveaux de support/résistance.

Différentes valeurs de volumes formés sont affichées sous forme de marque colorée sur la barre correspondante, à partir de laquelle les niveaux sont construits, dirigés vers le côté droit du graphique. Sur le graphique de travail, les niveaux reçus de la période plus ancienne sont également affichés. L'affichage des niveaux et leurs propriétés sont définis dans les paramètres de l'indicateur. Les niveaux de la période de temps qui est devenue, ont généralement une priorité plus élevée. Chaque niveau a une info-bulle contenant les informations nécessaires sur le niveau. La valeur moyenne de la plage (ATR) est utilisée pour obtenir les niveaux réels. Il est possible d'utiliser à la fois les valeurs de volume tick et réel (si disponible).

L'indicateur de volume est basé sur l'idée mise en œuvre dans l'indicateur « Le meilleur indicateur de volume ».

L'algorithme de l'indicateur est adapté pour fonctionner au moment présent et n'est pas destiné à l'analyse des données historiques.


Événements affichés

  • VCU - point culminant du volume sur une large gamme de barres
  • VCN - volume climax neutre sur une large gamme de barres
  • VCD - point culminant de réduction du volume sur une large gamme de barres
  • HVC - volume élevé sur la gamme de barres basses
  • VCHVC - Combinaison de VCU, VCN, VCD
  • LV - faible volume de barre

*une description plus détaillée des événements affichés par l'indicateur est dans le domaine public sous le nom d'origine.


Paramètres d'entrée

  • Volume mode: Tick / Real - sélection du mode d'acquisition des données de volume
  • Range for calculate, pcs - nombre de barres à calculer
  • Dot size multiplier - multiplicateur pour changer la taille de l'étiquette
  • Displayed of levels for current period - affichage des niveaux pour la période en cours
  • Displayed of levels for high period - affichage des niveaux pour la période la plus ancienne
  • High period for plotting - période senior pour les niveaux de construction
  • Number of displayed levels, pcs - nombre de niveaux affichés
  • Style of Current period lines - style de niveau de la période actuelle
  • Style of High period lines - style de niveau supérieur
  • Line for VCU, VCN, VCD, HVC, VCHVC, LV true:ON / false:OFF - affichage du niveau
  • Color of VCU, VCN, VCD, HVC, VCHVC, LV mark - couleur de l'étiquette
  • Period for ATR calculate - période de calcul de l'autonomie moyenne (ATR)
  • Bars for ATR calculate - nombre de barres pour calculer la plage moyenne (ATR)

Produits recommandés
Chart Walker Smart Lines (CWSL)    by Chart Walker Smart Lines is a MetaTrader 5 (MT5) indicator that revolutionizes technical analysis by offering a suite of powerful features to enhance your trading experience. This intelligent tool is designed to automate various aspects of chart analysis, providing traders with valuable insights and saving time on manual tasks. Key Features Automatic Channel Drawing: Smart Lines takes the hassle out of drawing trend channels by automatically identifying and
iVolX indicator horizontal volumes for all time periods Main settings of the indicator: VolumeSource - select data for volumes (tick or real) PeriodMinutes - selection period for rendering of volumes PeriodsNumber - number of periods to show on the chart StartDate - the start date of the calculations ClusterPoints - cluster width Color - color MaxVolColor - maximum volume color ValueArea - the value of the zone of balance ValueAreaColor - color of the balance zone MaxVolFontSize - font size Ma
Einstein Pivot Point
Luis Cesar Nunes Dos Santos
Einstein Pivot Point indicator shows you hourly, weekly or monthly pivot points and support and resistance levels. You can choose 3 different formula for the support and resistance levels (Classic Formula, Woodie Pivot Points and Fibonacci Pivot Points). Einstein Pivot Point   will automatically calculate the p ivot point   and   support  and  resistance levels  on the basis of market data. Trading requires reference points (support and resistance), which are used to determine when to enter th
L'indicateur calcule et trace automatiquement les niveaux de support et de résistance de Fibonacci - l'un des outils les plus efficaces pour l'analyse de marché. Le calcul utilise les données de prix moyennes pour la période et la période sélectionnées. Le minimum et le maximum pour cette période sont considérés comme le début et la fin du mouvement. Les niveaux de Fibonacci vous permettent de voir des points de référence potentiels, autour desquels le mouvement des prix peut ralentir ou s'inver
LevelPAttern MT5 is a technical indicator based on the daily levels and Price Action patterns. The indicator is based on the standard ZigZag indicator + reversal candlestick pattens, such as Star, Hammer (also knows as Pin bar), Engulfing and others. The indicator generates audio and text notifications when a pattern is formed and a level is touched. It also supports sending email and push notifications. Indicator operation features It is suitable for working with any CFD and FOREX trading ins
Price Statistics MT5
Miguel Antonio Rojas Martinez
This indicator works only 5 digits Brokers. It is impossible to talk about the study of the Forex market or any market without considering of that market statistics. In this case, our indicator "price statistics" we have a new way to study our chart, giving information of the price in a range of pips you want to study for example, can we know how many times the price closes or opens into spaces 10, 20, 30, 50, 100 pips or more; and know them not only in numbers but also draws this relationship a
PZ Swing Trading MT5
PZ TRADING SLU
5 (4)
Swing Trading is the first indicator designed to detect swings in the direction of the trend and possible reversal swings. It uses the baseline swing trading approach, widely described in trading literature. The indicator studies several price and time vectors to track the aggregate trend direction and detects situations in which the market is oversold or overbought and ready to correct. [ Installation Guide | Update Guide | Troubleshooting | FAQ | All Products ] Profit for market swings with
LT Rainbow Trend
Thiago Duarte
5 (1)
Do you, like me, like to trade with the trend? Then this indicator will help you! Rainbow Trend is a trend indicator, which uses several Moving Averages on the chart. It measures different trend strenght zones for different periods: very long term, long term, mid term, short term and very short term. Each zone has its color, and it is possible to have sound alert when the prices leaves a zone and enters another. Its configuration is very simple. If you find any bug or have any suggestions, co
This indicator plots in the candles the divergence found in the selected indicator and can also send a notification by email and / or to the cell phone. Works on all TIMEFRAMES. Meet Our Products   He identifies the divergences in the indicators: Relative Strength Index (RSI); Moving Average Convergence and Divergence (MACD); Volume Balance (OBV) and;. iStochastic Stochastic Oscillator  (STOCHASTIC). It is possible to choose the amplitude for checking the divergence and the indicator has
MT5 Rectangle Extender Indicator
Muhammad Shamsuddeen Muhammad
MT5 Rectangle Extender Indicator is a simple and easy tool that automatically extends any box/rectangle drawn on the chart to the right edge of the screen.  This tool can be used for easy drawing of zones and can help with determining future areas of interest on the chart once price trades back to those levels. Very suitable for supply and demand, order blocks, POI's (Points of Interest) mapping on charts. Sometimes its better to have a zone than a single price level as price can shoot above or
Binary and scalping
Justine Kelechi Ekweh
This is a trend following system for Binary options traders and forex scalpers. It is carefully crafted and recognizes periods of WATERFALL in the market and gives the trader the advantage and opportunity of riding with the momentum. It works on all timeframes and currency pairs especially high liquidity pairs. Avoid news events 15mins before and after. Always have your money management script or system in place. Tested on Deriv synthetics as well, please check screenshots. The mt4 version can b
Support & Resistance indicator is a modification of the standard Bill Williams' Fractals indicator. The indicator works on any timeframes. It displays support and resistance levels on the chart and allows setting stop loss and take profit levels (you can check the exact value by putting the mouse cursor over the level). Blue dashed lines are support level. Red dashed lines are resistance levels. If you want, you can change the style and color of these lines. If the price approaches a support lev
Nine Five Count
Alfred Mirzasalikhov
The 9-5 Count is designed to track a very powerful cycle that runs through all freely traded markets. This is not a time cycle but a price cycle. The time spent between two points is not as important as the price traveled between them. The 9-5 Count is called that because one complete upward cycle consists of measurement of 9 units plus 5 units of cycle time.   This tool takes into account price and pattern together, so it’s more than just a simple cycle. The 9-5 theory classifies market movemen
Day Trader WorkTime
Aurthur Musendame
4.91 (22)
The worktime indicator helps you identify the most important times to day to trade the currency pairs. It was created based on the ICT day trading free tutorials that are freely vailable on his youtube channel.  You can use this indicator together with my other indicators that i have shared freely with you like the true day, custom periods, daily month, weekly open lines - they together complement each other very well. Nuggets from this indicator: 1. Draws the asian session box showinng you th
FREE
FRB Candle Time
Fernando Baratieri
FRB Candle Time  Indicator showing the time left for the next candle You can edit font color and size. Very important indicator for Traders. To move time, just click on it and move the mouse to where you want to leave it. After positioning the time where you want it, click again or press "ESC" and the time will stay where you left it. Settings font color Font size Background color
Candlestick Pattern Teller
Flavio Javier Jarabeck
5 (1)
Minions Labs' Candlestick Pattern Teller It shows on your chart the names of the famous Candlesticks Patterns formations as soon as they are created and confirmed. No repainting. That way beginners and also professional traders who have difficulties in visually identifying candlestick patterns will have their analysis in a much easier format. Did you know that in general there are 3 types of individuals: Visual, Auditory, and Kinesthetic? Don't be ashamed if you cannot easily recognize Candlest
This indicator is intended for visual multicurrency analysis. It allows synchronous scrolling and analysis of a few charts simultaneously and can also be used for pairs trading. The indicator works both on Forex and on Russian FORTS market. The product has a very important property - if there are skipped bars at the symbols, the synchronism of charts on the time axis is fully preserved. Each chart point is strictly synchronous with the others on the time axis at any time frame. This is especiall
Multiple Wicks forming at OverSold & OverBought levels create Buying and Selling Pressure. This indicator tries to capture the essence of the buy and sell pressure created by those wicks. Wick pressure shows that the trend is Exhausted. Order block should display when buying or selling pressure wick. When price go inside buy order block and up to outside order block, trader should consider a buy order. If price go inside buy order block and down to outside order block, trader should consider a s
Expansoes M
Marcus Vinicius Da Silva Miranda
The M Extensions are variations of the Golden Ratio (Fibonacci Sequence). It is the World's first technique developed for Candle Projections. Advantages: Easy to plot. Candle anchoring; High and accurate precision as support and resistance; Excellent Risk x Return ratio; Works in any timeframe; Works in any asset / market.   The M Extensions are classified into: M0: Zero point (starting candle) RC: Initial candle control region M1: Extension region 1 M2: Extension region 2 M3: Extension r
FREE
MTF Candles PRO
Renato Fiche Junior
1 (2)
Tool that allows viewing candles in multiple timeframes. This way, it helps the analysis in multiple timeframes. This is another product developed by Renato Fiche Junior and available to all MetaTrader 5 users! Input Parameters - Option 1 - TimeFrame: Standard MT5 timeframe - Option 2 - Custom TimeFrame (in minutes): Or, if this value is different from zero, the timeframe will be customized. This allows you to choose timeframe other than the MT5 standard. - Total Candles: Number of candle
Tired of plotting support and resistance lines? This is a multi-timeframe indicator that detects and plots supports and resistance lines in the chart with the same precision as a human eye would. As price levels are tested over time and its importance increases, the lines become thicker and darker, making price leves easy to glance and evaluate. [ Installation Guide | Update Guide | Troubleshooting | FAQ | All Products ] Boost your technical analysis Customizable timeframe selection Read pri
The Rayol Code Hour Interval Lines indicator was  designed to assist your trading experience.  It  draws the range of hours chosen by the user directly on the chart, so that it enables traders to visualize price movements during their preferred trading hours, providing  traders a more comprehensive view of price movements and market dynamics. This indicator allows the user to choose not only the Broker's time, but also the Local time. This way, the user no longer needs to calculate local time in
FREE
Hello; Tw79 time zone pivot strategy indicator finds important breakdowns and ensures the continuity of the total profit target by maintaining the profit margin in the same direction after the breakdowns. Indicator input descriptions; Start Hours: Indicates the start and reference point. Use a number zero or one. Offset: It expresses the number of bars to be calculated after the reference. Average values are between 55-144. Number of bar: It represents the last candle to be calculated
The indicator predict the future candles direction, by scanning past candle movement. Based on the principal: “ The history repeat itself”. Programmed according to Kendall Correlation. In the settings menu, different scanning options are available. When the indicator find a match, start painting future candles from the current candle to the right, also from the current candle to the left as well, showing you the candle pattern what the actual signal is based on. The left side candle are option
Higher High Lower Low MT5
KEENBASE SOFTWARE SOLUTIONS
KT Higher High Lower Low marks the following swing points with their respective S/R levels: Higher High: The swing high made by the price that is higher than the previous high. Lower High: The swing high made by the price that is lower than the previous high. Lower Low: The swing low made by the price that is lower than the previous low.  Higher Low: The swing low made by the price that is higher than the previous low.   Features The intensity of swing high and swing low can be adjusted by cha
HoD LoD Time Price Studies
Aurthur Musendame
4.33 (3)
High of the Day and Low of the day Time and Price Fractal Studies is an indicator that will help you identify certain patterns that tend to repeat themseleves at certail times of the day or at certain prices.  It is used to study Daily Highs ad Lows in relation to time and price.  You will get to answer certail questions like: At what time of day does this market usually turn around. At what price does the market turn. Is it at round numbers etc
FREE
Swiss CandleTime
Terence Gronowski
5 (2)
Swiss CandleTime What ist CandleTime for This indicaor just displays the remaining time for a candle to build. It is best used if you trade with timframes from 3 minutes. I use it in M3 to keep postions. If I have two following red candles i usually liquidate the position. Timeframes M1 to H1 Inputs Arrow displayed => Edit your arrow string Arrow for waiting conditions => Arrow if chart is offline Text Color => color of the text Tell if there is a trend change => tells you, if the two preciding
FREE
Ice up
Ignacio Agustin Mene Franco
Ice Up. It is an indicator where it fulfills the professional function of a zigzag together with support and resistance. Perfect for grabbing long and short trends. In the new version of Ice, it improves the pivots to %100. works for all seasons It works for forex and synthetic indices, and if the broker also has crypto. works for all forex pairs and synthetic indices.
The indicator,   Support and Resistance Detect Signal   automatically detects support and resistance levels and trend lines, emitting a signal whenever the condition is met, as configured. It reads support and resistance drawn manually or automatically built into the chart by other external indicators. Note:   Support and Resistance Detect Signal   is compatible with almost all external indicators that draw on the chart, support and resistance levels, in addition to trend lines. Discover
Maximum Minimum Candle Indicator
Carlos Daniel Vazquez Rosas
5 (3)
Maximum Minimum Candle indicator  is a basic indicator (but useful) that shows the highest and lowest candle in a period of time . The indicator shows the maximum candle and the minimum candle for a defined period of time. You can choose the number of candles that make up the period The indicator will show with color points  the maximum and minimum values. A message tells you when the price reaches the maximum or minimum. Parameters number_of_candles: It is the number of candles that will b
FREE
Les acheteurs de ce produit ont également acheté
Tout d'abord, il convient de souligner que ce système de trading est un indicateur non repeint, non redessiné et non retardé, ce qui le rend idéal pour le trading manuel et automatisé. Le "Système de Trading Smart Trend MT5" est une solution de trading complète conçue pour les traders débutants et expérimentés. Il combine plus de 10 indicateurs premium et propose plus de 7 stratégies de trading robustes, ce qui en fait un choix polyvalent pour différentes conditions de marché. Stratégie de suivi
Atomic Analyst MT5
Issam Kassas
5 (12)
Tout d'abord, il convient de souligner que cet indicateur de trading n'est ni repainting, ni redrawing et ne présente aucun délai, ce qui le rend idéal à la fois pour le trading manuel et automatisé. L'Analyste Atomique est un indicateur d'action sur les prix PA qui utilise la force et le momentum du prix pour trouver un meilleur avantage sur le marché. Équipé de filtres avancés qui aident à éliminer les bruits et les faux signaux, et à augmenter le potentiel de trading. En utilisant plusieur
Quantum Trend Sniper
Bogdan Ion Puscasu
5 (37)
Présentation       Quantum Trend Sniper Indicator   , l'indicateur révolutionnaire MQL5 qui transforme la façon dont vous identifiez et négociez les inversions de tendance ! Développé par une équipe de traders expérimentés avec une expérience commerciale de plus de 13 ans,       Indicateur Quantum Trend Sniper       est conçu pour propulser votre parcours de trading vers de nouveaux sommets grâce à sa manière innovante d'identifier les inversions de tendance avec une précision extrêmement élevée
Trend Screener Pro MT5
STE S.S.COMPANY
4.87 (62)
Indicateur de tendance, solution unique révolutionnaire pour le trading et le filtrage des tendances avec toutes les fonctionnalités de tendance importantes intégrées dans un seul outil ! Il s'agit d'un indicateur multi-période et multi-devises 100 % non repeint qui peut être utilisé sur tous les symboles/instruments : forex, matières premières, crypto-monnaies, indices et actions. Trend Screener est un indicateur de suivi de tendance efficace qui fournit des signaux de tendance fléchés avec des
FX Volume MT5
Daniel Stein
4.94 (17)
Obtenez votre mise à jour quotidienne du marché avec des détails et des captures d'écran via notre Morning Briefing ici sur mql5 et sur Telegram ! FX Volume est le PREMIER et SEUL indicateur de volume qui fournit un VRAI aperçu du sentiment du marché du point de vue d'un courtier. Il fournit des informations impressionnantes sur la façon dont les acteurs institutionnels du marché, comme les courtiers, sont positionnés sur le marché des changes, bien plus rapidement que les rapports COT. Voir c
Top indicator for MT5   providing accurate signals to enter a trade without repainting! It can be applied to any financial assets:   forex, cryptocurrencies, metals, stocks, indices .  Watch  the video  (6:22) with an example of processing only one signal that paid off the indicator! MT4 version is here It will provide pretty accurate trading signals and tell you when it's best to open a trade and close it. Most traders improve their trading results during the first trading week with the help of
Tout d'abord, il convient de souligner que cet outil de trading est un indicateur non repeint, non redessiné et non retardé, ce qui le rend idéal pour le trading professionnel. L'indicateur Smart Price Action Concepts est un outil très puissant à la fois pour les nouveaux et les traders expérimentés. Il regroupe plus de 20 indicateurs utiles en un seul, combinant des idées de trading avancées telles que l'analyse du trader Inner Circle et les stratégies de trading Smart Money Concepts. Cet in
RelicusRoad Pro MT5
Relicus LLC
4.82 (22)
Maintenant 147 $ (augmentant à 499 $ après quelques mises à jour) - Comptes illimités (PCS ou Mac) Manuel d'utilisation RelicusRoad + Vidéos de formation + Accès au groupe Discord privé + Statut VIP UNE NOUVELLE FAÇON DE REGARDER LE MARCHÉ RelicusRoad est l'indicateur de trading le plus puissant au monde pour le forex, les contrats à terme, les crypto-monnaies, les actions et les indices, offrant aux traders toutes les informations et tous les outils dont ils ont besoin pour rester renta
AW Trend Predictor MT5
AW Trading Software Limited
4.76 (55)
La combinaison des niveaux de tendance et de panne dans un seul système. Un algorithme d'indicateur avancé filtre le bruit du marché, détermine la tendance, les points d'entrée, ainsi que les niveaux de sortie possibles. Les signaux indicateurs sont enregistrés dans un module statistique, qui vous permet de sélectionner les outils les plus appropriés, montrant l'efficacité de l'historique des signaux. L'indicateur calcule les marques Take Profit et Stop Loss. Manuel et instruction ->   ICI   / v
TPSpro TRENDPRO  - is a trend indicator that automatically analyzes the market and provides information about the trend and each of its changes, as well as giving signals for entering trades without redrawing! The indicator uses each candle, analyzing them separately. referring to different impulses - up or down impulse. Exact entry points into transactions for currencies, crypto, metals, stocks, indices!  -  Version MT4                  DETAILED DESCRIPTION        /       TRADING SETUPS       
FX Power MT5 NG
Daniel Stein
5 (4)
Obtenez votre mise à jour quotidienne du marché avec des détails et des captures d'écran via notre Morning Briefing ici sur mql5 et sur Telegram ! FX Power MT5 NG est la nouvelle génération de notre très populaire indicateur de force des devises, FX Power. Et qu'est-ce que ce compteur de force de nouvelle génération offre ? Tout ce que vous avez aimé de l'original FX Power PLUS Analyse de la force de l'OR/XAU Des résultats de calcul encore plus précis Périodes d'analyse configurables individuel
Advanced Supply Demand MT5
Bernhard Schweigert
4.53 (15)
La meilleure solution pour tout commerçant débutant ou expert ! Cet indicateur est un outil de trading unique, de haute qualité et abordable car nous avons intégré un certain nombre de fonctionnalités propriétaires et une nouvelle formule. Avec cette mise à jour, vous pourrez afficher des zones à double horaire. Vous pourrez non seulement afficher un TF plus élevé, mais afficher les deux, le graphique TF, PLUS le TF supérieur : AFFICHAGE DES ZONES NICHÉES. Tous les traders Supply Demand vont ado
Auto Order Block with break of structure based on ICT and Smart Money Concepts Futures Break of Structure ( BoS )             Order block ( OB )            Higher time frame Order block / Point of Interest ( POI )    shown on current chart           Fair value Gap ( FVG ) / Imbalance   ,  MTF      ( Multi Time Frame )    Volume Imbalance     ,  MTF          vIMB Gap’s Equal High / Low’s     ,  MTF             EQH / EQL Liquidity               Current Day High / Low           HOD /
A key element in trading is zones or levels from which decisions to buy or sell a trading instrument are made. Despite attempts by major players to conceal their presence in the market, they inevitably leave traces. Our task was to learn how to identify these traces and interpret them correctly. Reversal First Impulse levels (RFI)   -  Version MT4                  INSTRUCTIONS                 RUS                 ENG                         R ecommended to use with an indicator   -  TREND PRO  
ICT, SMC, SMART MONEY CONCEPTS, SMART MONEY, Smart Money Concept, Support and Resistance, Trend Analysis, Price Action, Market Structure, Order Blocks, BOS/CHoCH,   Breaker Blocks ,  Momentum Shift,   Supply&Demand Zone/Order Blocks , Strong Imbalance,   HH/LL/HL/LH,    Fair Value Gap, FVG,  Premium  &   Discount   Zones, Fibonacci Retracement, OTE, Buy Side Liquidity, Sell Side Liquidity, BSL/SSL Taken, Equal Highs & Lows, MTF Dashboard, Multiple Time Frame, BigBar, HTF OB, HTF Market Structure
Gartley Hunter Multi
Siarhei Vashchylka
5 (5)
Gartley Hunter Multi - An indicator for searching for harmonic patterns simultaneously on dozens of trading instruments and on all classic timeframes: (m1, m5, m15, m30, H1, H4, D1, Wk, Mn). Manual (Be sure to read before purchasing) | Version for MT4 Advantages 1. Patterns: Gartley, Butterfly, Shark, Crab. Bat, Alternate Bat, Deep Crab, Cypher 2. Simultaneous search for patterns on dozens of trading instruments and on all classic timeframes 3. Search for patterns of all possible sizes. Fr
Professional Scalping Tool on Deriv Attention! The indicator will be sold in limited quantities!!! The previous 5 copies were sold for $250 The next 5 copies will be sold for $350 The next price is $500 Description: This trading indicator is designed for professional traders focused on scalping. Designed with the market in mind, it provides highly accurate spike trading signals. It works on the M1 timeframe and supports the following symbols: Boom 300 Index, Boom 500 Index, Boom 1000 Index,
Blahtech Supply Demand MT5
Blahtech Limited
4.57 (14)
Was: $299  Now: $99   Supply Demand uses previous price action to identify potential imbalances between buyers and sellers. The key is to identify the better odds zones, not just the untouched ones. Blahtech Supply Demand indicator delivers functionality previously unavailable on any trading platform. This 4-in-1 indicator not only highlights the higher probability zones using a multi-criteria strength engine, but also combines it with multi-timeframe trend analysis, previously confirmed swings
MetaForecast M5
Vahidreza Heidar Gholami
5 (2)
MetaForecast prédit et visualise l'avenir de n'importe quel marché en se basant sur les harmoniques des données de prix. Bien que le marché ne soit pas toujours prévisible, s'il y a un motif dans les prix, MetaForecast peut prédire l'avenir aussi précisément que possible. Comparé à d'autres produits similaires, MetaForecast peut générer des résultats plus précis en analysant les tendances du marché. Paramètres d'entrée Past size (Taille passée) Spécifie le nombre de barres que MetaForecast uti
Bill Williams Advanced
Siarhei Vashchylka
5 (4)
Bill Williams Advanced is designed for automatic chart analysis using Bill Williams' "Profitunity" system. The indicator analyzes four timeframes at once. Manual (Be sure to read before purchasing) Advantages 1. Automatically analyzes the chart using the "Profitunity" system of Bill Williams. The found signals are placed in a table in the corner of the screen. 2. Equipped with a trend filter based on the Alligator indicator. Most of the system signals are recommended to be used only accordi
Owl Smart Levels MT5
Sergey Ermolov
4.49 (37)
Version MT4   |  FAQ L' indicateur Owl Smart Levels est un système de trading complet au sein d'un seul indicateur qui comprend des outils d'analyse de marché populaires tels que les fractales avancées de Bill Williams , Valable ZigZag qui construit la structure d'onde correcte du marché et les niveaux de Fibonacci qui marquent les niveaux exacts d'entrée. sur le marché et les endroits où prendre des bénéfices. Description détaillée de la stratégie Mode d'emploi de l'indicateur Conseiller-Assis
Présentation       Quantum Breakout PRO   , l'indicateur révolutionnaire MQL5 qui transforme la façon dont vous négociez les zones d'évasion ! Développé par une équipe de traders expérimentés avec une expérience commerciale de plus de 13 ans,       Évasion quantique PRO       est conçu pour propulser votre parcours commercial vers de nouveaux sommets grâce à sa stratégie de zone de discussion innovante et dynamique. Quantum Breakout Indicator vous donnera des flèches de signalisation sur le
XQ Indicator MetaTrader 5
Marzena Maria Szmit
5 (1)
Step into the realm of Forex trading with confidence and precision using XQ, a cutting-edge Forex indicator designed to elevate your trading game to unprecedented heights. Whether you're a seasoned trader or just stepping into the world of currency exchange, XQ Forex Indicator empowers you with the insights and signals needed to make informed trading decisions. The signal conditions are a combination of three indicators, and XQ Forex Indicator only display  medium and long-term trends . The ind
MetaBands M5
Vahidreza Heidar Gholami
4.67 (3)
MetaBands uses powerful and unique algorithms to draw channels and detect trends so that it can provide traders with potential points for entering and exiting trades. It’s a channel indicator plus a powerful trend indicator. It includes different types of channels which can be merged to create new channels simply by using the input parameters. MetaBands uses all types of alerts to notify users about market events. Features Supports most of the channel algorithms Powerful trend detection algorith
Italo Volume Indicator MT5
Italo Santana Gomes
4.73 (15)
BUY INDICATOR AND GET EA FOR FREE AS A BONUS + SOME OTHER GIFTS! ITALO VOLUME INDICATOR  is the best volume indicator ever created, and why is that? The Indicator works on all time-frames and assets, indicator built after 7 years of experience on forex and many other markets. You know many volume indicators around the internet are not complete, does not help, and it's difficult to trade, but the Italo Volume Indicator is different , the Italo Volume Indicator shows the wave volume, when market
The Volume by Price Indicator for MetaTrader 5 features Volume Profile and Market Profile TPO (Time Price Opportunity). Get valuable insights out of currencies, equities and commodities data. Gain an edge trading financial markets. Volume and TPO histogram bar and line charts. Volume Footprint charts. TPO letter and block marker charts including split structures. Versatile segmentation and compositing methods. Static, dynamic and flexible ranges with relative and/or absolute visualizations. Lay
Tout d'abord, il convient de souligner que ce système de trading est un indicateur non repainting, non redrawing et non lagging, ce qui le rend idéal pour le trading professionnel. Le "Système de Trading de Support et Résistance Intelligent" est un indicateur avancé conçu pour les traders novices et expérimentés. Il permet aux traders de bénéficier de précision et de confiance sur le marché du forex. Ce système complet combine plus de 7 stratégies, 10 indicateurs et diverses approches de trad
Dessine automatiquement les niveaux de support et de résistance PLUS les écarts des bougies de propulsion sur votre graphique, afin que vous puissiez voir où le prix est susceptible de se diriger ensuite et/ou de s'inverser potentiellement. Cet indicateur est conçu pour être utilisé dans le cadre de la méthodologie de trading de position enseignée sur mon site web (The Market Structure Trader) et affiche des informations clés pour le ciblage et les entrées potentielles. MT4 Version:  https://
TrendDecoder Premium MT5
Christophe, Pa Trouillas
5 (1)
Identifiez les ranges et les tendances fortes  |  Obtenez les premiers signaux   |    Obtenez des TP et des sorties   clairs   |    Repérer les niveaux Fibo que le prix va tester   |  Indicateur qui ne retrace pas, non retardé - idéal pour le trading manuel et automatisé - adapté à tous les actifs et à toutes les unités de temps - 50% discount   pour le lancement - puis retour à >>   149 $ Après votre achat,   contactez-moi sur ce canal  pour obtenir les réglages recommandés. Version MT4 :   cli
Malaysian SNR Levels
Matthias Horst Pieroth
This indicator can be used to display Support and Resistance levels according to  the  Malaysian SNR concept , in which Support and Resistance are exact levels of a line chart. Malaysian SNR There are 3 different horizontal levels in Malaysian SNR: A-Level : This level is located at the peak of this line chart. (shape looks like the letter A) V-Level : Level at the valley of a line chart, (shape looks like the letter V) Gap-Leve l: This level is located at the Close/Open gap between two cand
Plus de l'auteur
L'indicateur fonctionne avec deux périodes de temps, a un affichage visuel des vagues directement sur le graphique de travail et affiche les niveaux de vagues horizontaux. L'indicateur ZigZag relie les hauts et les bas significatifs sur le graphique des prix avec des lignes inclinées visibles qui facilitent la perception du mouvement des vagues et divisent les vagues en plages par niveaux. Les extrêmes sont calculés par les prix High \ Low ou par les prix Close. Les niveaux de vague sont projeté
Deal Calculator
Aleksandr Puchkin
Le calculateur de trading vous permet de calculer les paramètres d'une transaction avant de l'ouvrir et d'obtenir les valeurs de la marge, du volume de la transaction et du risque, ce qui vous permet d'évaluer assez précisément la transaction à la fois en termes de perte et de profit possibles. Il affiche également la méthode de calcul pour l'instrument actuel, la devise de profit, le taux de conversion, la devise de base, la taille de l'équité, le volume de la position, le risque en pourcentag
Filtrer:
Aucun avis
Répondre à l'avis