Volume indicator

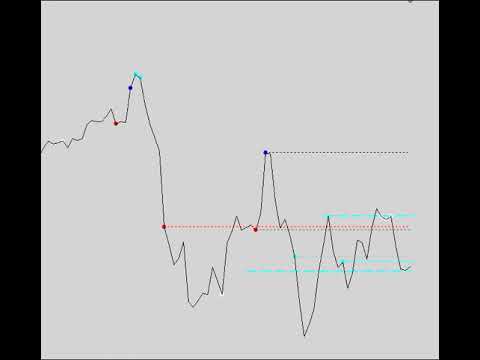
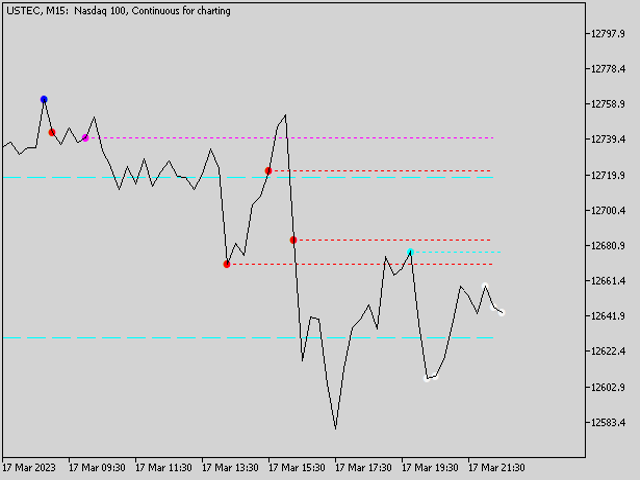
Gösterge iki zaman periyodu ile çalışır, olayları doğrudan çalışma grafiği üzerinde görsel olarak gösterir ve destek / direnç seviyeleri olarak hizmet eden yatay seviyeleri gösterebilir.

Oluşturulan hacimlerin farklı değerleri, grafiğin sağ tarafına yönlendirilen seviyelerin oluşturulduğu ilgili çubukta renkli bir işaret olarak görüntülenir. Çalışma grafiğinde, daha eski zaman diliminden alınan seviyeler de görüntülenir. Seviyelerin gösterimi ve özellikleri gösterge ayarlarında belirlenir. Oluşan zaman periyodunun seviyeleri genellikle daha yüksek önceliğe sahiptir. Her seviyede, seviye hakkında gerekli bilgileri içeren bir araç ipucu bulunur. Gerçek seviyeleri elde etmek için ortalama aralık değeri (ATR) kullanılır. Hem tick hem de gerçek (varsa) hacim değerlerini kullanmak mümkündür.

Hacim göstergesi, "Daha İyi Hacim Göstergesi" göstergesinde uygulanan fikre dayanmaktadır.

Gösterge algoritması şu anda çalışacak şekilde uyarlanmıştır ve geçmiş verilerin analizi için tasarlanmamıştır.


Görüntülenen olaylar

  • VCU - geniş bir çubuk aralığında sesin doruk noktası
  • VCN - geniş bir çubuk aralığında nötr hacim doruk noktası
  • VCD - geniş bir çubuk aralığında ses kısma zirvesi
  • HVC - düşük çubuk aralığında yüksek hacim
  • VCHVC - VCU, VCN, VCD'nin kombinasyonu
  • LV - düşük çubuk hacmi

*gösterge tarafından görüntülenen olayların daha ayrıntılı bir açıklaması, orijinal adı altında kamu malıdır.


Giriş parametreleri

  • Volume mode: Tick / Real - hacim veri toplama modunun seçimi
  • Range for calculate, pcs - hesaplanacak çubuk sayısı
  • Dot size multiplier - etiket boyutunu değiştirmek için çarpan
  • Displayed of levels for current period - cari dönem için seviyelerin görüntülenmesi
  • Displayed of levels for high period - eski dönem için seviyelerin görüntülenmesi
  • High period for plotting - bina seviyeleri için kıdemli dönem
  • Number of displayed levels, pcs - görüntülenen seviye sayısı
  • Style of Current period lines - cari dönem seviye stili
  • Style of High period lines - üst düzey stil
  • Line for VCU, VCN, VCD, HVC, VCHVC, LV true:ON / false:OFF - seviye göstergesi
  • Color of VCU, VCN, VCD, HVC, VCHVC, LV mark - etiket rengi
  • Period for ATR calculate - ortalama aralığın (ATR) hesaplanması için süre
  • Bars for ATR calculate - ortalama aralığı (ATR) hesaplamak için çubuk sayısı

Önerilen ürünler
Beholder
Joao Marcilio
BEHOLDER – THE INDICATOR THAT REVEALS HIDDEN PATTERNS IN TIME THE REAL TRADER’S PROBLEM: TEMPORAL BLINDNESS Every week, thousands of traders face the same dilemma: A flood of economic events (NFP, CPI, Interest Rates, Retail Sales…) Very little time to analyze correlations Decisions made on “gut feeling,” without reliable historical context Trying to do this manually is insane: Scrolling back through dozens of weeks on the calendar Comparing event by event Trying to calculate patt
Dual Bollinger Session Channel
Danton Dos Santos Sardinha Junior
Dual Bollinger Session Channel MetaTrader 5 için Profesyonel Sabit Seans Bollinger Kanalları Gerçek seans verileri kullanılarak fiyat hareketi (price action), kırılım (breakout) ve kurumsal piyasa yapısı analizleri için tasarlanmıştır. Ürün Genel Bakışı Dual Bollinger Session Channel , MetaTrader 5 için profesyonel seviyede bir teknik göstergedir ve yalnızca önceki gerçek işlem seansı ndan (günlük veya haftalık) elde edilen iki bağımsız Bollinger Bandı hesaplamasına dayalı olarak sabit istatis
Candle Timer Countdown (CTC) – Minimalist & Precise Candle Timer Candle Timer Countdown (CTC) is a lightweight and non-intrusive MetaTrader indicator that displays the remaining time of the current candlestick on your chart. Designed with simplicity and clarity in mind, this tool helps traders stay aware of candle closures without cluttering the chart. Key Features: Real-Time Candle Countdown Always know how many seconds are left before the current candle closes – works on all timeframes. Minima
FREE
iVolX indicator horizontal volumes for all time periods Main settings of the indicator: VolumeSource - select data for volumes (tick or real) PeriodMinutes - selection period for rendering of volumes PeriodsNumber - number of periods to show on the chart StartDate - the start date of the calculations ClusterPoints - cluster width Color - color MaxVolColor - maximum volume color ValueArea - the value of the zone of balance ValueAreaColor - color of the balance zone MaxVolFontSize - font size Mav
Smart Wave Trend Analyzer Akıllı Dalga Trend Analizörü Dalga analizi ve fraktal desenlere dayalı olarak yüksek kaliteli trend çizgilerini otomatik olarak tanımlayan ve çizen gelişmiş bir trend tespit sistemi. MT4-version:  https://www.mql5.com/en/market/product/164395 Ana Bileşenler: 1. ANA ÇIZGILER (Mavi/Kırmızı, Kalın) SMA(70) ve LWMA(10) kesişimine dayalı uzun vadeli trend Fiyat hareketindeki ana zirveleri ve dipleri tanımlar Mavi çizgi = Direnç (zirveleri birleştirir) Kırmızı çizgi = Destek
In the fast-paced world of cryptocurrency trading, understanding market dynamics is crucial for making informed decisions. One of the key indicators that traders use to analyze market behavior is Volume Delta, which offers insights into the balance between buying and selling pressure. This article explores the concept of Volume Delta, its significance in order flow analysis, and how it can be used effectively in trading strategies. By providing a clear understanding of this indicator, traders ca
Einstein Pivot Point
Luis Cesar Nunes Dos Santos
Einstein Pivot Point indicator shows you hourly, weekly or monthly pivot points and support and resistance levels. You can choose 3 different formula for the support and resistance levels (Classic Formula, Woodie Pivot Points and Fibonacci Pivot Points). Einstein Pivot Point   will automatically calculate the p ivot point   and   support  and  resistance levels  on the basis of market data. Trading requires reference points (support and resistance), which are used to determine when to enter the
LevelPAttern MT5 is a technical indicator based on the daily levels and Price Action patterns. The indicator is based on the standard ZigZag indicator + reversal candlestick pattens, such as Star, Hammer (also knows as Pin bar), Engulfing and others. The indicator generates audio and text notifications when a pattern is formed and a level is touched. It also supports sending email and push notifications. Indicator operation features It is suitable for working with any CFD and FOREX trading inst
A Renko Tick chart based on continuously adjusting percentage. Live Renko bricks formed by tick data Adjustable brick width expert for indicator attached Scalp with a Renko, get weird. The settings can and will break the script if you turn them up too high. Turning off outline mode will not look as nice, but can potentially allow for a larger number of bricks.
FREE
Japanese Candlestick Indicator
Alexander Denisovich Jegorov
Simple Japanese candlestick indicator Contains 3 patterns: - bearish engulfing - bullish engulfing - doji Only contains these 3 because after rigorous testing and trading (data) these seem to be the most efficient. Also contains: - alerts if enabled  When japanese candlestick is detected it is colored with relevant color depending on bias, and also shows label next to it. Labels: - BEG = Bearish engulfing - BE = Bullish engulfing - DO = Doji
Price Statistics MT5
Miguel Antonio Rojas Martinez
This indicator works only 5 digits Brokers. It is impossible to talk about the study of the Forex market or any market without considering of that market statistics. In this case, our indicator "price statistics" we have a new way to study our chart, giving information of the price in a range of pips you want to study for example, can we know how many times the price closes or opens into spaces 10, 20, 30, 50, 100 pips or more; and know them not only in numbers but also draws this relationship a
MT5 için Crypto_Forex Göstergesi "Çekiç ve Kayan Yıldız paterni", Yeniden boyama yok, gecikme yok. - "Çekiç ve Kayan Yıldız paterni" göstergesi, Fiyat Hareketi işlemleri için çok güçlü bir göstergedir. - Gösterge, grafikte boğa Çekiç ve ayı Kayan Yıldız formasyonlarını tespit eder: - Boğa Çekiç - Grafikte mavi ok sinyali (resimlere bakın). - Ayı Kayan Yıldız - Grafikte kırmızı ok sinyali (resimlere bakın). - Bilgisayar, Mobil ve E-posta uyarılarıyla. - "Çekiç ve Kayan Yıldız paterni" gösterges
Genel Açıklama Bu gösterge, klasik Donchian Kanalı ’nın geliştirilmiş bir versiyonudur ve gerçek işlem için pratik işlevlerle zenginleştirilmiştir. Standart üç çizgiye (üst, alt ve orta çizgi) ek olarak sistem breakout (fiyat kırılımı) noktalarını tespit eder ve bunları grafikte oklarla görsel olarak gösterir. Ayrıca grafiği sadeleştirmek için mevcut trend yönünün tersindeki çizgi yalnızca görüntülenir. Gösterge şunları içerir: Görsel sinyaller : Kırılım sırasında renkli oklar Otomatik bildiriml
FREE
LT Rainbow Trend
Thiago Duarte
5 (1)
Do you, like me, like to trade with the trend? Then this indicator will help you! Rainbow Trend is a trend indicator, which uses several Moving Averages on the chart. It measures different trend strenght zones for different periods: very long term, long term, mid term, short term and very short term. Each zone has its color, and it is possible to have sound alert when the prices leaves a zone and enters another. Its configuration is very simple. If you find any bug or have any suggestions, conta
This indicator plots in the candles the divergence found in the selected indicator and can also send a notification by email and / or to the cell phone. Works on all TIMEFRAMES. Meet Our Products   He identifies the divergences in the indicators: Relative Strength Index (RSI); Moving Average Convergence and Divergence (MACD); Volume Balance (OBV) and;. iStochastic Stochastic Oscillator  (STOCHASTIC). It is possible to choose the amplitude for checking the divergence and the indicator has to b
MT5 Rectangle Extender Indicator
Muhammad Shamsuddeen Muhammad
MT5 Rectangle Extender Indicator is a simple and easy tool that automatically extends any box/rectangle drawn on the chart to the right edge of the screen.  This tool can be used for easy drawing of zones and can help with determining future areas of interest on the chart once price trades back to those levels. Very suitable for supply and demand, order blocks, POI's (Points of Interest) mapping on charts. Sometimes its better to have a zone than a single price level as price can shoot above or
Support & Resistance indicator is a modification of the standard Bill Williams' Fractals indicator. The indicator works on any timeframes. It displays support and resistance levels on the chart and allows setting stop loss and take profit levels (you can check the exact value by putting the mouse cursor over the level). Blue dashed lines are support level. Red dashed lines are resistance levels. If you want, you can change the style and color of these lines. If the price approaches a support lev
Nine Five Count
Alfred Mirzasalikhov
The 9-5 Count is designed to track a very powerful cycle that runs through all freely traded markets. This is not a time cycle but a price cycle. The time spent between two points is not as important as the price traveled between them. The 9-5 Count is called that because one complete upward cycle consists of measurement of 9 units plus 5 units of cycle time.   This tool takes into account price and pattern together, so it’s more than just a simple cycle. The 9-5 theory classifies market movemen
The indicator displays support and resistance levels based on fibonacci level in multi period Creates lines indicating the latest support and resistance levels. These lines are updated whenever there is a change in support or resistance levels. Labels are removed if the corresponding conditions are not met. the period is availble in setting and level fibonacci
FREE
Dynamic Pivot Zones
Vincent Jose Proenca
Dynamic Pivot Zones – Your Level Assistant on the Chart This indicator is a bit like a GPS for your trading . It shows you where the price likes to hang out, where it gets nervous, and where it flies through. No more calculating pivots by hand or guessing support and resistance levels. What it does: Automatically plots H1, H4, and D1 pivots . Shows support and resistance zones : R1, R2, S1, S2. Lines are colored and easy to read , so you can instantly see what’s hot or cold. Why you’ll love it:
FREE
MT5 için Crypto_Forex Göstergesi "Çift Kayan Yıldız paterni", Yeniden boyama yok, gecikme yok. - "Çift Kayan Yıldız paterni" göstergesi, Fiyat Hareketi işlemleri için çok güçlü bir göstergedir. - Gösterge, nadir ancak etkili bir paterni tespit eder: Grafikte düşüş yönlü Çift Kayan Yıldız: - Düşüş yönlü Çift Kayan Yıldız paterni - Grafikte kırmızı ok sinyali (resimlere bakın). - Dahili PC ve Mobil uyarıları vardır. - "Çift Kayan Yıldız paterni" göstergesi, Destek/Direnç Seviyeleriyle birleştirm
LZ Multi-Timeframe Candle Timer displays the remaining time before the current bar closes for multiple timeframes simultaneously on a single dashboard. Monitor up to 9 timeframes (M1, M5, M15, M30, H1, H4, D1, W1, MN1) without switching charts. The indicator uses server time, updates every second, and is optimized for smooth display with minimal CPU use. Feature highlights - Multi-timeframe display: select which timeframes to show (M1 through MN1) via boolean inputs. Display only the interval
FREE
Day Trader WorkTime
Aurthur Musendame
4.8 (15)
The worktime indicator helps you identify the most important times to day to trade the currency pairs. It was created based on the ICT day trading free tutorials that are freely vailable on his youtube channel.  You can use this indicator together with my other indicators that i have shared freely with you like the true day, custom periods, daily month, weekly open lines - they together complement each other very well. Nuggets from this indicator: 1. Draws the asian session box showinng you the
FREE
Master the market: harness the power of statistical arbitrage This indicator showcases the price action of multiple instruments on a single chart, enabling you to compare the fluctuations of different assets and seamlessly implement statistical arbitrage strategies. Its main usage is to find correlated symbols which are temporarily out of whack. [ Installation Guide | Update Guide | Troubleshooting | FAQ | All Products ] Find overbought or oversold currency pairs easily Plot up to six currency
FREE
Little useful tool - you manually select range on chart by dragging vertical blue lines and indicator shows support and resistance zones for this range and extends them outside of selected range.  Useful for: * Range trading * Range breakout * Range breakout & retest * Good entry during pullback in trend phase when previous high is retested * Good for scalping on short timeframes * Good for trades on longer timeframes around selected important zones like daily high or low
FREE
https://www.mql5.com/en/users/gedeegi/seller    The GEN indicator is a multifunctional technical analysis tool for the MetaTrader 5 (MT5) platform. It is designed to automatically identify and display key Support and Resistance (S&R) levels and detect False Breakout signals, providing clear and visual trading cues directly on your chart. Its primary goal is to help traders identify potential price reversal points and avoid market traps when the price fails to decisively break through key levels
FREE
Candlestick Pattern Teller
Flavio Javier Jarabeck
5 (1)
Minions Labs' Candlestick Pattern Teller It shows on your chart the names of the famous Candlesticks Patterns formations as soon as they are created and confirmed. No repainting. That way beginners and also professional traders who have difficulties in visually identifying candlestick patterns will have their analysis in a much easier format. Did you know that in general there are 3 types of individuals: Visual, Auditory, and Kinesthetic? Don't be ashamed if you cannot easily recognize Candlesti
This indicator is intended for visual multicurrency analysis. It allows synchronous scrolling and analysis of a few charts simultaneously and can also be used for pairs trading. The indicator works both on Forex and on Russian FORTS market. The product has a very important property - if there are skipped bars at the symbols, the synchronism of charts on the time axis is fully preserved. Each chart point is strictly synchronous with the others on the time axis at any time frame. This is especiall
Gold Entry Sniper
Tahir Mehmood
5 (4)
Gold Entry Sniper – Altın Scalping & Swing Trading için Profesyonel Çoklu Zaman Çerçeveli ATR Paneli Gold Entry Sniper , XAUUSD ve diğer enstrümanlar için doğru al/sat sinyalleri veren, ATR Trailing Stop mantığı ve çoklu zaman çerçevesi analizi ile geliştirilmiş gelişmiş bir MetaTrader 5 göstergesidir. Temel Özellikler ve Avantajlar Çoklu Zaman Çerçevesi Analizi – M1, M5, M15 trendlerini tek panelde gösterir. ATR Tabanlı Trailing Stop – Volatiliteye göre dinamik olarak ayarlanır. Profesyonel Gra
Visual Eagle Momentum Cycle indicator
AL MOOSAWI ABDULLAH JAFFER BAQER
Unlock Market Momentum with the Visual Eagle Momentum Cycle Indicator Are you tired of noisy charts and lagging indicators that give signals too late? Do you struggle to find clear entry and exit points in today's volatile markets? The Visual Eagle Momentum Cycle is the definitive tool designed to give you a precise, analytical edge, helping you identify high-probability trading setups with confidence. For a one-time price of $30, you can equip your trading arsenal with this powerful, professio
Bu ürünün alıcıları ayrıca şunları da satın alıyor
Bu indikatörü satın alırsanız, Profesyonel Trade Manager’ımı  + EA ÜCRETSİZ olarak alacaksınız. Öncelikle, bu Ticaret Sistemi'nin Non-Repainting, Non-Redrawing ve Non-Lagging Göstergesi olduğunu vurgulamak önemlidir, bu da hem manuel hem de robot ticareti için ideal hale getirir. Online kurs, kılavuz ve ön ayarları indir. "Smart Trend Trading System MT5", yeni ve deneyimli tüccarlar için özelleştirilmiş kapsamlı bir ticaret çözümüdür. 10'dan fazla premium göstergeyi birleştiriyor ve 7'den fazla
SuperScalp Pro
Van Minh Nguyen
5 (5)
SuperScalp Pro – Gelişmiş Çoklu Filtreli Scalping Gösterge Sistemi SuperScalp Pro, klasik Supertrend ile çok sayıda akıllı onay filtresini birleştiren gelişmiş bir scalping gösterge sistemidir. Gösterge M1’den H4’e kadar tüm zaman dilimlerinde verimli çalışır ve özellikle XAUUSD, BTCUSD ve ana Forex pariteleri için uygundur. Bağımsız bir sistem olarak kullanılabilir veya mevcut ticaret stratejilerine esnek şekilde entegre edilebilir. Gösterge, hız ve yavaş EMA’lar, trend belirleyen üç EMA, EMA e
ARIPoint
Temirlan Kdyrkhan
ARIPoint is a powerful trading companion designed to generate high-probability entry signals with dynamic TP/SL/DP levels based on volatility. Built-in performance tracking shows win/loss stats, PP1/PP2 hits, and success rates all updated live. Key Features: Buy/Sell signals with adaptive volatility bands Real-time TP/SL/DP levels based on ATR Built-in MA Filter with optional ATR/StdDev volatility Performance stats panel (Success, Profit/Loss, PP1/PP2) Alerts via popup, sound, push, or email Cu
FX Trend MT5 NG
Daniel Stein
5 (3)
FX Trend NG: Yeni Nesil Çoklu Piyasa Trend Zekâsı Genel Bakış FX Trend NG , çoklu zaman dilimlerinde çalışan profesyonel bir trend analiz ve piyasa izleme aracıdır. Piyasanın yapısını saniyeler içinde anlamanızı sağlar. Birden fazla grafik arasında geçiş yapmak yerine, hangi enstrümanların trendde olduğunu, momentumun nerede zayıfladığını ve hangi zaman dilimlerinin uyumlu olduğunu anında görebilirsiniz. Lansman Teklifi – FX Trend NG sadece $30 (6 Ay) veya $80 Ömür Boyu Lisans ile edinin. Zate
Entry In The Zone and SMC Multi Timeframe is a real-time market analysis tool developed based on Smart Money Concepts (SMC). It is designed to analyze market structure, price direction, reversal points, and key zones across multiple timeframes in a systematic way. The system displays Points of Interest (POI) and real-time No Repaint signals, with instant alerts when price reaches key zones or when signals occur within those zones. It functions as both an Indicator and a Signal System (2-in-1), c
Divergence Bomber
Ihor Otkydach
4.89 (82)
Bu göstergeyi satın alan herkese aşağıdaki ekstra içerikler ücretsiz olarak sunulmaktadır: Her işlemi otomatik olarak yöneten, Stop Loss ve Take Profit seviyelerini ayarlayan ve işlemleri strateji kurallarına göre kapatan özel yardımcı araç: "Bomber Utility" Göstergenin farklı varlıklar üzerinde kullanılmasına yönelik ayar dosyaları (set dosyaları) Bomber Utility için 3 farklı modda kullanım sunan ayar dosyaları: "Minimum Risk", "Dengeli Risk" ve "Bekle-Gör Stratejisi" Bu ticaret stratejisini hı
Power Candles – Tüm Piyasalar İçin Güce Dayalı Giriş Sinyalleri Power Candles , Stein Investments’ın kanıtlanmış güç analizini doğrudan fiyat grafiğinize taşır. Sadece fiyata tepki vermek yerine, her mum gerçek piyasa gücüne göre renklendirilir. Bu sayede momentum birikimleri, güç hızlanmaları ve net trend geçişleri anında görülebilir. Tüm Piyasalar İçin Tek Mantık Power Candles tüm işlem sembollerinde otomatik olarak çalışır. Gösterge, mevcut sembolün Forex mi yoksa Forex dışı bir piyasa mı old
Game Changer Indicator mt5
Vasiliy Strukov
4.79 (19)
Game Changer è un indicatore di tendenza rivoluzionario, progettato per essere utilizzato su qualsiasi strumento finanziario, per trasformare il tuo MetaTrader in un potente analizzatore di trend. Funziona su qualsiasi intervallo temporale e aiuta a identificare i trend, segnala potenziali inversioni, funge da meccanismo di trailing stop e fornisce avvisi in tempo reale per risposte tempestive del mercato. Che tu sia un professionista esperto o un principiante in cerca di un vantaggio, questo st
Smart Stop Indicator – Stop-loss düzeylerini doğrudan grafikte akıllı ve hassas şekilde belirleyin Genel Bakış Smart Stop Indicator, stop-loss seviyesini tahmin ederek veya sezgilere güvenerek değil, net ve sistematik bir şekilde belirlemek isteyen traderlar için özel olarak geliştirilmiştir. Bu araç, klasik price-action mantığını (yükselen tepeler, düşen dipler) modern breakout algılama ile birleştirerek bir sonraki mantıklı stop seviyesini belirler. Trendlerde, yatay piyasalarda veya hızlı k
Azimuth Pro
Ottaviano De Cicco
5 (4)
LAUNCH PROMO Azimuth Pro price is initially set at 299$ for the first 100 buyers. Final price will be 499$ . THE DIFFERENCE BETWEEN RETAIL AND INSTITUTIONAL ENTRIES ISN'T THE INDICATOR — IT'S THE LOCATION. Most traders enter at arbitrary price levels, chasing momentum or reacting to lagging signals. Institutions wait for price to reach structured levels where supply and demand actually shift. Azimuth Pro maps these levels automatically: swing-anchored VWAP, multi-timeframe structure lines, an
FX Power MT5 NG
Daniel Stein
5 (31)
FX Power: Daha Akıllı Ticaret Kararları için Para Birimlerinin Gücünü Analiz Edin Genel Bakış FX Power , her piyasa koşulunda başlıca para birimlerinin ve altının gerçek gücünü anlamak için vazgeçilmez bir araçtır. Güçlü para birimlerini alıp zayıf olanları satarak, FX Power ticaret kararlarınızı basitleştirir ve yüksek olasılıklı fırsatları ortaya çıkarır. İster trendlere sadık kalın ister Delta'nın aşırı değerlerini kullanarak tersine dönüşleri öngörün, bu araç ticaret tarzınıza mükemmel bir
Trend Screener Pro MT5
STE S.S.COMPANY
4.84 (100)
Trend Göstergesi, Trend Alım Satım ve Filtreleme için Çığır Açan Benzersiz Çözüm, Tüm Önemli Trend Özellikleriyle Tek Bir Araç İçinde Yerleştirildi! Forex, emtialar, kripto para birimleri, endeksler ve hisse senetleri gibi tüm sembollerde/araçlarda kullanılabilen %100 yeniden boyamayan çoklu zaman çerçevesi ve Çoklu para birimi göstergesidir. Trend Screener, grafikte noktalarla ok trend sinyalleri sağlayan etkili bir trend trend göstergesidir. Trend analizörü göstergesinde bulunan özellikler: 1.
Atomic Analyst MT5
Issam Kassas
4.07 (28)
Öncelikle belirtmek gerekir ki bu Ticaret Göstergesi Yeniden Çizim Yapmaz, Gecikmez ve Gecikme Göstermez, bu da hem manuel hem de robot ticareti için ideal hale getirir. Kullanıcı kılavuzu: ayarlar, girişler ve strateji. Atom Analisti, Piyasada Daha İyi Bir Avantaj Bulmak İçin Fiyatın Gücünü ve Momentumunu Kullanan PA Fiyat Hareketi Göstergesidir. Gürültüleri ve Yanlış Sinyalleri Kaldırmaya ve Ticaret Potansiyelini Artırmaya Yardımcı Olan Gelişmiş Filtrelerle Donatılmıştır. Birden fazla katmanl
Top indicator for MT5   providing accurate signals to enter a trade without repainting! It can be applied to any financial assets:   forex, cryptocurrencies, metals, stocks, indices .  Watch  the video  (6:22) with an example of processing only one signal that paid off the indicator! MT4 version is here It will provide pretty accurate trading signals and tell you when it's best to open a trade and close it. Most traders improve their trading results during the first trading week with the help of
Grabber System MT5
Ihor Otkydach
4.82 (22)
Size mükemmel bir teknik gösterge olan Grabber’ı tanıtıyorum. Bu araç, kullanıma hazır bir “her şey dahil” işlem stratejisi olarak çalışır. Tek bir yazılım kodu içinde güçlü piyasa teknik analiz araçları, işlem sinyalleri (oklar), uyarı işlevleri ve push bildirimleri entegre edilmiştir. Bu göstergeyi satın alan herkes aşağıdaki hediyeleri ücretsiz olarak alır: Açık emirleri otomatik yönetmek için Grabber Yardımcı Aracı Kurulum, yapılandırma ve nasıl işlem yapılacağını adım adım anlatan video kıl
FX Levels MT5
Daniel Stein
5 (13)
FX Levels: Tüm Piyasalar İçin Son Derece Hassas Destek ve Direnç Hızlı Bakış Döviz kurları, endeksler, hisseler veya emtialar gibi herhangi bir piyasada güvenilir destek ve direnç seviyeleri belirlemek mi istiyorsunuz? FX Levels geleneksel “Lighthouse” yöntemini ileri düzey bir dinamik yaklaşımla birleştirerek neredeyse evrensel bir doğruluk sağlar. Gerçek broker deneyimimize ve otomatik günlük güncellemeler ile gerçek zamanlı güncellemelerin birleşimine dayalı olarak, FX Levels size dönüş nok
Öncelikle, bu Ticaret Aracının Non-Repainting, Non-Redrawing ve Non-Lagging Gösterge olduğunu vurgulamakta fayda var, bu da onu profesyonel ticaret için ideal hale getiriyor. Çevrimiçi kurs, kullanıcı kılavuzu ve demo. Akıllı Fiyat Hareketi Kavramları Göstergesi, hem yeni hem de deneyimli tüccarlar için çok güçlü bir araçtır. İleri ticaret fikirlerini, Inner Circle Trader Analizi ve Smart Money Concepts Ticaret Stratejileri gibi 20'den fazla kullanışlı göstergeyi bir araya getirerek bir araya
Quantum TrendPulse
Bogdan Ion Puscasu
5 (20)
SuperTrend   ,   RSI   ve   Stochastic'in   gücünü tek bir kapsamlı göstergede birleştirerek işlem potansiyelinizi en üst düzeye çıkaran nihai işlem aracı olan   Quantum TrendPulse'u   tanıtıyoruz. Hassasiyet ve verimlilik arayan yatırımcılar için tasarlanan bu gösterge, piyasa trendlerini, momentum değişimlerini ve en uygun giriş ve çıkış noktalarını güvenle belirlemenize yardımcı olur. Temel Özellikler: SuperTrend Entegrasyonu:   Güncel piyasa trendlerini kolayca takip edin ve karlılık dalgası
Her gün birçok trader ortak bir zorlukla karşılaşır: fiyat önemli bir seviyeyi kırıyor gibi görünür, işleme girerler ve ardından piyasa tersine dönerek stop loss'larını tetikler. Bu, sahte kırılım (false breakout) olarak bilinir — fiyatın bir destek veya direnç seviyesini kısa süreliğine aşması ve ardından yön değiştirmesi hareketidir. Bu hareketler, gerçek fiyat yönü netleşmeden önce stop loss'ların tetiklenmesine neden olabilir. Teknik analizde bu olgu yaygın olarak "likidite taraması" (liquid
Pointer Trend Switch — precision trend reversal indicator Pointer Trend Switch is a high-precision arrow indicator designed to detect key moments of trend reversal based on asymmetric price behavior within a selected range of bars. It identifies localized price impulses by analyzing how far price deviates from the opening level, helping traders find accurate entry points before a trend visibly shifts. This indicator is ideal for scalping, intraday strategies, and swing trading, and performs equa
Trend indicator AI mt5
Ramil Minniakhmetov
5 (15)
Trend Ai göstergesi, trend tanımlamasını işlem yapılabilir giriş noktaları ve geri dönüş uyarılarıyla birleştirerek bir yatırımcının piyasa analizini geliştirecek harika bir araçtır. Bu gösterge, kullanıcıların forex piyasasının karmaşıklıklarında güvenle ve hassasiyetle yol almalarını sağlar. Birincil sinyallerin ötesinde, Trend Ai göstergesi geri çekilmeler veya düzeltmeler sırasında ortaya çıkan ikincil giriş noktalarını belirleyerek, yatırımcıların belirlenen trend içindeki fiyat düzeltmele
Crystal Heikin Ashi Signals - Professional Trend & Signal Detection Indicator Advanced Heikin Ashi Visualization with Intelligent Signal System for Manual & Automated Trading Final Price: $149 ---------> Price goes up $10 after every 10 sales . Limited slots available — act fast . Overview Crystal Heikin Ashi Signals is a professional-grade MetaTrader 5 indicator that combines pure Heikin Ashi candle visualization with an advanced momentum-shift detection system. Designed for both manual traders
ATrend
Zaha Feiz
4.82 (17)
ATREND: Nasıl Çalışır ve Nasıl Kullanılır ### Nasıl Çalışır "**ATREND**" göstergesi, MT5 platformu için tasarlanmış olup, traderlara sağlam alım ve satım sinyalleri sağlamak amacıyla teknik analiz metodolojilerinin bir kombinasyonunu kullanır. Bu gösterge, öncelikle volatilite ölçümü için Ortalama Gerçek Aralık (ATR) kullanır ve potansiyel piyasa hareketlerini belirlemek için trend tespit algoritmalarıyla birleştirir. Satın aldıktan sonra bir mesaj bırakın ve özel bir bonus hediyesi kazanın. ##
Tanıtım       Quantum Breakout PRO   , Breakout Bölgeleri ile ticaret yapma şeklinizi değiştiren çığır açan MQL5 Göstergesi! 13 yılı aşkın ticaret tecrübesine sahip deneyimli tüccarlardan oluşan bir ekip tarafından geliştirilmiştir.       Kuantum Breakout PRO       yenilikçi ve dinamik koparma bölgesi stratejisiyle ticaret yolculuğunuzu yeni zirvelere taşımak için tasarlanmıştır. Kuantum Breakout Göstergesi, size 5 kar hedefi bölgesi ile kırılma bölgelerinde sinyal okları ve kırılma kutusuna da
Suleiman Levels
Suleiman Alhawamdah
5 (3)
لا: لا: تم   ضبط الشاشة على الصورة، بالإضافة إلى 2 من مؤشرات "مستويات سليمان" و"RSI Trend V" المتغيرة. سليمان مستويات Göstergesi ، ممتاز، لديه خبرة مهنية في التحليل. لقد قمت بكتابة 9,800 كتابًا ، وقم بتحليل الرسومات الجرافيكية الخاصة بها في زماننا هذا من خلال الحصول على نتائج صافية. لا داعي للقلق بشأن هذا الأمر.   سليمان ليفلز إن غوتشلو أوزيليكليري: Sarı Kutular (Finansal Akış Tespiti)   - Sarı Kutular için Not: "Göstergenin tamamen yenilikçi ve özel bir özelliği - Sıfırdan keşfedildi" : Belirl
Göstergemiz, piyasada ilgi gösterilen bölgeleri vurgular ve ardından emir birikim bölgelerini gösterir. Büyük ölçekli bir emir defteri (order book) gibi çalışır. Bu, büyük sermaye için geliştirilmiş bir göstergedir. Performansı olağanüstüdür. Piyasada ne tür bir ilgi olursa olsun, onu görürsünüz . (Bu, tamamen yeniden yazılmış ve otomatikleştirilmiş bir versiyondur – artık manuel analiz gerekmez.) İşlem Hızı (Transaction Speed) , piyasada büyük emirlerin nerede ve ne zaman biriktiğini gösteren v
TrendMaestro5
Stefano Frisetti
note: this indicator is for METATRADER4, if you want the version for METATRADER5 this is the link:  https://www.mql5.com/it/market/product/108106 TRENDMAESTRO ver 2.5 TRENDMAESTRO recognizes a new TREND from the start, he never makes mistakes. The certainty of identifying a new TREND is priceless. DESCRIPTION TRENDMAESTRO identifies a new TREND in the bud, this indicator examines the volatility, volumes and momentum to identify the moment in which there is an explosion of one or more of these da
TREND ÇİZGİLERİ PRO       Piyasanın gerçek yön değiştirdiği noktayı anlamaya yardımcı olur. Gösterge, gerçek trend dönüşlerini ve büyük oyuncuların piyasaya yeniden girdiği noktaları gösterir. Anlıyorsun   BOS hatları   Daha yüksek zaman dilimlerindeki trend değişiklikleri ve önemli seviyeler, karmaşık ayarlar veya gereksiz gürültü olmadan gösterilir. Sinyaller yeniden çizilmez ve çubuk kapandıktan sonra grafikte kalır. MT4 SÜRÜMÜ   -   RFI LEVELS PRO   göstergesiyle   birlikte kullanıldığında m
Dark Support Resistance  is an Indicator for intraday trading. This Indicator is programmed to identify  Support and Resistance Lines , providing a high level of accuracy and reliability. Key benefits Easily visible lines Only the most important levels will be displayed Automated adjustment for each timeframe and instrument Easy to use even for beginners Never repaints, never backpaints, Not Lag 100% compatible with Expert Advisor development All types of alerts available: Pop-up, Email, Push
Stratos Pali mt5
Michela Russo
4.5 (8)
Stratos Pali Indicator is a revolutionary tool designed to enhance your trading strategy by accurately identifying market trends. This sophisticated indicator uses a unique algorithm to generate a complete histogram, which records when the trend is Long or Short. When a trend reversal occurs, an arrow appears, indicating the new direction of the trend. Important Information Revealed Leave a review and contact me via mql5 message to receive My Top 5 set files for Stratos Pali at no cost ! Down
Yazarın diğer ürünleri
G ö sterge iki zaman periyodu ile ç al ışı r , dalgalar ı do ğ rudan ç al ış ma tablosu ü zerinde g ö rsel olarak g ö sterir ve yatay dalga seviyelerini g ö sterir . ZigZag g ö stergesi , dalga hareketinin alg ı lanmas ı n ı kolayla ş t ı ran ve dalgalar ı seviyelere g ö re aral ı klara b ö len g ö r ü n ü r e ğ imli ç izgilerle fiyat grafi ğ indeki ö nemli ü st ve altlar ı birle ş tirir . Ekstrem değerler, High\Low fiyatlar veya Close fiyatları ile hesaplanır. Dalga seviyeleri bir sonraki dalga
Alım satım hesaplayıcı, bir anlaşmanın parametrelerini açmadan önce hesaplamanıza ve anlaşmayı hem olası kayıp hem de kar açısından oldukça doğru bir şekilde değerlendirmenize olanak tanıyan marj, işlem hacmi ve risk değerlerini almanıza olanak tanır. Ayrıca cari enstrüman için hesaplama yöntemini, kâr para birimini, dönüştürme oranını, temel para birimini, Özkaynak büyüklüğünü, pozisyon hacmini, yüzde cinsinden riski, Zararı Durdur ve Kârı Al boyutlarını (puan, para ve yüzde olarak), Zararı Du
Filtrele:
İnceleme yok
İncelemeye yanıt