MTF Precise Price Action Arrow Filtered
- 指标
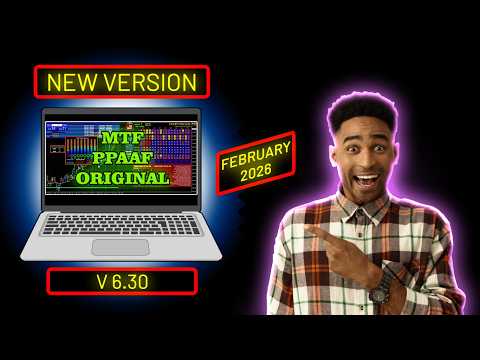
- 版本: 6.40
- 更新: 12 五月 2026
- 激活: 20

7. 枢轴水平功能。 此功能将向您显示发生交叉的开盘蜡烛点水平。 枢轴水平 ac
不像S&R,即支撑和阻力。
8. 重播系统。 通过此功能,您可以回到过去,观察特定日期和时间 9TF 仪表板的状况。 假设您想分析为什么在 2023.10.11 14:21:30 市场会卖出。 要使用此功能,请在较短的时间范围(例如 M5)中打开您的 Meta Trader 4 图表。
9. 蜡烛 HTF(高时间框架)。 借助此功能,当您在较低时间范围内打开图表(我喜欢在 M5 处打开)时,您可以看到较高时间范围(例如 H1)中的市场走势。
10.TSPI(时间利差利润信息)。 通过此功能,您可以实时查看当前时间、点差、盈利/亏损以及盈利/亏损百分比。
11. 开/关按钮功能。 通过此功能,您只需单击一下即可显示或隐藏此交易工具。 有趣吧?
12. 20种仪表板配色方案可供选择。 通过此功能,您可以选择与图表颜色相匹配的仪表板颜色。
13.可定制参数。 计算指标时使用的所有参数都可以根据您的意愿进行调整。 您可以使用随机参数 14,3,3 或 5,3,3 等。或者您使用默认设置。
14. MTF,即多时间框架。 您可以根据自己的意愿设定时间范围。 例如,您想要在 M5 和 H1 时间范围上激活图表上的双随机功能。 你可以!
15. 不可重新绘制箭头 (NRPA)。 如果两条线在任何时候相交,就会出现交叉箭头。 很多时候,由于波动性很大,在接下来的几秒钟和几分钟内,两条线不会相交。 于是,之前出现的箭头就消失了。 这是一个非常重要的特征。 请记住,在高波动性期间,之前向上的箭头可能会变为向下。 先前出现的箭矢,可能会瞬间消失。 这就是为什么我的消息是使用实时 9TF 仪表板监视器进行验证!
16. 汇合3TF特征,即3TF快速随机汇合、3TF快速MACD汇合、3TF MA 1x2汇合和3TF DRSI汇合。 有了这个功能,观察 3TF(三时间框架)交叉点就变得非常容易。 这意味着,例如,如果时间范围(M5、M15、M30)内快速随机主线 > 快速随机信号线,则会出现向上箭头。
17. 汇合双随机指标和汇合双MACD。 利用此功能,如果在快速随机指标和慢速随机指标中存在主线 > 信号线,则出现向上箭头。 双 MACD 也是如此。 对于在同一时间范围内观察两个随机指标和两个 MACD 的交叉点来说,这是一个非常重要的功能。
18.潮流腰带功能。 除了在图表上显示两条移动平均线之外,还有此功能。 当然,您可以根据自己的意愿设定时间范围。
仅使用一种交易指标不太有说服力。 这就是为什么我们结合多个指标来加强对市场方向的分析。
然后可以使用 6 个指标中的任何一个来过滤价格走势:
RSIOMA
双 MACD(新版本 1.3!)
双随机指标(新版本 1.3!)
双 CCI(新版本 2.3!)
四移动平均线(新版本1.6!不仅仅是两移动平均线)
双 RSI(新版本 1.2!)
然后可以通过监控实时 9TF 仪表板来得出价格行为运动方向的强度。
9TF 仪表板监视器向我们显示四移动平均线、RSIMA、双 RSI、双 MACD、双随机和双 CCI 的实时数据。
一键按钮,显示或隐藏指示器
9TF实时仪表板监视器
监控 9TF 四个移动平均线,即 MA 1x2 和 MA 3x4
监控快速 MA 线是否高于或低于慢速 MA 线
监控快 MA 和慢 MA 的角度
监控 9TF 双 RSI,即快速 RSI 和慢速 RSI
监控快速 RSI 线是否高于或低于慢速 RSI 线
监控 9TF 双 MACD,即快速 MACD (MACD 1) 高于或低于慢速 MACD (MACD 2) 且向上或向下
监控主要 MACD 线是否高于或低于信号 MACD 线
监控 9TF 双随机指标,即快速随机指标(随机指标 1)高于或低于慢速随机指标(随机指标 2)且向上或向下
监控主要随机线是否高于或低于信号随机线
监控 9TF 双 CCI,即 OBOS 线上的位置和当前运动
监控 9TF RSIOMA,即 RSI 线高于或低于 MA 线
能够根据需要设置参数并选择时间范围
显示/隐藏图例的能力
能够增加/减少栏数,默认为 800 栏
能够选择多达 20 种仪表板配色方案
该指标可以显示您选择的时间范围内的 RSMA 箭头
该指标可以显示您选择的时间范围内的 MACD 箭头
该指标可以显示您选择的时间范围内的随机箭头
该指标可以显示您选择的时间范围内的 MA 1x2 和 MA 3x4 箭头
该指标可以显示您选择的时间范围内的双 RSI 箭头
该指标可以显示您选择的时间范围内的双 CCI 箭头
不可重画箭头