Boom and Crash Spike Detector Indicator for MT5
- Indicateurs
-
STE S.S.COMPANY
 Hello,
my name is Ashraf a fintech Software Engineer.
I create amazing forex indicators and expert advisors for Metatrader 4 and Metatrader 5, the best trading platforms.
Use my service and let me build your trading strategies ( Indicator coding or EA coding ) by click on bellow link - Version: 1.0
- Activations: 10
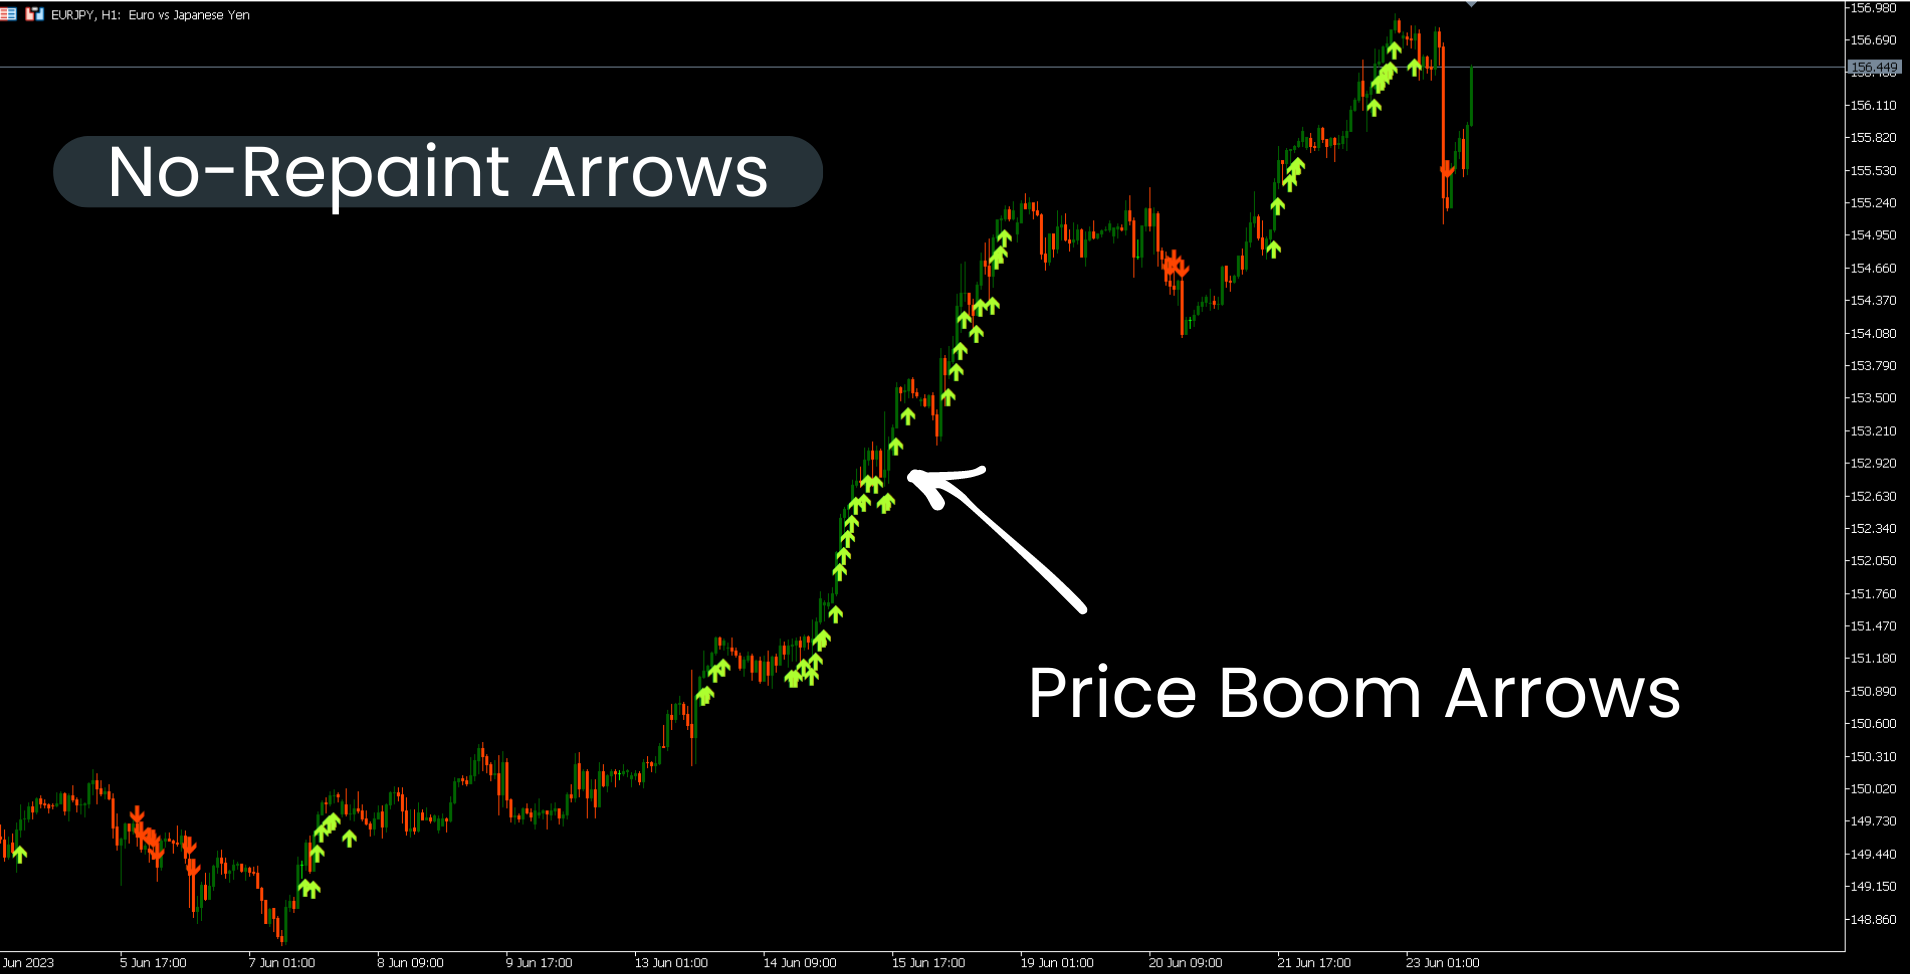
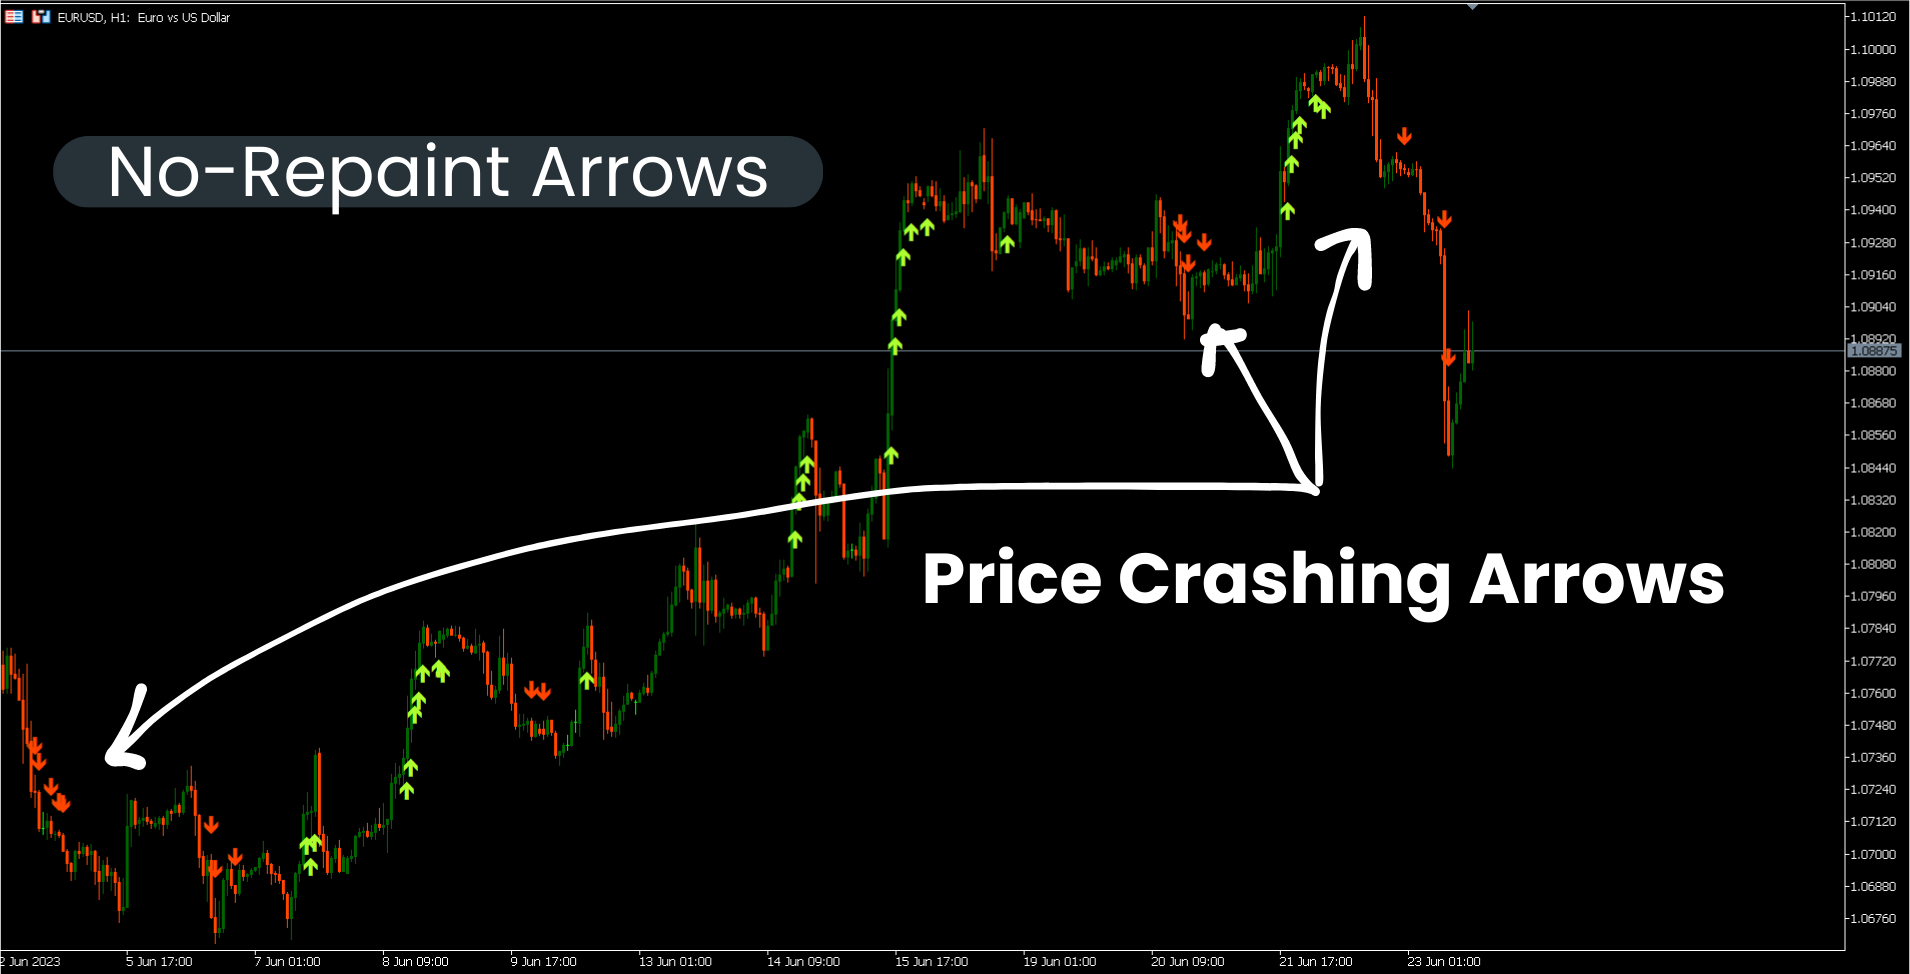
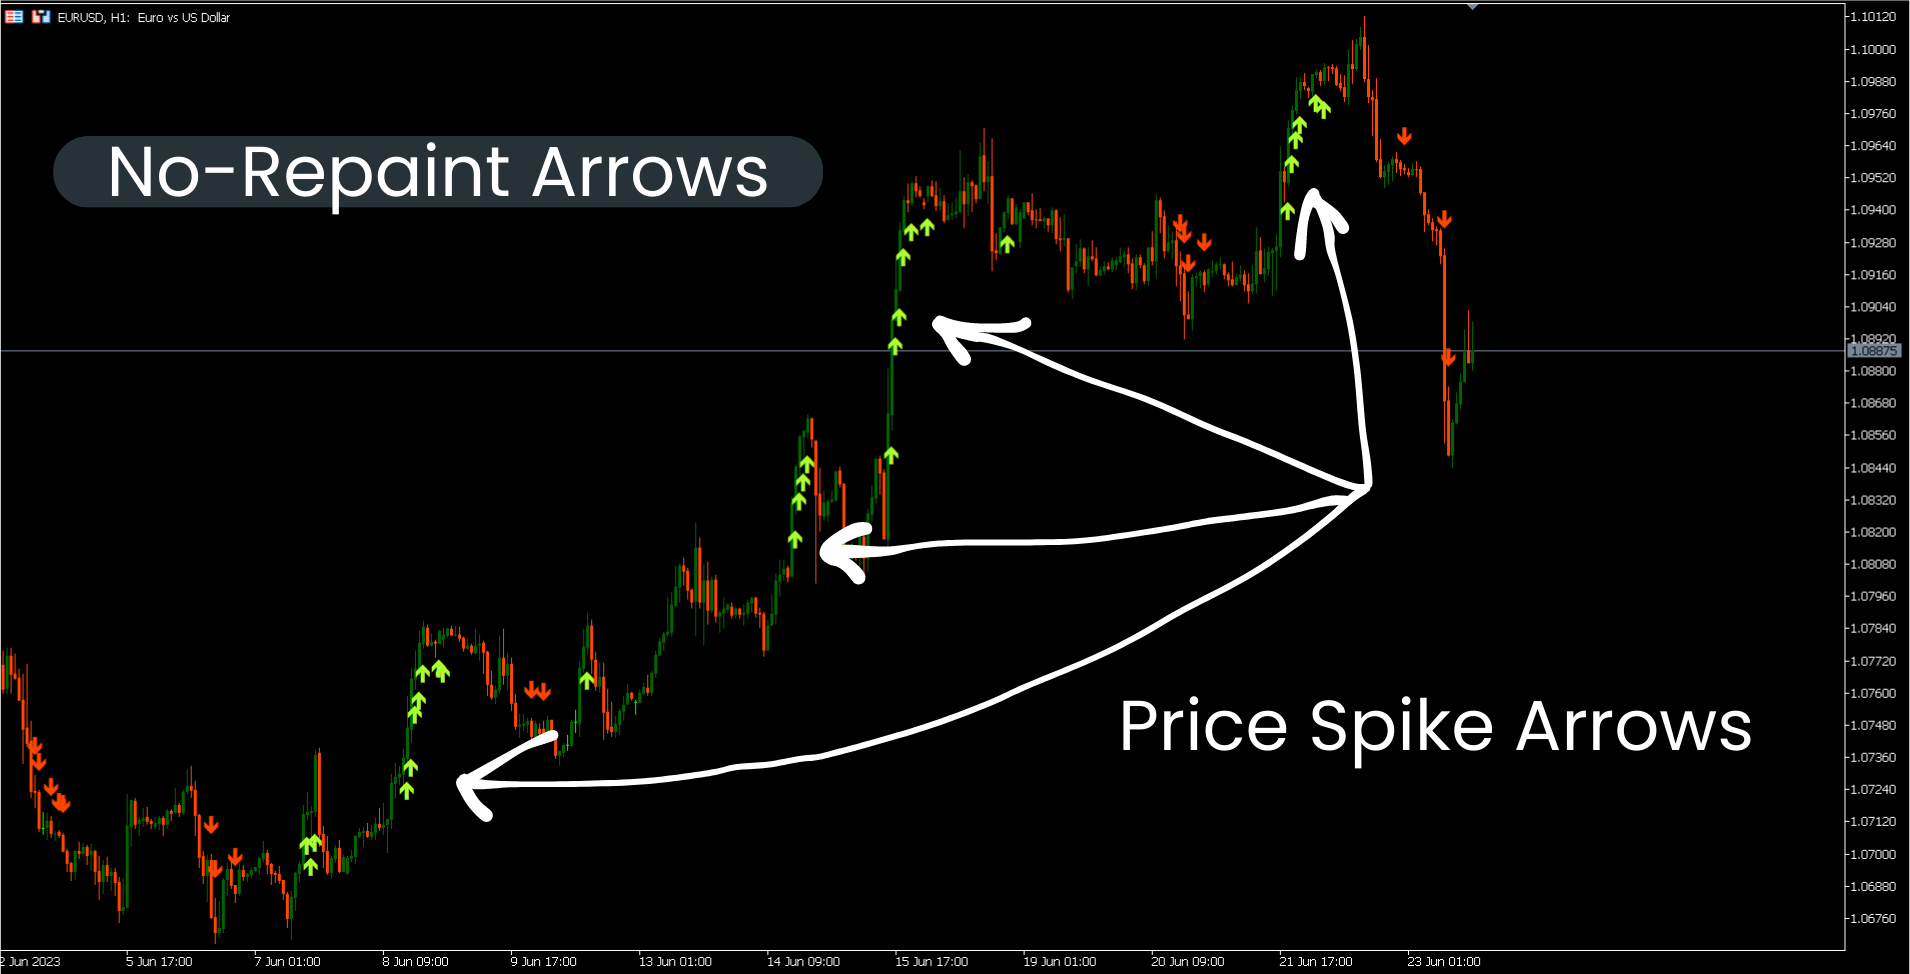
L'indicateur Boom and Crash Spike Detector est codé sur la base d'une stratégie avancée principalement pour détecter le Boom and Crash dans les prix. Des algorithmes complexes ont été implantés pour détecter les booms et les crashs à haute probabilité dans les prix. Il alerte sur d'éventuelles phases de Boom ou crash :
- Phase de Boom : Lorsque le prix augmente trop vite.
- Crash Phase : Lorsque le prix baisse trop vite.
OFFRE À DURÉE LIMITÉE : L'indicateur est disponible pour seulement 30$ et à vie.
Principales caractéristiques
- Envoie des notifications push au téléphone mobile
- Alertes contextuelles et sonores sur ordinateur ou ordinateur portable
- Affiche des flèches non repeintes (flèches vers le haut pour un boom potentiel et flèches vers le bas pour un crash potentiel)
- Travailler avec toutes les paires.
Recommandation
- Période : S1 et S4
- Paires recommandées : Paires en phase de tendance.
Contact
Si vous avez des questions ou si vous avez besoin d'aide, contactez-moi par message privé.
Auteur
SAYADI ACHREF , ingénieur logiciel fintech et fondateur de Finansya.

P0werful indicat0r, f0r b00m and crash H1 H4 Thumb up!