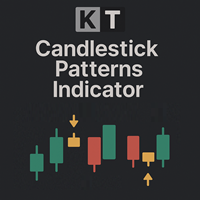
KT Candlestick Patterns MT5

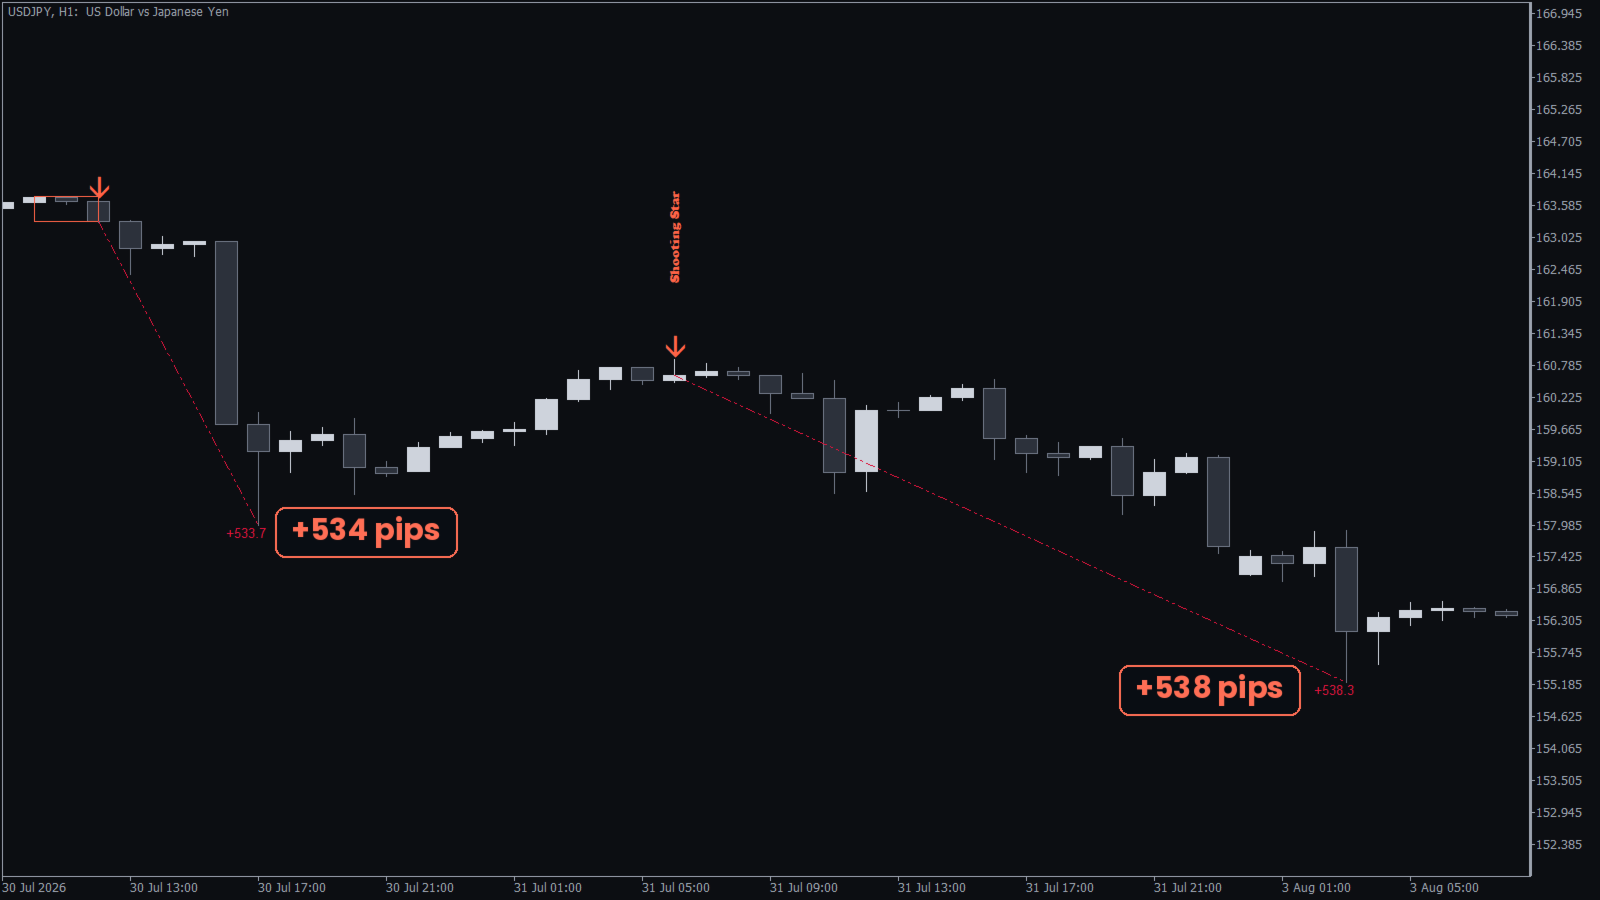
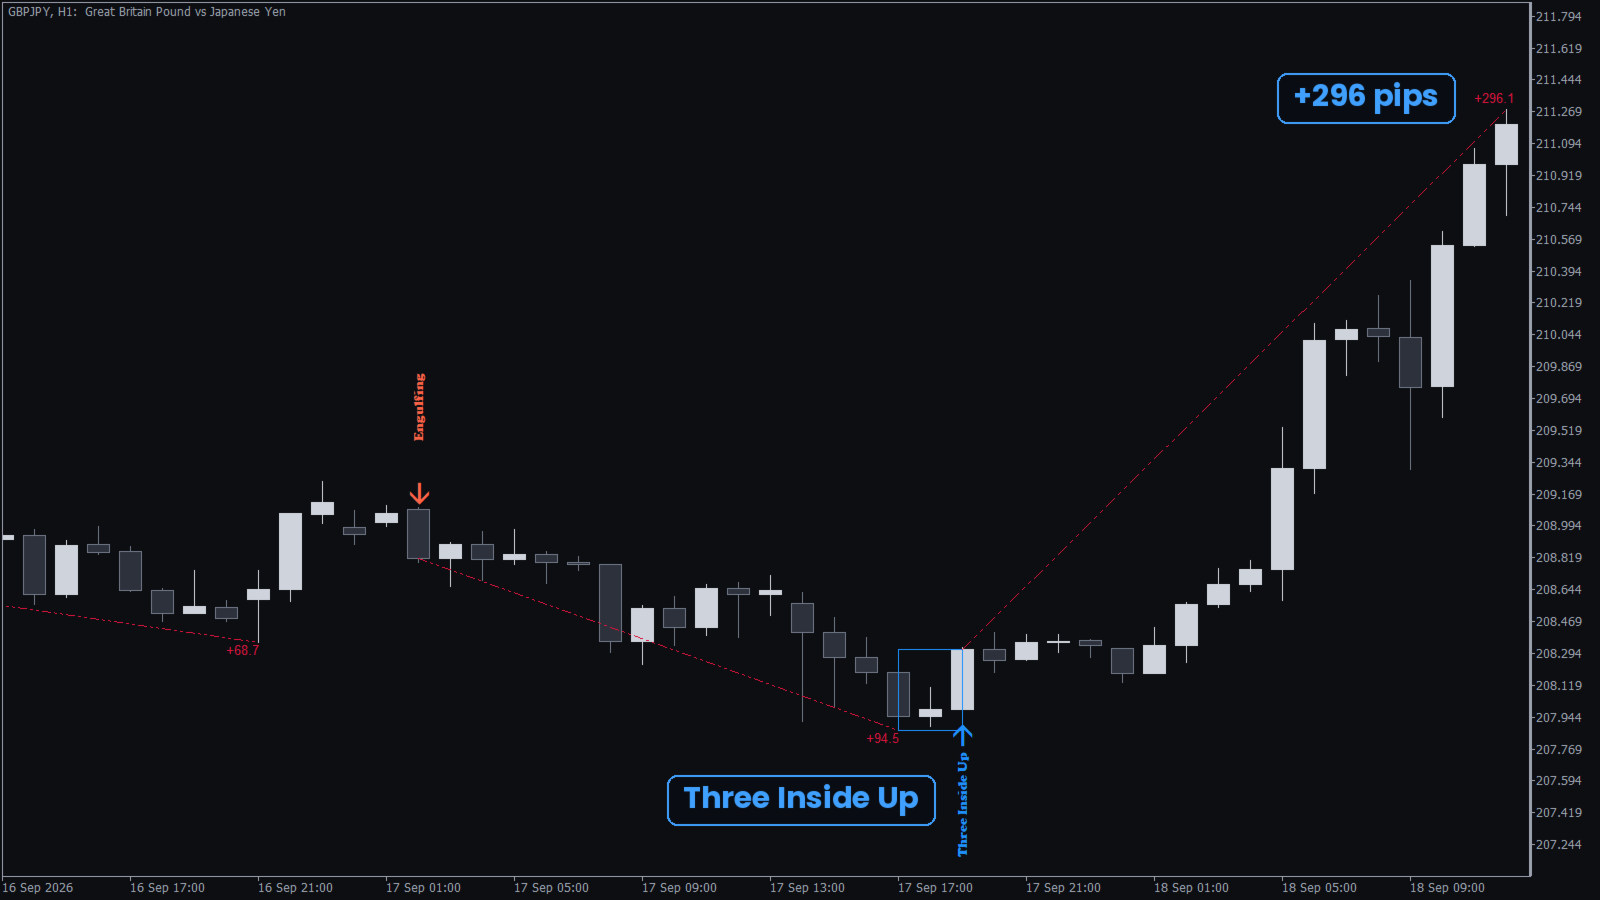
A candlestick pattern indicator for MetaTrader that shows you which patterns are worth trading on your symbol. It marks 24 Japanese candlestick patterns and writes on the chart how many pips price moved after every signal.

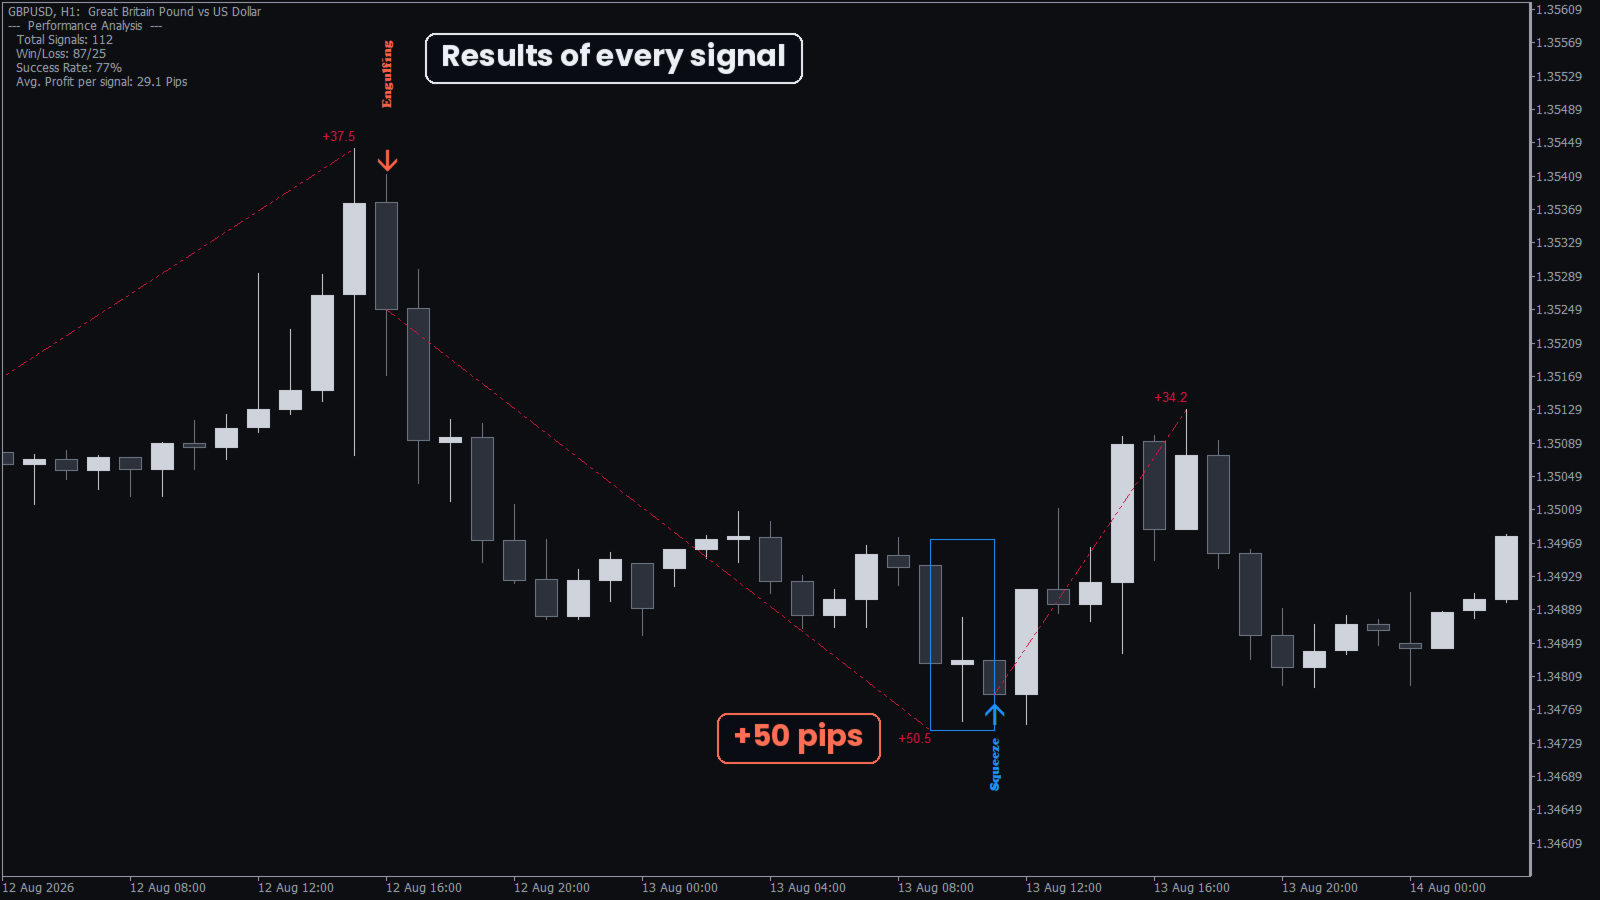
A panel in the corner of the chart turns those results into a record: total signals, wins, success rate and average pips per signal, measured against the target you set. You see what each pattern did on your symbol and timeframe before you take the next one.

What you get

  • 24 candlestick patterns: Engulfing, Hammer and Shooting Star, Morning Star, Three White Soldiers, Kicker, Piercing, Marubozu, Fakey Breakout and more, plus four Doji types.
  • Signals only where a reversal can happen: a reversal pattern gets an arrow only after a move in the opposite direction, so a Hammer in the middle of a rally is left alone.
  • No repainting: a pattern is confirmed when its last candle closes, and the arrow, the pattern name and the box stay where they were drawn.
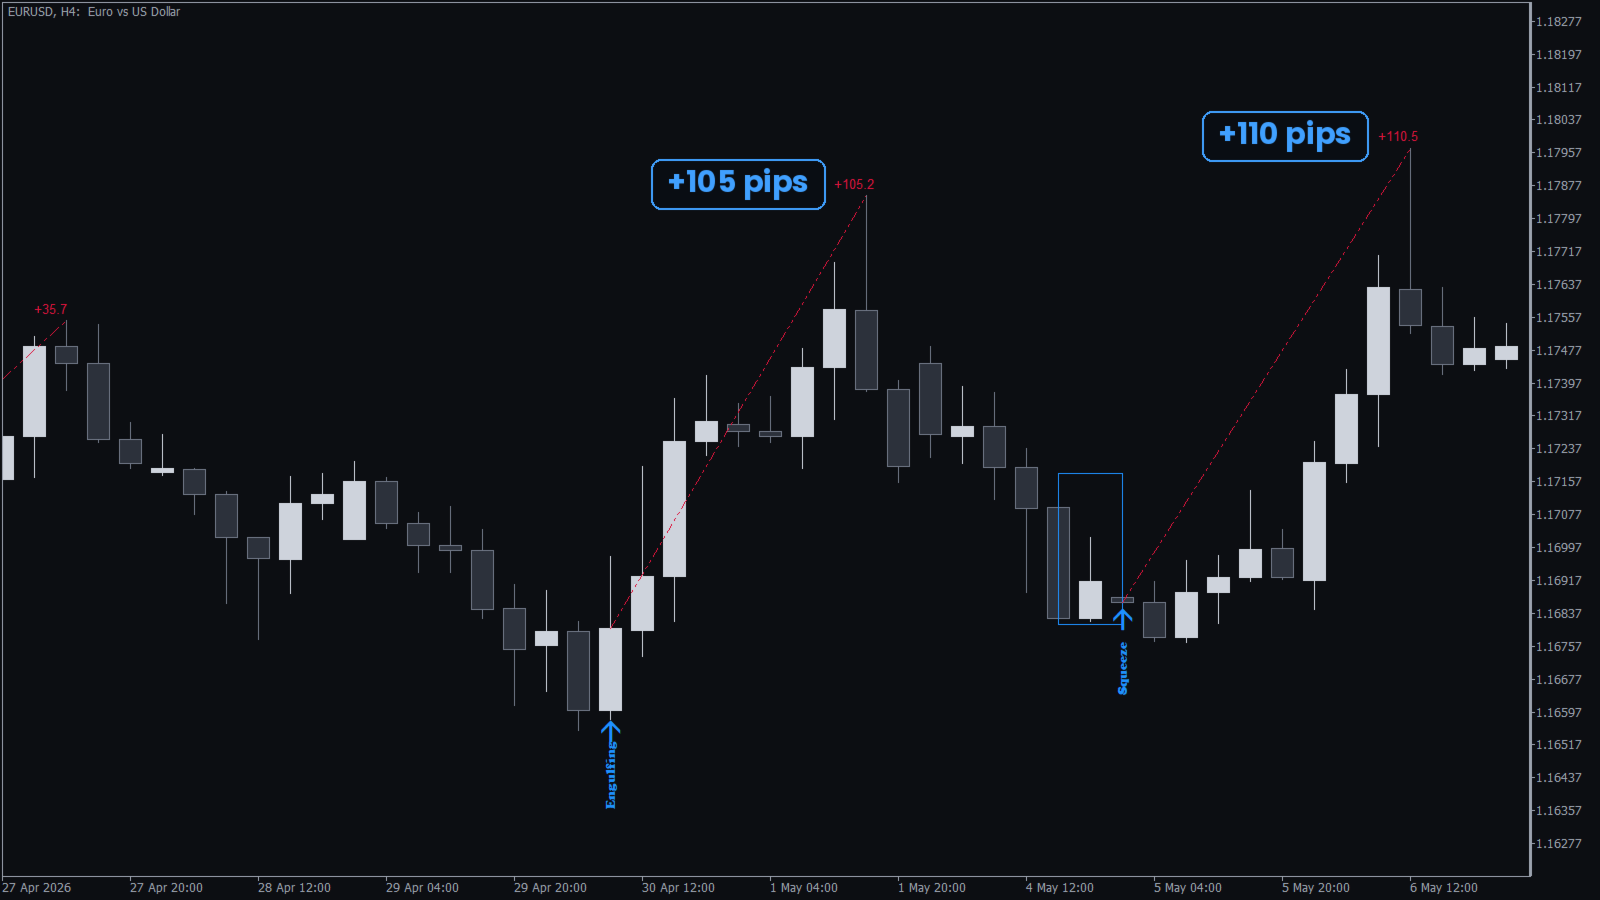
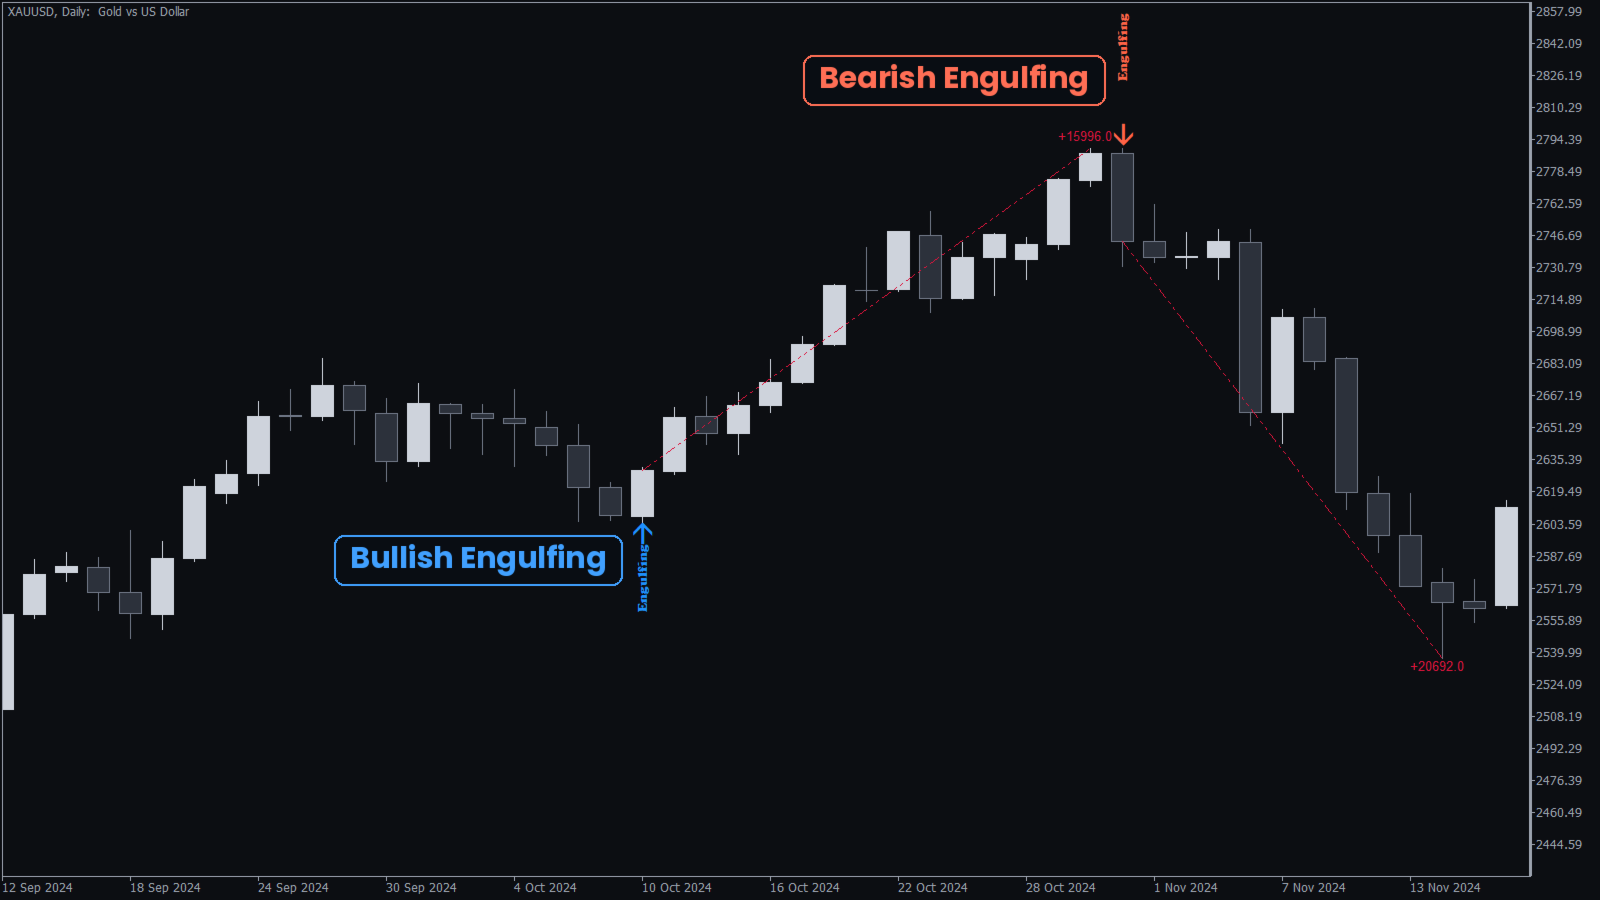
  • A result for every signal: a line follows price after each signal, with the pips written at its end, so you can judge a pattern by scrolling back through your chart.
  • Your own success benchmark: enter the pips you want from a trade, and the panel counts how many signals reached it.
  • Doji candles kept apart: the four Doji types get a yellow dot as a sign of indecision, never a buy or sell signal.
  • Alerts on the closed candle: popup, sound, email and push notifications with the symbol, the timeframe and the pattern name.

How to use it

Attach the indicator to your chart. A blue arrow below the candles marks a bullish pattern, a red arrow above the candles marks a bearish pattern, and a box surrounds the candles that formed it. Set Success Benchmark Pips to the move you want from a trade, then read the panel.

Keep the patterns that work on your chart. Switch the patterns off one at a time in the inputs, and when the success rate rises without a pattern, leave that pattern off. Place your stop loss a few pips beyond the pattern box, where the pattern would fail.

Recommendations

The indicator works on every symbol and timeframe in MetaTrader, including forex pairs, gold, indices and crypto. Start on H1 or a higher timeframe and raise Min. Bars Between Patterns when you want fewer signals and a cleaner chart. Your EA can also read the buy signal, the sell signal and the pattern code.

Input parameters

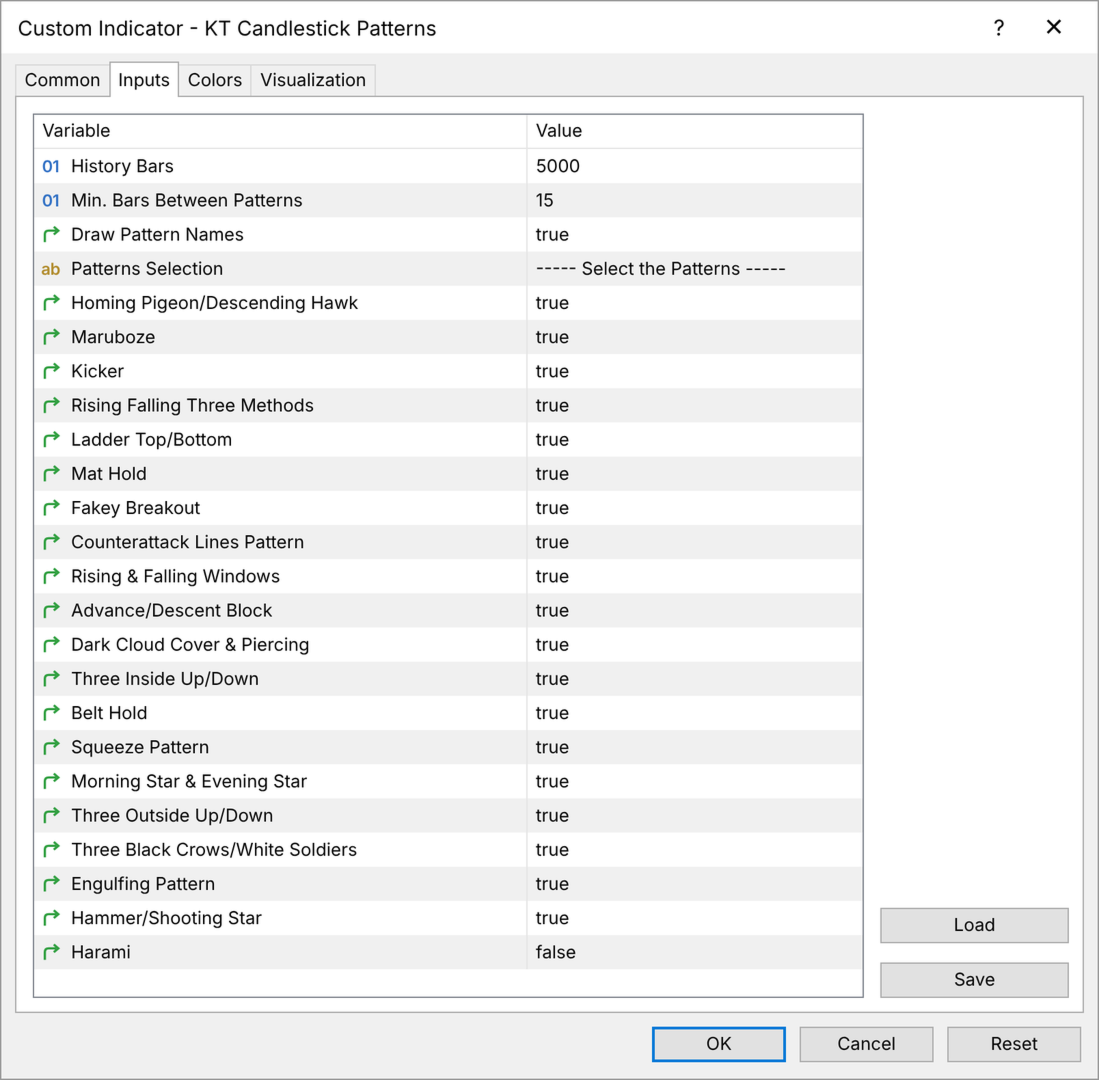
  • History Bars: how many candles are checked for patterns and counted in the record.
  • Min. Bars Between Patterns: the smallest gap between two signals (15 by default).
  • Draw Pattern Names: writes the name of each pattern on the chart.
  • Pattern switches: switch each of the 20 patterns and the four Doji types on or off. Harami is off by default.
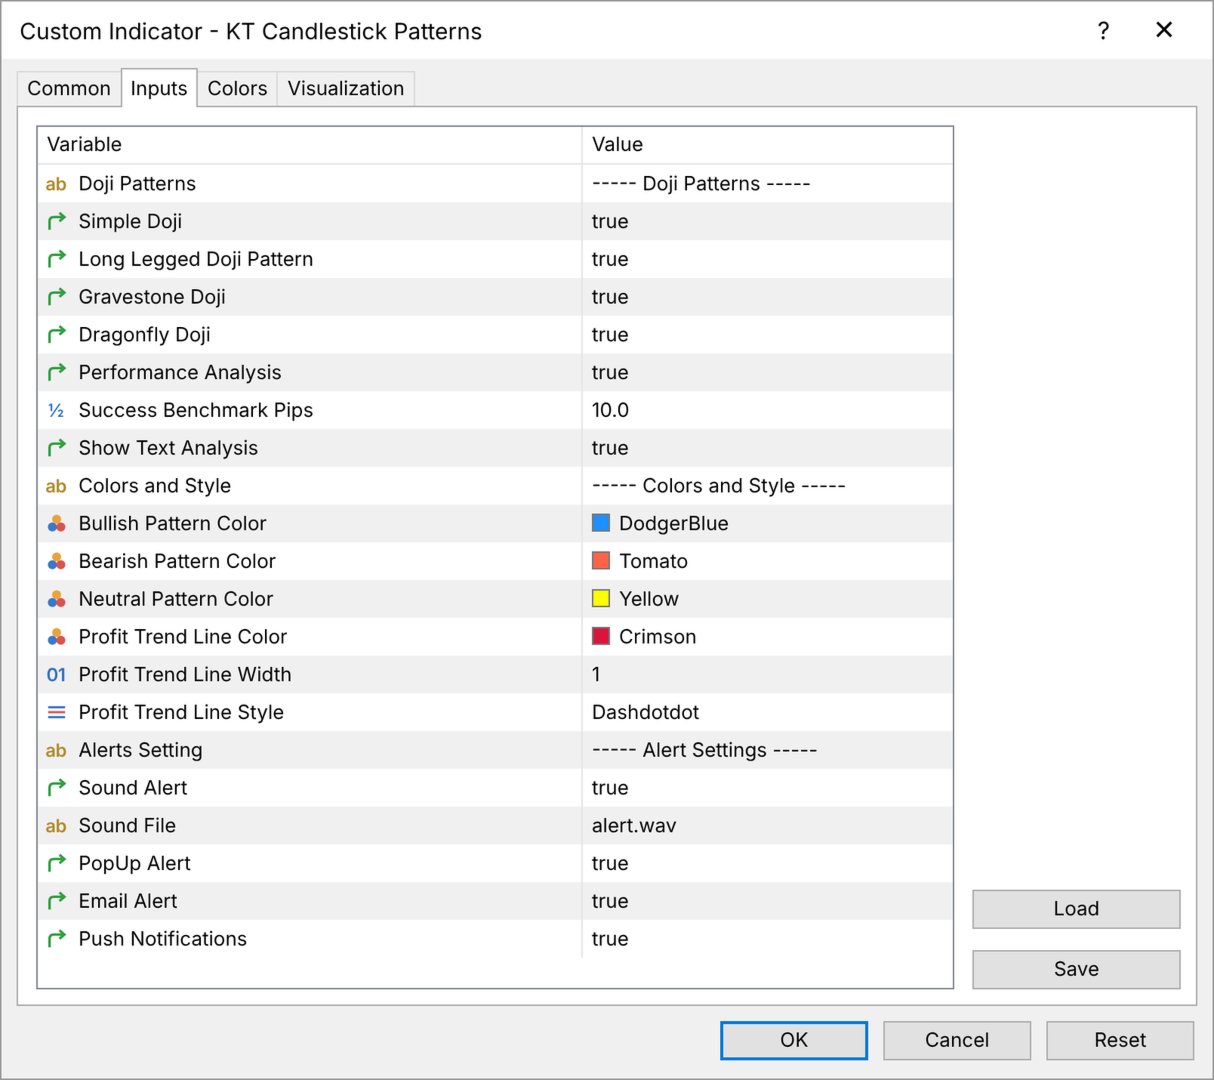
  • Performance Analysis: draws the result line of every signal and keeps the record.
  • Success Benchmark Pips: the pips a signal must move in its direction to count as a win (10 by default).
  • Show Text Analysis: shows or hides the record panel.
  • Colors and style: the colors of bullish, bearish and neutral patterns, and the color, width and style of the result line.
  • Alerts: sound with your own sound file, popup, email and push notifications.

Let your own chart pick the patterns

You get 24 candlestick patterns marked where they make sense, an alert the moment one forms on a closed candle, and the result of every past signal on your own chart. Keep the patterns that reach your target, and trade the next signal with the record behind it.
Recommended products
Multi-Confluence Reversal Alert | RSI + Heikin Ashi + Divergence + Key Levels | SL/TP Lines | No Repaint Confluence Reversal Alert is a professional-grade reversal detection indicator for MetaTrader 4. It combines five powerful trading concepts into a single, clean alert system — giving you high-probability reversal signals with automatically drawn Entry, Stop Loss, and Take Profit levels directly on your chart. Designed for traders who use VSA (Volume Spread Analysis), price action, and multi-
KillzoneLens - ICT Killzones for MT5 The ICT killzones are the hours when the big players move the market: the London open and the New York open above all. KillzoneLens draws them on your chart in the right place every day, converting New York time to your broker's server time automatically, including the US and European daylight-saving changes. Killzones (New York time, all adjustable) - Asian 20:00-00:00, London open 02:00-05:00, New York open 07:00-10:00, London close 10:00-12:00. - A colo
[b]Titan Pro V7 Institutional Dashboard[/b] is an advanced quantitative HUD terminal engineered for MetaTrader 5, designed for institutional market analysis, quantitative prop-firm verification, and disciplined intraday execution. Unlike conventional single-formula indicators that suffer from lag and market regime shifts, Titan Pro V7 synthesizes a multi-strategy quantitative consensus model combining Trend Momentum, Volatility Breakout, Intraday VWAP, and Smart Money Concepts (SMC) into a sin
JC OB Strategy turns your MetaTrader 5 chart into a complete Order Block engine: it finds institutional demand and supply zones, and the moment an Order Block is confirmed it opens a trade plan with ENTRY, STOP LOSS and three take-profit targets on the chart. WHAT IT DOES - Order Block detection (SMC/ICT engine): a bullish OB is a bearish candle followed by a strong bullish confirmation candle that closes above its high; a bearish OB is the mirror image below the low. Optional classic swing-base
Neuro Future
Sergey Rozhnov
Neural Network Indicator with Built-In Learning. This is a real autonomous artificial intelligence system  powered by a multi-level customizable perceptron and advanced training settings to predict future price changes. You can train the indicator yourself on any finansial symbol, everything you need is collected in this tool and conveniently implemented with automatic mode and presets. Major update v2.0 - 2.5 has been released. Advanced input features: Added support for indicators. Now you can
AutoTrend Pro
Aram Hussein Mohammed
TL Method — Automatic Trendline Detection & Strength Indicator Tired of drawing trendlines manually? TL Method does it for you — automatically detecting, drawing, and scoring trendlines in real time. What it does: Scans up to 1000 bars to find valid support and resistance trendlines Scores each trendline by counting confirmed anchor touches Generates buy/sell signal arrows when price approaches strong trendlines Alerts you via popup, push notification, or sound — with smart cooldown to avoid spa
Candle Pattern Pro MT5
Komang Putra Riswanjaya
Description : In the world of trading, candlestick patterns are a popular technical analysis tool used by many traders.   There are numerous candlestick patterns, ranging from reversal patterns to continuation patterns. However, remembering all these patterns can be challenging, especially for novice traders. This often leads to traders having to manually memorize and identify candlestick patterns, which can be time-consuming and prone to errors. Candle Pattern Pro is a powerful indicator desig
Overview Break Legs and Order Block Finder is a cutting-edge market structure indicator for MetaTrader 5, tailored for smart money traders, structure-based traders, and institutional-style strategies. It automatically highlights critical market events – from Break of Structure (BOS) and Market Structure Shift (MSS) to Fair Value Gaps (FVGs) and Order Blocks (OBs) – directly on your charts. Designed for professional and serious retail traders, this tool delivers clarity in real time, helping you
VibeFox Inside Bar — mother-bar coil breakout with automatic entry points VibeFox Inside Bar is a real-time price-action indicator for MetaTrader 5. It detects the classic inside-bar pattern, draws a clean rectangle around every mother bar that contains a coil of inside bars, and marks the exact moment price breaks out of that range right on the chart. All controls are gathered into one modern interactive panel, so instead of scanning candle by candle you see each compression setup and its break
IQ FX Gann Levels a precision trading indicator based on W.D. Gann’s square root methods . It plots real-time, non-repainting support and resistance levels to help traders confidently spot intraday and scalping opportunities with high accuracy. William Delbert Gann (W.D. Gann) was an exceptional market analyst, whose trading technique was based on a complex blend of mathematics, geometry, astrology, and ancient mathematics which proved to be extremely accurate. We don't offer free or bonus indic
SMC Order Block Delta Validator - Flow-Based Confirmation Are you tired of seeing your traditional Order Blocks broken without any price reaction? Most SMC indicators fail because they look only at chart structure, ignoring what truly moves the market: Volume and Aggression. The SMC Order Block Delta Validator is the first Smart Money Concepts indicator that validates each order block by analyzing the flow microstructure within the origin candle. It calculates the POC (Point of Control), D
KT Inside Bar MT5
KEENBASE SOFTWARE SOLUTIONS
KT Inside Bar plots the famous inside bar pattern in which the bar carries a lower high and higher low compared to the previous bar. The last bar is also known as the mother bar. On smaller time-frames, the inside bar sometimes appears similar to a triangle pattern. Features Also plots entry, stop-loss, and take-profit levels with the inside bar pattern. No complex inputs and settings. Erase unwanted levels when the price reaches the entry line in either direction. All Metatrader alerts include
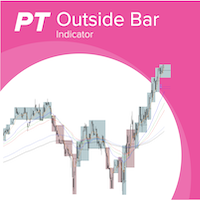
Outside bars  (Außenstäbe)  are important in professional price action trading and were made popular by Michael Voigt.  Highs and lows of outside bars ( Aussenstäbe ) can be utilized as entry and exit for trades following different strategies. With combining different timeframes you can more easily detect the overall trend of the market, see potential resistance and support levels and also detect change in trend and framing of the market.  Examples for strategies with inside bars (Innenstäbe) an
Crypto_Forex Indicator "Breakout Bar pattern" for MT5, No repaint, No delay. - Indicator "Breakout Bar pattern" is very powerful indicator for Price Action trading. - Indicator detects Breakout Bar patterns on chart: - Bullish Breakout Bar pattern - Blue arrow signal on chart (see pictures). - Bearish Breakout Bar pattern - Red arrow signal on chart (see pictures). - With PC alerts and Mobile notification. - Indicator "Breakout Bar pattern" is excellent to combine with Support/Resistance Levels
Chart Patterns Builder Premium
Florea E. Sorin-Mihai Persoana Fizica Autorizata
The Chart Patterns Builder Premium expert advisor is an extension of the freely available Chart Patterns Builder Basic :         it provides 1 new chart pattern: the rectangle breakout (besides the double top & bottom pattern already provided in the basic edition);         in most configurations, backtesting usually shows more than double (2x) average yearly return rate;         the account growth curve is also smoother, due to approximately double number of trades,  compared to the free version
CRT Multi-Timeframe Market Structure & Liquidity Sweep Indicator Non-Repainting | Multi-Asset | MT4 Version Available Full Setup Guide:   https://www.mql5.com/en/blogs/post/767525 MT4 Version: https://www.mql5.com/en/market/product/162556 Indicator Overview CRT Ghost Candle HTF Fractal is a complete institutional-grade market structure toolkit for MetaTrader 5. It projects higher-timeframe candle structure, CRT trap levels, session levels, previous period highs and lows, pivot points, and a re
Bastion Sentinel Core
Matthew David Cracknell
Bastion Sentinel Core — Daily Zones, 4-Hour Rejection Signals Overview Bastion Sentinel Core identifies supply and demand zones on the Daily timeframe — price levels where the market has previously attempted to break through and failed — and marks non-repainting BUY/SELL arrows when price re-tests and rejects those zones on the 4-Hour timeframe. Timeframes are fixed in this edition: zones are always mapped from Daily, and rejections are always confirmed on the 4-Hour close.  This is an analysis
Yawabeh SD Pro –  Professional Supply and Demand Indicator Trade Smarter with Volume-Confirmed Supply/Demand Zones Our institutional-grade algorithm identifies high-probability reversal zones before price reacts, giving you the edge in Forex, Crypto, and Stocks. Key Features Multi-Timeframe Confirmation – View trend strength across multiple timeframes simultaneously – Align your trades with higher timeframe momentum Smart Alert System – Real-time notifications for: – Strong demand/supply zone
Supertrend Volume Confirm
Isaac Alexander Pinero Garcias
DESCRIPTION Supertrend Volume Confirm — Trend Signals Confirmed by Volume and RSI Supertrend Volume Confirm is a buy/sell signal indicator based on the classic Supertrend, with two additional confirmation filters: volume and RSI. Unlike more complex multi-timeframe systems, this indicator works on a single timeframe, designed for traders who want something direct and easy to read. It works on any market symbol (forex, gold, indices, stocks, crypto) thanks to its default use of tick volume, unive
SR Zones Sync: Support & Resistance Zones with Break-on-Close Logic SR Zones Sync automatically draws support and resistance zones from swing pivots, then recolours them when price actually breaks through. Only a fully closed candle can break a zone, so wicks and the still-forming candle never trigger a false signal. How it works Zones are built by clustering swing highs and lows into price areas. Each zone’s thickness adapts to the average candle range. Each zone gets a role from its latest pi
Tma Poc Gold
Ignacio Agustin Mene Franco
POC + TMA SCALPER GOLD - Expert Advisor Professional DESCRIPTION: Automated trading system designed specifically for XAU/USD, combining Point of Control (POC) with Triangular Moving Average (TMA) to identify high-volume and trending zones. It uses advanced risk management with dynamic trailing stops and an intelligent grid system. TECHNICA
MTF Liquidity Rays Pro
Michael Bauer-schafer
MTF Liquidity Rays Pro — Stop Manually Drawing Liquidity Areas The "Liquidity Trap" of Manual Charting: As a price action trader, you know that liquidity is the fuel of the market. But let’s be honest: manually scanning Weekly, Daily, and 4-hour charts every morning to draw your rays is tedious, prone to human error, and mentally draining. By the time you’ve mapped out your levels, the trade setup has often already moved. Worse yet, how many times have you missed a trade because you forgot to de
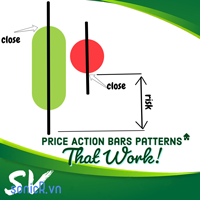
The problem with trading candlestick patterns becomes obvious, after some experience in live markets. Hypothetical branching of candlestick patterns, are not necessary for successful trading. As a Price action trader, my principle is to keep things simple and consistent. My focus is on buying and selling pressure, which is visible in market structure. Trade Management and discipline are my secondary core elements. This indicator detect 4 Simple but Effective Price action Patterns! Yellow = Insi
Non-Repainting Buy Sell Signal Indicator for MT5 with Trade Plan and Real Statistics Most signal indicators promise win rates. Guardian Signal shows you facts: every signal it has printed on your chart, and what actually happened afterwards. No repainting, no deleted arrows, no fantasy statistics — just an honest tool for disciplined traders. What you get with every signal: BUY/SELL arrow printed only on bar close — and never changed or removed afterwards (strict non-repainting) A complete trade
Harmonic Patterns SwingCore Pro | For MetaTrader 5 (MT5) Technical analysis indicator for detecting and visualizing harmonic patterns on the chart, with Fibonacci level projection and configurable alert system. ================================================================================ WHAT THIS INDICATOR IS It is a visual analysis tool. Its function is to identify structures on the chart that satisfy the geometric relationships of six classic harmonic patterns: Gartley, Bat, Butterfly
SwingCross
Subho Adhikary
Short description (one line) ZigZag-style swing indicator that plots swing highs/lows, leg midpoints, range labels and dynamic Small/Medium/Large target levels with a latched target-chaser line. Full description Swing Cross is a highly customizable ZigZag-style indicator that identifies swing highs and lows, draws the connecting legs, and automatically builds dynamic target levels from your symbol's recent leg-range history. How it works Detects local swing highs/lows using the classic ZigZag
The ZigZag Buy Level is a specialized tool for traders who utilize market structure and classic ZigZag patterns to define key support and entry points. It automatically identifies "Main Highs"—significant highs confirmed by the subsequent price action—and then calculates a high-probability "Buy Level" based on a specified percentage pullback from that Main High to the last corrective low. This indicator helps you anticipate deep retracement entries, clearly marking them on the chart with labels
Deep State Regime Classifier
Matheus Rodrigues Satriano
Deep State Regime Classifier paints the candles of your chart according to the market regime detected on each closed bar. It is a deterministic, rule-based classifier built on well-known statistics: a rescaled-range estimate of the Hurst exponent, a fractal dimension index (FDI), the standard deviation of price changes and momentum. The same data always produces the same colors. How it works For each closed bar the indicator looks back over a configurable window (default 144 bars) and calculates
Pattern Oracle
Fwaz A A Almebyad
Pattern Oracle is an all-in-one chart pattern engine for MetaTrader. It scans three zigzag levels at once, finds more than 30 harmonic, chart, continuation and reversal patterns, scores every setup and draws a complete trade plan with entry, stop-loss and two take-profit levels. A built-in teaching mode explains every pattern right on the chart. Pivots are only used once they are confirmed and every decision is made on a closed bar, so signals do not repaint . Patterns detected Reversal : Double
How It Works DoctorEdge Asia-London-NY Buy & Sell Arrows Breakout is a professional indicator that identifies real breakout signals during the three most important trading sessions: Asia, London, and New York . The indicator automatically draws: Vertical lines showing the start and end of each session. Dashed horizontal lines marking the highs and lows formed within each session. Based on this session structure, it generates automatic BUY & SELL arrows , pointing to potential breakout zones ,
Buyers of this product also purchase
Trend Sniper X
Sarvarbek Abduvoxobov
4.86 (44)
Trend Sniper X is a multi-timeframe trend-following indicator for MetaTrader 5 that helps traders identify trend direction and potential reversal points with clarity and precision. for MT4: https://www.mql5.com/en/market/product/193245 Price Information: The current price is promotional and is subject to change as upcoming updates and new features are released. Bonus Offer: To get the FREE Auto-Trade Assistant EA for this indicator, please message the author after purchasing. Code2Profit Channe
Entry Points Pro shows you where to enter, where to put the stop and what lot to trade — before you place the order. PRICE Now 199 USD: 8 copies at this price, then 249 USD. The final price is 349 USD. I make my money trading the markets, and I show it, so I don't need to sell this indicator to everyone. It is a tool for traders who think for themselves, not a magic button. No breakout, no trade. A gray arrow is a cancelled signal: price did not break the signal candle, so there was no entry
Ultra Indicator
Ihor Otkydach
5 (1)
ULTRA is a technical indicator that operates on an “all-in-one” basis—it independently analyzes the market, generates trading signals, displays levels for setting stop-loss orders, and suggests when to close trades to lock in profits or minimize losses. In other words, it doesn't matter if you don't know how to analyze the market, determine levels—where to set your stop-loss—or struggle with money management. ULTRA will do all of that for you! BUYER BONUS: After purchasing the ULTRA indicator, s
Gann Made Easy   is a professional and easy to use Forex trading system which is based on the best principles of trading using the theory of W.D. Gann. The indicator provides accurate BUY and SELL signals including Stop Loss and Take Profit levels. You can trade even on the go using PUSH notifications. PLEASE CONTACT ME AFTER PURCHASE TO GET TRADING  INSTRUCTIONS   AND GREAT EXTRA INDICATORS  FOR FREE! Probably you already heard about the Gann trading methods before. Usually the Gann theory is a
Boba Analysis Suite
Trade Ready Solutions LLC
5 (2)
Boba Analysis Suite Boba Analysis Suite is an analytical indicator for MetaTrader 5. It brings market structure, relevant price zones and broader market context together in a single chart view. Developed through practical experience as a trader and trading coach, it supports a structured analysis process: assessing market direction, identifying important levels and considering multiple timeframes together. Analysis in Context Individual signals gain meaning through context. Boba Analysis Suite h
Azimuth Pro
Ottaviano De Cicco
5 (7)
Azimuth Pro V2: Synthetic Fractal Structure and Confirmed Entries for MT5 Overview Azimuth Pro is a multi-level swing structure indicator by Merkava Labs . Four nested swing layers, swing-anchored VWAP, ABC pattern detection, three-timeframe structural filtering, and closed-bar confirmed entries — one chart, one workflow from micro-swings to macro-cycles. This is not a blind signal product. It is a structure-first workflow for traders who care about location, context, and timing. 1. What Change
FiboSniper Pro
Van Minh Nguyen
5 (4)
FiboSniper Pro - Multi-Filter Fibonacci System with Auto SL/TP and Control Panel FiboSniper Pro is a technical indicator that combines dynamic Fibonacci Envelopes with multiple confirmation filters to generate selective Buy and Sell signals. Fibonacci levels are calculated from Moving Average and ATR, then filtered by ADX, EMA, RSI, ATR, Volume, Time and Candle structure. The indicator displays automatic ATR-based Stop Loss and Take Profit levels directly on the chart, along with an interactive
M1 Sniper MT5
Oleg Rodin
5 (7)
M1 SNIPER  is an easy to use trading indicator system. It is an arrow indicator which is designed for M1 time frame. The indicator can be used as a standalone system for scalping on M1 time frame and it can be used as a part of your existing trading system. Though this trading system was designed specifically for short-term trading, it still can be helpful for all traders. This trading system can be used with any forex pair and time frame, though lower time frames are recommended from M1 up to M
Apex Patterns PRO Buy Indicator - Get Expert Advisor Based on it for FREE. Self-Optimizing Chart Pattern & Breakout Intelligence Traditional pattern scanners rely on fixed inputs, often underperforming when market volatility and structures shift. Apex Patterns PRO is designed to adapt to changing market conditions by combining structural chart pattern recognition, momentum filtering, and statistical self-optimization into one analytical framework. Adaptive Scanning Engine Self-Optimizing Patter
SQN Max indicator for MT5 by ITC
Renaud Herve Francois Candel
Sqn Max Indicator Sqn Max is an exclusive indicator to trade the market with high effectiveness. The indicator is based on price action, volatility and trend. This indicator is as simple as possible but not too simple. The indicator can generate alerts to ease the trading process. You don't have to stay all day in front of your screen. The indicator can be used with any class of assets and with any time frame. It is possible to achieve better results trading our list of selected assets. We achi
Adaptive Price Action Engine Buy Indicator- Get EA Based on it for FREE. Self-Optimizing Multi-Timeframe Trend & Candlestick Intelligence Markets do not behave the same way all the time—and not every price-action pattern has the same value in every market regime. Adaptive Price Action Engine is designed to adapt to changing market conditions by combining trend structure, multi-timeframe analysis, candlestick patterns, and statistical optimization into one analytical framework. Two Adaptive Mode
Divergence Bomber
Ihor Otkydach
4.89 (94)
Each buyer of this indicator also receives the following for free: The custom utility "Bomber Utility", which automatically manages every trade, sets Stop Loss and Take Profit levels, and closes trades according to the rules of this strategy Set files for configuring the indicator for various assets Set files for configuring Bomber Utility in the following modes: "Minimum Risk", "Balanced Risk", and "Wait-and-See Strategy" A step-by-step video manual to help you quickly install, configure, and
Power Candles MT5
Daniel Stein
4.58 (12)
Power Candles - Self-Optimizing Strength Indicator Strength usually lives in a sub-window. The line runs below, the candle above, and your eye keeps connecting the two. Power Candles puts the strength into the candle itself, colored from dark red to dark green, so the chart reads at a glance and the sub-window stays closed. The indicator also finds its own settings for the symbol and timeframe in front of you. One click on [ Apply Best ] draws entry, Stop Loss and Take Profit at the exact prices
Currency Strength Wizard   is a very powerful indicator that provides you with all-in-one solution for successful trading. The indicator calculates the power of this or that forex pair using the data of all currencies on multiple time frames. This data is represented in a form of easy to use currency index and currency power lines which you can use to see the power of this or that currency. All you need is attach the indicator to the chart you want to trade and the indicator will show you real s
Naked Forex Tweezer Pro Indicator Tweezer Pro Indicator is a pattern recognition indicator for Forex, Stocks, Indices, Futures, Commodities and Cryptos. The standard Tweezer is a two bar pattern. Our enhanced version is a multi-bar pattern. We filter the patterns for you so that you only get the     best and most effective patterns   and ignore the noise. The Tweezer pattern is a simple and effective pattern to trade. The strategy that comes with the Tweezer is based on price action. The Twe
Auto Optimized SpeedAngle is an institutional-grade momentum vectoring system that eliminates curve-fitting through continuous Walk-Forward Optimization (WFO). Rather than relying on static inputs that degrade when market regimes shift, the indicator dynamically recalibrates its parameters using Out-of-Sample (OOS) validation, ensuring the displayed signals represent genuine statistical edges rather than historical anomalies. By shifting the focus from subjective visual angles to normalized, qua
Multi Currency Strength and Momentum Indicator MT5 Dynamic Forex28 Navigator is the evolution of our long-time, popular indicators, combining the power of five in one: Advanced Currency Strength28 Indicator (700 reviews) Advanced Currency IMPULSE with ALERT (530 reviews) Currency Strength EXOTICS GOLD Impulse with Alert CS28 Combo Signals (recent Bonus) No need to buy four indicators and stack them on your charts. All of it is merged into one powerful indicator: the strength of the 28 Forex pair
ARICoins
Temirlan Kdyrkhan
ARICoin is a powerful trading companion designed to generate high-probability entry signals with dynamic TP/SL/DP levels based on volatility. Built-in performance tracking shows win/loss stats, PP1/PP2 hits, and success rates all updated live. Key Features: Buy/Sell signals with adaptive volatility bands Real-time TP/SL/DP levels based on ATR Built-in MA Filter with optional ATR/StdDev volatility Performance stats panel (Success, Profit/Loss, PP1/PP2) Alerts via popup, sound, push, or email Cust
PZ Swing Trading MT5
PZ TRADING SLU
5 (5)
Protect against whipsaws: revolutionize your swing trading approach Swing Trading is the first indicator designed to detect swings in the direction of the trend and possible reversal swings. It uses the baseline swing trading approach, widely described in trading literature. The indicator studies several price and time vectors to track the aggregate trend direction and detects situations in which the market is oversold or overbought and ready to correct. [ Installation Guide | Update Guide | Tro
Apollo SR Master is a Support/Resistance indicator with special features which make trading with Support/Resistance zones easier and more reliable. The indicator calculates Support/Resistance zones in real-time without any time lag by detecting local price tops and bottoms. Then to confirm the newly formed SR area, the indicator shows special signal which signalizes that the SR zone can be taken into consideration and used as an actual SELL or BUY signal. In this case the strength of the SR zone
Neuro Poseidon MT5
Daria Rezueva
4.68 (53)
Neuro Poseidon is a new indicator by Daria Rezueva. It combines precise trading signals with adaptive TP/SL levels - creating best possible trades as a result! Message me and get  Neuro Poseidon Assistant  as a gift to automize your trading process! What makes it stand out? 1. Proven profitability on all assets and timeframes 2. Only confirmed BUY and SELL signals present on the chart 3. Adaptive TP & SL levels generated by the software for each trade 4. Easy to understand - suitable for al
SIO Oscillator: Self-Optimizing Semivariance Imbalance Oscillator Buy the indicator and get the Expert Advisor based on it for FREE. Most oscillators treat all price movement the same. SIO separates upside and downside market pressure and measures the imbalance between them, showing which side is really in control: buyers or sellers. When the imbalance reaches an extreme, SIO prints a clear signal with entry, Stop Loss and Take Profit levels. What makes SIO different is that it doesn’t rely on f
Advanced Supply Demand MT5
Bernhard Schweigert
4.53 (15)
Best Solution for any Newbie or Expert Trader! This indicator is a unique, high quality and affordable trading tool because we have incorporated a number of proprietary features and a new formula. With this update, you will be able to show double timeframe zones. You will not only be able to show a higher TF but to show both, the chart TF, PLUS the higher TF: SHOWING NESTED ZONES. All Supply Demand traders will love it. :) Important Information Revealed Maximize the potential of Advanced Supply
ScalpPoint
Temirlan Kdyrkhan
ScalpPoint is a powerful trading companion designed to generate high-probability entry signals with dynamic TP/SL/DP levels based on volatility. Built-in performance tracking shows win/loss stats, PP1/PP2 hits, and success rates — all updated live. Key Features: Buy/Sell signals with adaptive volatility bands Real-time TP/SL/DP levels based on ATR Built-in MA Filter with optional ATR/StdDev volatility Performance stats panel (Success, Profit/Loss, PP1/PP2) Alerts via popup, sound, push, or emai
Astral Structure
Ottaviano De Cicco
Astral Structure Assess the setup. See the initial plan. Launch Special - $99. $149 after launch. A structure setup raises several questions at once: does the wider view agree, where is the stop reference, and how are targets defined? Astral Structure brings those questions into one workspace for discretionary traders who build their decisions around market structure. Focus on the relevant setup. Review the latest eligible setup, its direction and qualification together. See the wider agreement.
Superhero
Ihor Otkydach
5 (3)
The SUPERHERO indicator is a multi-currency trading system designed on an "all-inclusive" basis. The indicator independently analyzes the market and provides signals on when to open and close trades. It uses Stop Loss and Take Profit orders. The R:R ratio is 1:1. This system can send push notifications to your smartphone, so you can place trades "on the go" without needing to be tied to a PC. It's perfect for proprietary trading firms. A BONUS FOR EVERY CUSTOMER: Every buyer of this indicator wi
Bill Williams Advanced
Siarhei Vashchylka
5 (11)
Bill Williams Advanced is designed for automatic chart analysis using Bill Williams' "Profitunity" system. The indicator analyzes four timeframes at once. Manual (Be sure to read before purchasing) Advantages 1. Analyzes the chart using Bill Williams' "Profitunity" system. Signals are displayed in a table in the corner of the screen and on the price chart. 2. Finds all known AO and AC signals, as well as zone signals. Equipped with a trend filter based on the Alligator. 3. Finds "Divergence Bar
Naked Forex Kangaroo Tail Pro Indicator Kangaroo Tail Pro Indicator is a pattern recognition indicator for Forex, Stocks, Indices, Futures, Commodities and Cryptos. The Kangaroo Tail is a multi-bar pattern. The Kangaroo Tail pattern is very effective and is very simple to trade. The strategy that comes with the Kangaroo Tail is based on price action. The indicator does what it was designed for: displaying Kangaroo Tail patterns.     Don't expect to follow the up and down arrows and make mone
AriFocus
Temirlan Kdyrkhan
AriFocus - Non-Repainting Buy/Sell Signals AriFocus - one clear signal. AriFocus marks buy and sell signals directly on the chart and suggests a stop-loss level for each one. Every signal is confirmed on bar close and never repaints. - Buy/sell arrows, confirmed on bar close - Suggested stop-loss level for every signal - Trend band and candle coloring to show direction at a glance - 10 ready-made presets, or your own settings (14 calculation methods) - Pop-up, push and email alerts with entr
RSI Thunder MT5
Muhammad Abdulrahman Omar Naima Allah Al-rais
RSI Thunder is a powerful and intelligent trading indicator designed for traders who value precision over noise. The indicator generates signals only after candle close , completely eliminating repainting and false entries. It combines multiple proven technical tools into one robust decision-making system, delivering clean, high-quality buy and sell signals directly on the chart. RSI Thunder integrates RSI, EMA, ADX, and ATR , reinforced by a strict SMA40 trend-direction filter to ensure trades
More from author
KT Support and Resistance Levels MT5
KEENBASE SOFTWARE SOLUTIONS
5 (1)
KT Auto Support Resistance Levels: Multi-Timeframe S&R, Smart Zones and Levels Dashboard for MetaTrader 4/5 Swing highs. Pivots. Order blocks. Previous highs and lows. Every trader marks the market a little differently, and the chart pays the price. Stack enough methods on one screen and it stops being a map. It becomes noise. KT Auto Support Resistance Levels fixes that. It scans the monthly, weekly, daily, and your current timeframe at once, then draws the levels that actually matter directly
KT Stoch Divergence MT4
KEENBASE SOFTWARE SOLUTIONS
If you have ever watched price make a new high while Stochastic failed to confirm it, you already know why traders pay attention to divergence. KT Stoch Divergence marks these disagreements directly on the chart, so you can spot possible reversals and trend continuation setups without drawing every line by hand. The indicator finds both regular and hidden divergence between price and the Stochastic oscillator. It gives you context, not an automatic trade. You still decide whether the setup makes
ACB Breakout Arrows
KEENBASE SOFTWARE SOLUTIONS
4.15 (34)
Breakout Signals With Trade Context ACB Breakout Arrows detects a settling phase in price followed by a directional breakout and marks the setup with a buy or sell arrow. The arrow identifies a breakout pattern. It is not a promise that every signal will become a major move. A buy arrow highlights a bullish breakout setup, while a sell arrow highlights a bearish breakout setup. Because price can retest the breakout area or return inside the previous range, check the surrounding market structure,
ACB Trade Filter MT4
KEENBASE SOFTWARE SOLUTIONS
5 (1)
ACB Trade Filter answers one practical question before you place an order: is the market supporting this trade, or are you trying to force a signal through mixed conditions? The indicator reads market sentiment and trend, then presents the result through a color histogram and trend direction. Use it after your normal entry signal, not instead of one. Three market states at a glance Green histogram with bullish trend: conditions support looking for long setups from your strategy. Red histogram wi
KT Momentum Arrows
KEENBASE SOFTWARE SOLUTIONS
KT Momentum Arrows marks bullish and bearish momentum breakouts with arrows when a candle closes beyond its adaptive price bands. The bands respond to price deviation and changing volatility. A blue upward arrow confirms a close above the upper band, while a red downward arrow confirms a close below the lower band. The signal is fixed after the candle closes, so the arrow does not shift to another bar when you review the chart later. What the arrow is showing The arrow identifies the candle wher
KT COG Advanced MT4
KEENBASE SOFTWARE SOLUTIONS
1 (1)
KT COG is an advanced implementation of the center of gravity indicator presented by John F. Ehlers in the May 2002 edition of Technical Analysis of Stocks & Commodities magazine. It's a leading indicator which can be used to identify the potential reversal points with the minimum lag. The COG oscillator catches the price swings quite effectively. MT5 version of the same indicator is available here KT COG Advanced MT5 Calculation of COG The COG indicator is consist of the two lines. The main l
KT Pin Bar
KEENBASE SOFTWARE SOLUTIONS
KT Pin Bar identifies the pin bar formation which is a type of price action pattern which depicts a sign of reversal or rejection of the trend. When combined with support and resistance, BRN and other significant levels, Pin Bar pattern proved to be a very strong sign of reversal. Basically, a pin bar is characterized by a small body relative to the bar length which is closed either in upper or lower 50% part of its length. They have very large wicks and small candle body. A pin bar candlestic
KT Trend Magic
KEENBASE SOFTWARE SOLUTIONS
Read Trend Direction Directly on the Chart KT Trend Magic combines momentum and volatility into a color-coded line that follows price. The line gives you a continuous view of the active trend state and changes color when the calculated direction changes. Green line: shows a bullish trend state. Red line: shows a bearish trend state. Color change: marks a new directional transition on the chart. During a sustained move, the line can also serve as a dynamic chart reference for pullbacks and contin
KT Auto Fibo
KEENBASE SOFTWARE SOLUTIONS
Auto Fibonacci indicator that draws the Fibonacci retracement on the swing you are looking at, and redraws it the moment you zoom or scroll the chart. Zoom in on a pullback and the levels measure that pullback. Zoom out and they measure the whole trend. There are no anchor points to drag and no levels to redraw after every new high. Key features Measures the highest high and the lowest low on your screen, the current candle included. Follows zoom, scroll and window size at once, even when the ma
KT Psar Arrows
KEENBASE SOFTWARE SOLUTIONS
KT Psar Arrows plots the arrows on chart using the standard Parabolic SAR indicator. A bullish arrow is plotted when the candle's high touch the SAR. A bearish arrow is plotted when the candle's low touch the SAR. The signals are generated in the real-time without waiting for the bar close.  Features A beneficial tool for traders who want to experiment with the trading strategies that include the use of Parabolic Sar indicator.  Can be used to find turning points in the market. Use custom PSAR
KT Ichimoku Trader
KEENBASE SOFTWARE SOLUTIONS
1 (1)
Five Ichimoku strategies, traded automatically KT Ichimoku Trader is an Expert Advisor that opens and closes trades automatically with five classic Ichimoku Kinko Hyo strategies. You switch on the strategies you want, and each one trades on its own: its own entry rules, its own exit rules, and at most one open trade per strategy at a time. Every entry is checked on a closed candle. When a new candle opens, the EA reads the candle that just closed and opens a trade only when every entry rule of t
KT Volatility Oscillator
KEENBASE SOFTWARE SOLUTIONS
KT Volatility oscillator analyze the past and current market data with a mathematical formula to display the result in a form of an oscillator. The growing and deteriorating waves are equivalent to high and low volatility in the asset.  In a nutshell, volatility is simply a measurement of the price fluctuation of an asset over a certain period of time. Without volatility, there would not much movement in the market and traders would not be able to profit from the price movements. Use of Volatil
KT COG Robot
KEENBASE SOFTWARE SOLUTIONS
KT COG Robot is a fully automated Expert Advisor based on the KT COG Indicator . The COG indicator was originally presented by John F. Ehlers in the May 2002 edition of Technical Analysis of Stocks & Commodities magazine. The EA fires a long trade when COG line cross above the signal line and a short trade is fired when the COG line cross below the signal line.  Adaptive Filtration Our adaptive filtration algorithm combines the original COG formula with the major trend direction and market acce
ACB Breakout Arrows EA
KEENBASE SOFTWARE SOLUTIONS
Automate the ACB Breakout Workflow ACB Breakout Arrows EA evaluates breakout signals on the attached chart and manages trades with the built-in ACB Breakout Arrows and ACB Trade Filter logic. Attach the EA to the symbol and timeframe you want it to monitor, enable automated trading, then choose the position, session, filter and exit rules that fit your test plan. The required indicators and dependencies are embedded in the EA, so no separate download is needed. Their panels are not displayed on
KT Asian Breakout
KEENBASE SOFTWARE SOLUTIONS
4 (1)
KT Asian Breakout carefully analyzes the range-bound market during the Asian session and then fires a long or short trade after doing some preassessment based on its inbuilt technical analysis module. The executed orders are closed within a day before the completion of the next day session. The inbuilt technical analysis module checks for the session range and compares it with the last 20 days price movement. If it finds any erratic price movement within the session, the orders are not executed
KT London Breakout
KEENBASE SOFTWARE SOLUTIONS
First thirty minutes are essential for a trading session. The early reaction of traders and market players sets a path for the rest of the day. KT London Breakout EA takes advantage of this phenomenon, and after analyzing the first thirty minutes of London session, it places two bidirectional pending orders. One of pending order is eventually canceled after realizing the market direction with certainty. It has been strictly tested and developed for EUR/JPY using 30-Min Time Frame. You can expe
KT Auto Support Resistance Levels: Multi-Timeframe S&R, Smart Zones and Levels Dashboard for MetaTrader 4/5 Swing highs. Pivots. Order blocks. Previous highs and lows. Every trader marks the market a little differently, and the chart pays the price. Stack enough methods on one screen and it stops being a map. It becomes noise. KT Auto Support Resistance Levels fixes that. It scans the monthly, weekly, daily, and your current timeframe at once, then draws the levels that actually matter directly
Currency strength and pair correlation in one indicator KT Currency Strength and Correlation ranks the eight major currencies from strongest to weakest and shows, in a colored matrix, how closely ten currency pairs of your choice move together. Before you open a trade from your own strategy, you can check whether the two currencies of the pair are really moving apart, and whether the new trade adds risk to a trade you already hold. What you see on the chart Strength lines: a separate window belo
MACD Divergence Seeker
KEENBASE SOFTWARE SOLUTIONS
KT MACD Divergence Seeker trades the regular and hidden divergence signals generated by our free indicator named KT MACD Divergence indicator. Trading the standalone divergences can be a risky affair that's why the KT MACD Divergence Seeker combines the standard divergence signals with an advanced analysis module to exploit the price inefficiencies on some FX pairs. What is the Divergence exactly? As a general conception if the price is making higher highs, then macd should also be making hig
KT Asian Breakout Indicator
KEENBASE SOFTWARE SOLUTIONS
Map the Asian Session Range KT Asian Breakout Indicator marks the high and low of a four-hour Asian-session window and watches price after the range is complete. The GMT Offset setting aligns the session with your broker's server time, while Draw Session Box controls the visible range. See the Breakout and Trade Levels Together A bullish arrow appears when price closes above the session high. A bearish arrow appears when price closes below the session low. When Draw Stoploss and Profit Targets i
MACD Divergence MT4
KEENBASE SOFTWARE SOLUTIONS
KT MACD Divergence shows the regular and hidden divergences build between the price and oscillator. If your trading strategy anticipates the trend reversal, you can include the MACD regular divergence to speculate the potential turning points. And if your trading strategy based on the trend continuation, MACD hidden divergence would be a good fit. Limitations of KT MACD Divergence Using the macd divergence as a standalone entry signal can be a risky affair. Every divergence can't be interprete

KT Bollinger Bands Trader MT4
KEENBASE SOFTWARE SOLUTIONS
KT Bollinger Bands Trader is a 100% automated expert advisor that's incorporated a mean reversion trading strategy using the Bollinger bands during the period of low volatility. Price often reacts at the upper or lower line of Bollinger bands, but a reversal not always occurs. However, there is more chance of price reversal during the time of low volatility. Entries A buy trade is activated when price correctly aligns below the bottom line of Bollinger bands. A sell trade is activated when pric
KT CCI Divergence MT4
KEENBASE SOFTWARE SOLUTIONS
KT CCI Divergence shows the regular and hidden divergence created between the price and CCI oscillator. Divergence is one of the vital signals that depicts the upcoming price reversal in the market. Manually spotting the divergence between price and CCI can be a hectic and ambiguous task. Limitations of KT CCI Divergence   Using the CCI divergence as a standalone entry signal can be risky. Every divergence can't be interpreted as a strong reversal signal. For better results, try to combine it w

KT Heiken Ashi Smoothed MT4
KEENBASE SOFTWARE SOLUTIONS
Follow the Smoothed Heiken Ashi State KT Heiken Ashi Smoothed turns price movement into smoothed blue and red candles. It adds a blue up arrow when the state changes from bearish to bullish and a red down arrow when the state changes from bullish to bearish, making directional transitions easy to see on the chart. The smoothing period and smoothing method control how strongly the candles are smoothed. This provides a steadier view than standard Heiken Ashi while letting you choose the response t

KT MA Crossover MT4
KEENBASE SOFTWARE SOLUTIONS
KT MA Crossover draws the buy and sell arrows based on the crossover of chosen moving averages. Moreover, it also generates the appropriate alerts and displays the MFE (Most Favorable Excursion) for each successive signal. The moving average crossover is one of the primary strategies followed by traders around the world. Usually, it consists of a fast and slow moving average to find a buy and sell entry signal according to the crossover direction. Buy signal - when fast MA crosses above the slo
KT Round Numbers MT4
KEENBASE SOFTWARE SOLUTIONS
KT Round Numbers plots the round number levels which are also commonly known as psychological levels in the Forex world. In the context of Forex trading, round number levels are those levels in which there are two or more zeroes at the end. They are named as 00 levels on the chart. Some traders also consider the halfway points as a valid round number level. They are named as 50 levels on the chart. Use of round number levels in trading Round number levels work as strong support and resistance
KT Inside Bar Advanced MT4
KEENBASE SOFTWARE SOLUTIONS
Despite the popularity of inside bar pattern among the traders, using it as a standalone signal doesn't provide any edge in the market. KT Inside Bar Advanced indicator solves this problem by combining the classic inside bar pattern with the "ECE" cycle and Fibonacci extensions. Using this indicator in place of our classic inside bar indicator will provide a tremendous advantage and edge in the market. What is the ECE cycle? In financial markets, the price never moves in a straight line but u
KT Inside Bar Hunter MT4
KEENBASE SOFTWARE SOLUTIONS
Despite the popularity of inside bar pattern among traders, using it as a standalone entry signal doesn't provide any evidentiary advantage. KT Inside Bar Hunter trades only selected inside bar patterns using some preassessment and ECE price action cycle. Trading Strategy On successful detection of the required pattern, EA places a pending order in the direction of the forecasted price expansion phase. Pending orders are canceled if they are not triggered within the next bar. Once triggered, ac
KT CCI Surfer MT4
KEENBASE SOFTWARE SOLUTIONS
KT CCI Surfer uses a mean reversion trading strategy with a combination of extreme overbought/oversold zone detection using the Commodity Channel Index (CCI). Developed by Donald Lambert in 1980, CCI is a leading indicator that helps to identify the overbought/oversold region in the market without any lag. Obviously, not every overbought/oversold signal turns out into a price reversal. However, when combined with a well-planned mean reversion strategy, it produces excellent results. Recommend
KT RSI Divergence Robot MT4
KEENBASE SOFTWARE SOLUTIONS
Trade Confirmed RSI Divergence KT RSI Divergence Robot monitors regular and hidden divergence between price and the Relative Strength Index on the symbol and timeframe of the chart. It evaluates new signals after a bar is complete. A bullish divergence can open a buy position, while a bearish divergence can open a sell position. When an opposite signal appears, the EA can close positions in the other direction before evaluating a new entry. Choose the Entry Conditions The strategy can be adjuste
Filter:
jets2270
21
jets2270 2023.04.24 08:51 

thought it was a bot but i was wrong , was looking for it to go auto trading

KEENBASE SOFTWARE SOLUTIONS
61179
Reply from developer Nitin Raj 2025.03.25 18:28
Fully automated candlestick patterns ea is available here: https://www.mql5.com/en/market/product/62261
Reply to review