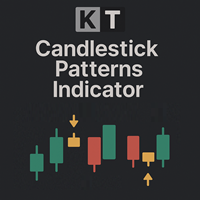
KT Candlestick Patterns MT5

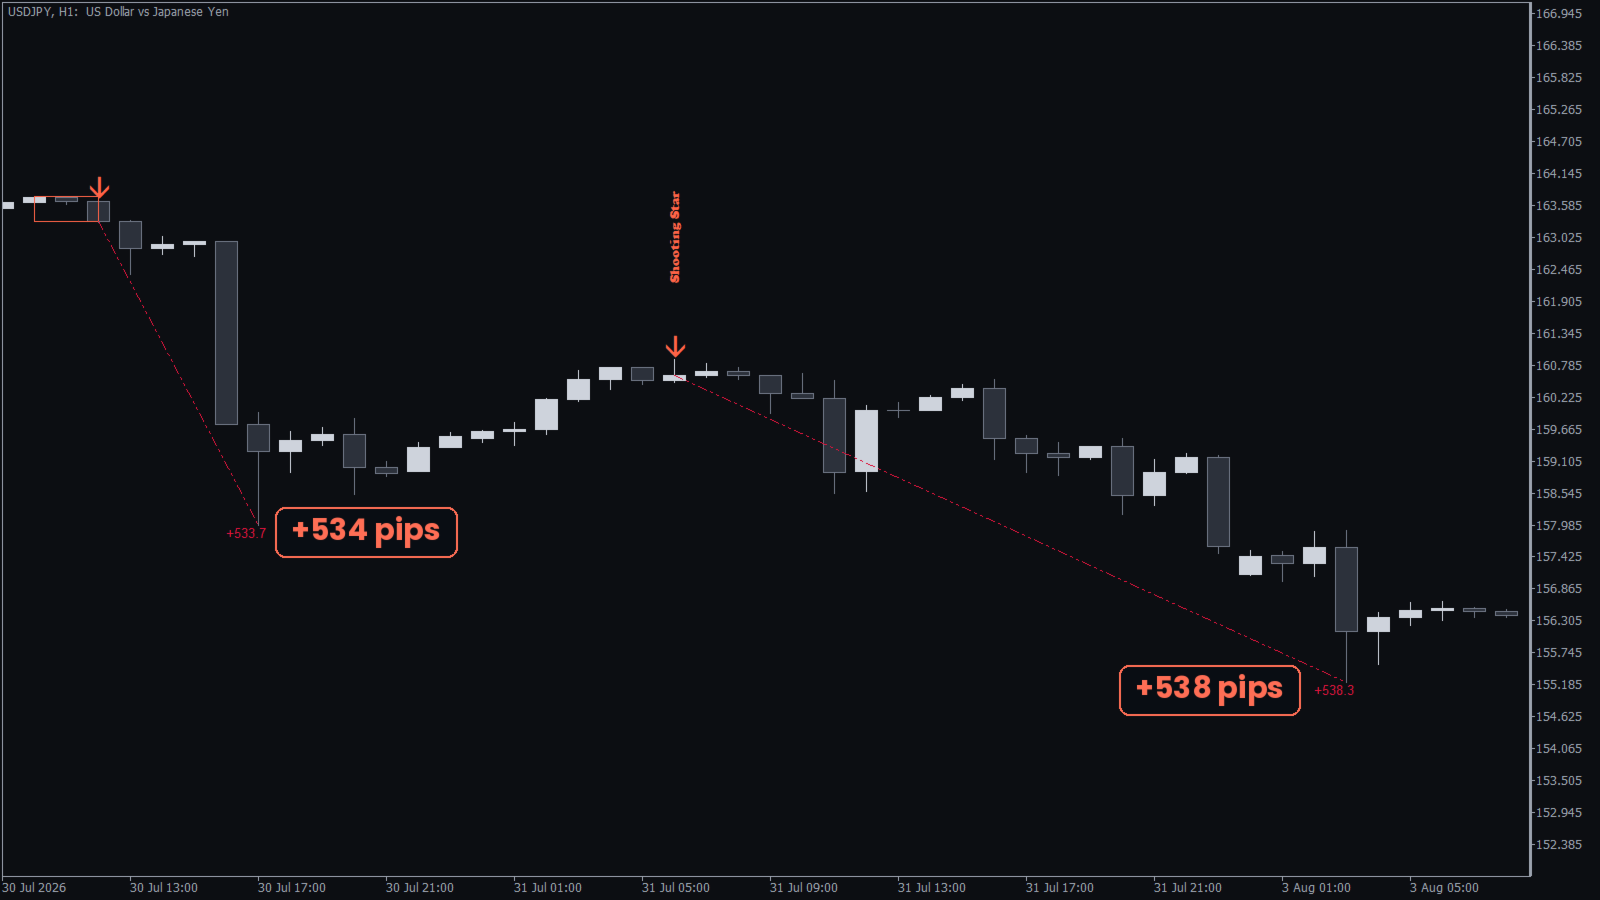
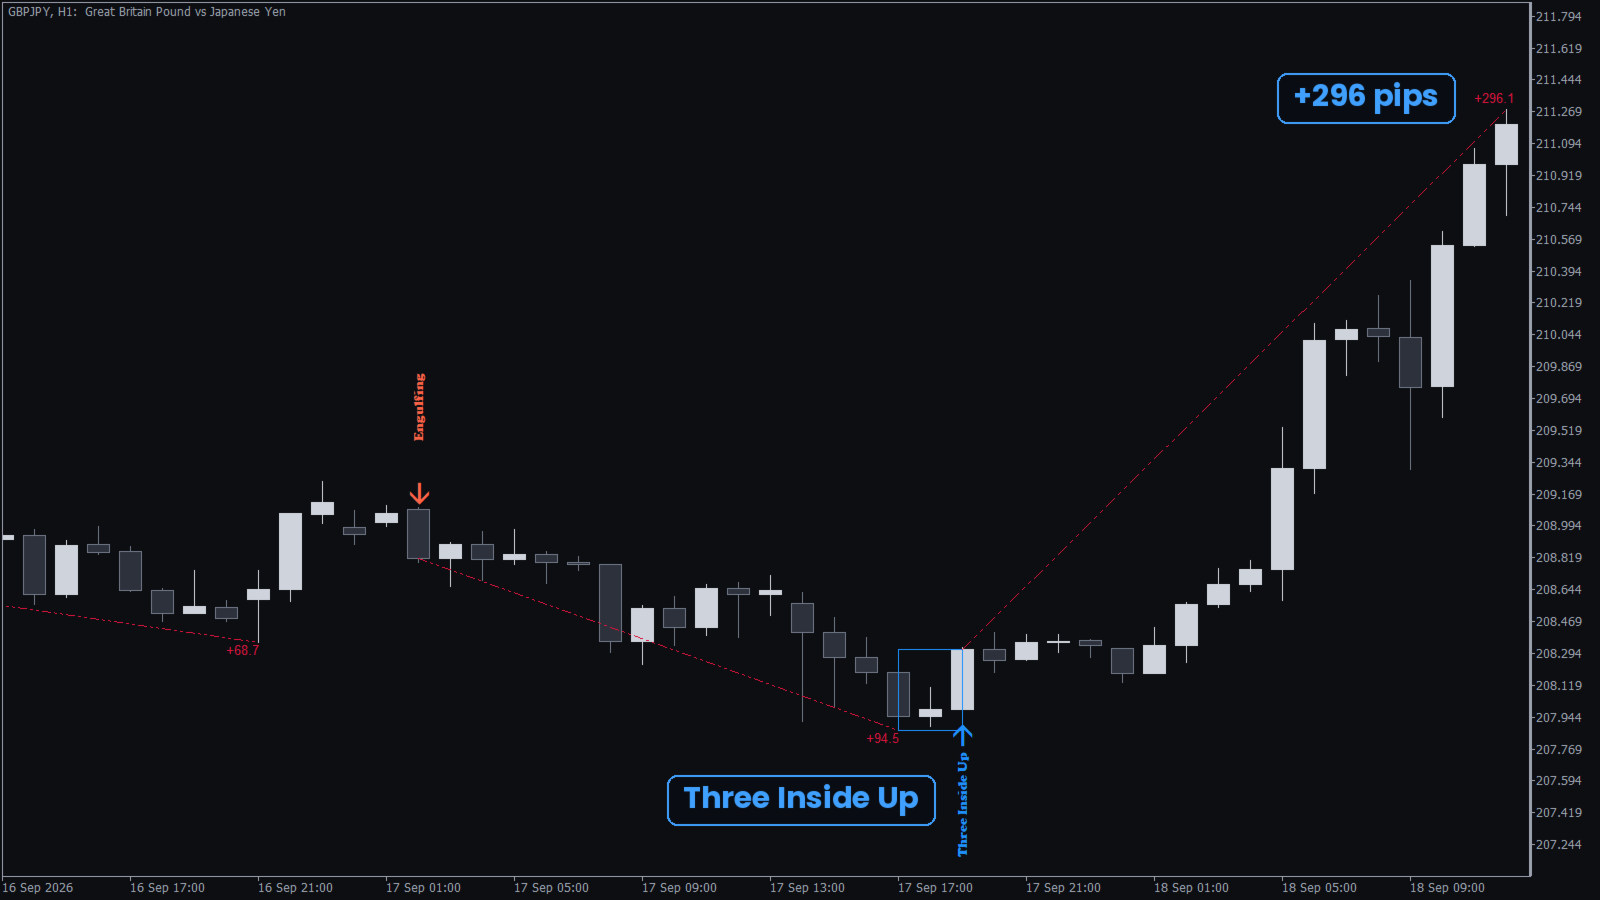
A candlestick pattern indicator for MetaTrader that shows you which patterns are worth trading on your symbol. It marks 24 Japanese candlestick patterns and writes on the chart how many pips price moved after every signal.

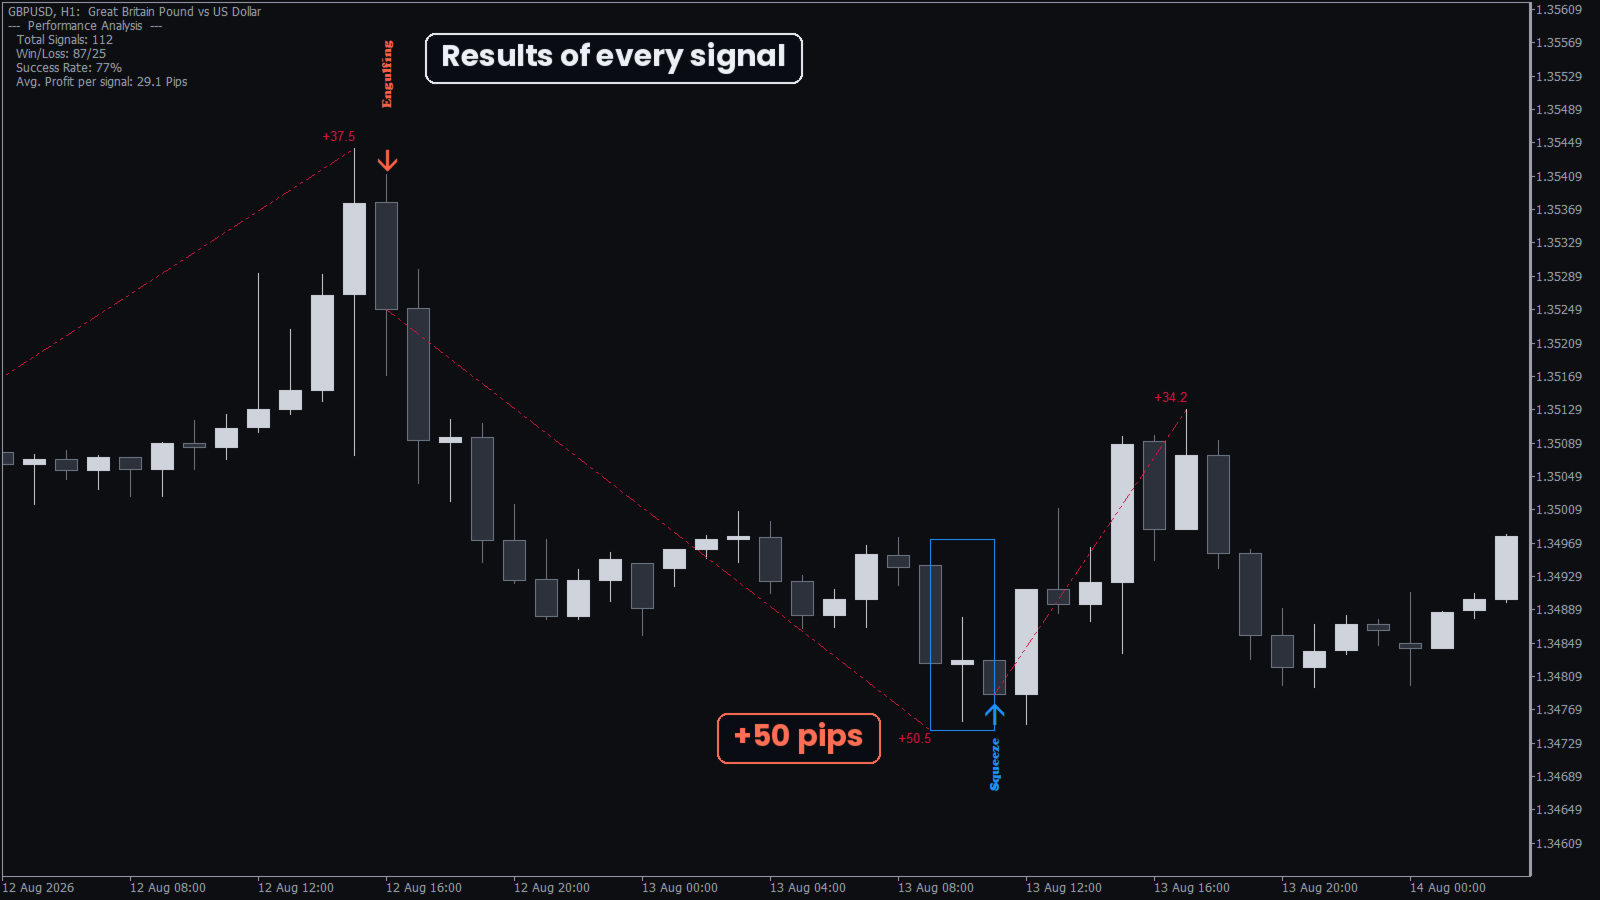
A panel in the corner of the chart turns those results into a record: total signals, wins, success rate and average pips per signal, measured against the target you set. You see what each pattern did on your symbol and timeframe before you take the next one.

What you get

  • 24 candlestick patterns: Engulfing, Hammer and Shooting Star, Morning Star, Three White Soldiers, Kicker, Piercing, Marubozu, Fakey Breakout and more, plus four Doji types.
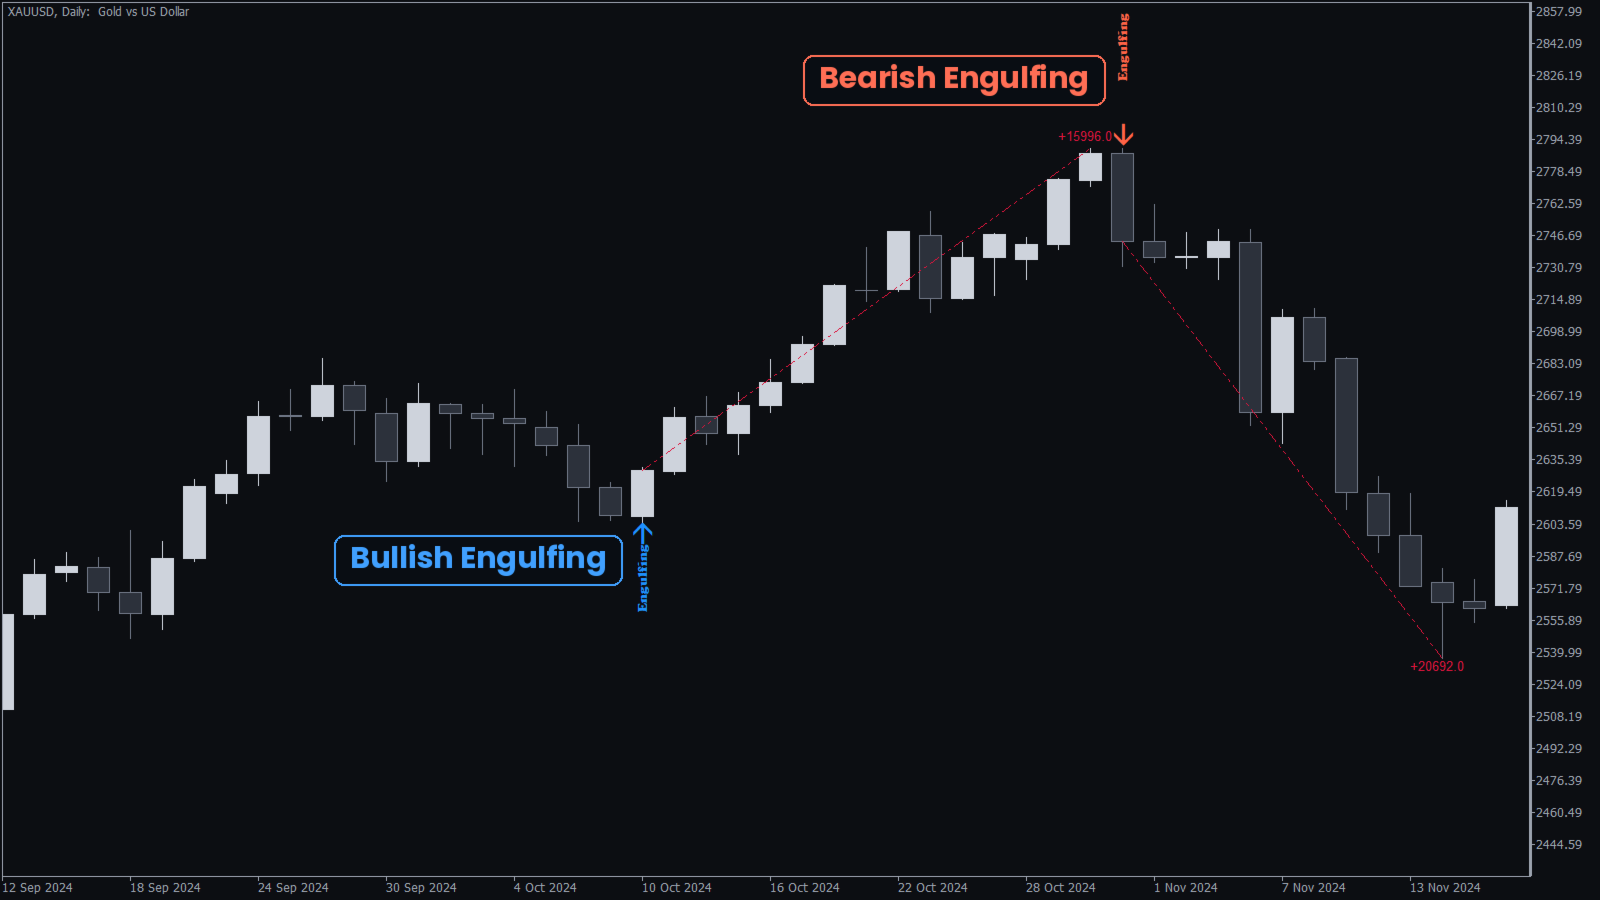
  • Signals only where a reversal can happen: a reversal pattern gets an arrow only after a move in the opposite direction, so a Hammer in the middle of a rally is left alone.
  • No repainting: a pattern is confirmed when its last candle closes, and the arrow, the pattern name and the box stay where they were drawn.
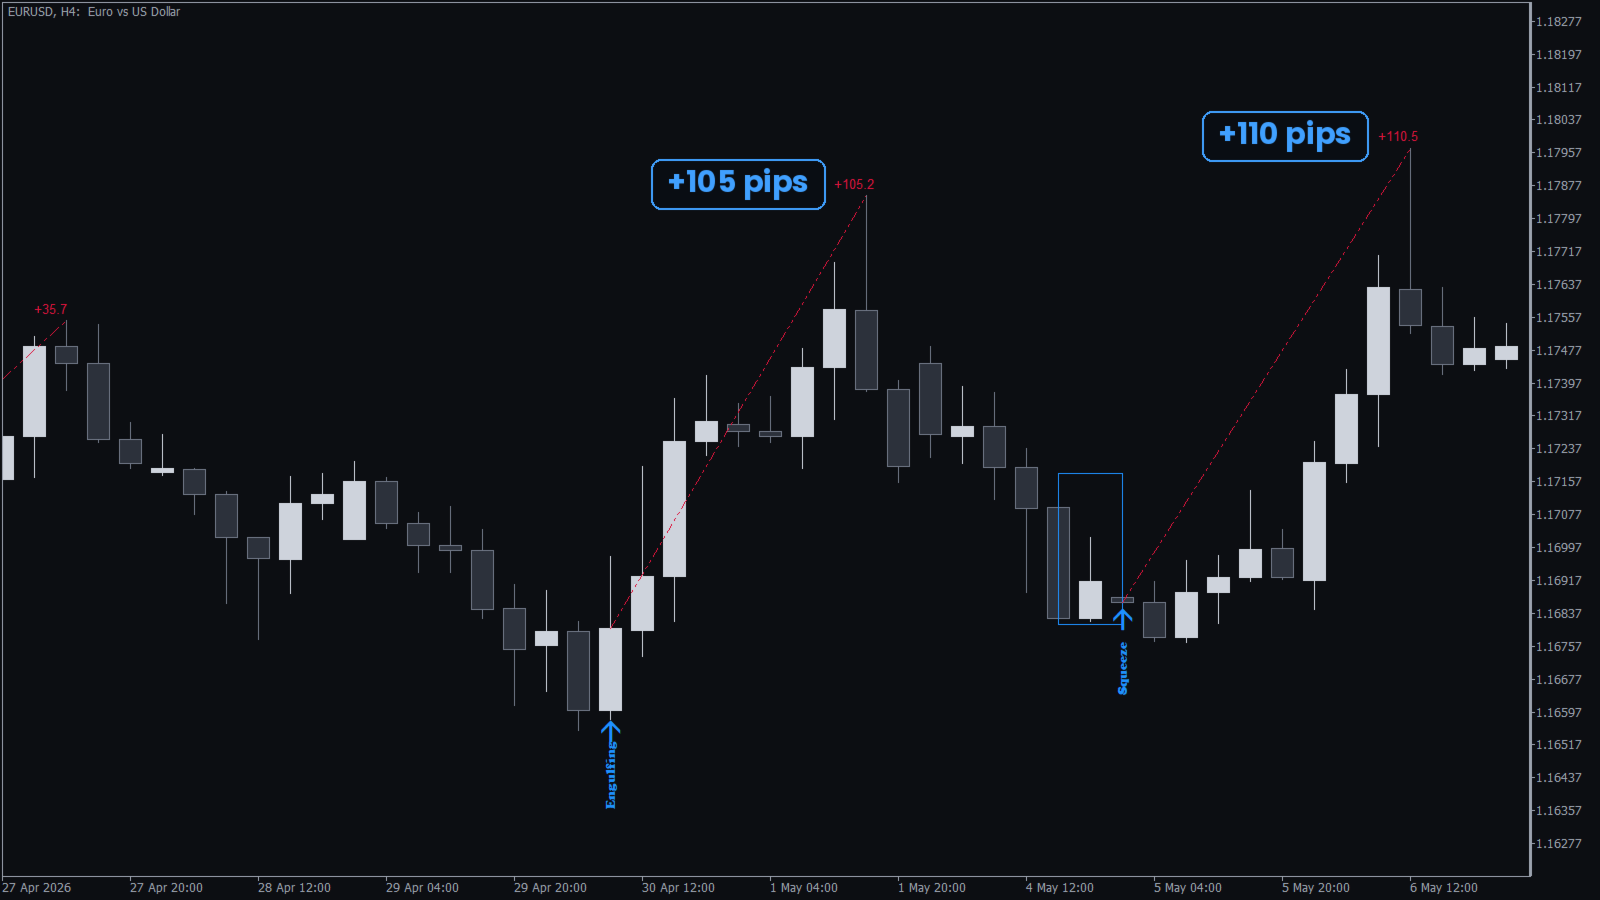
  • A result for every signal: a line follows price after each signal, with the pips written at its end, so you can judge a pattern by scrolling back through your chart.
  • Your own success benchmark: enter the pips you want from a trade, and the panel counts how many signals reached it.
  • Doji candles kept apart: the four Doji types get a yellow dot as a sign of indecision, never a buy or sell signal.
  • Alerts on the closed candle: popup, sound, email and push notifications with the symbol, the timeframe and the pattern name.

How to use it

Attach the indicator to your chart. A blue arrow below the candles marks a bullish pattern, a red arrow above the candles marks a bearish pattern, and a box surrounds the candles that formed it. Set Success Benchmark Pips to the move you want from a trade, then read the panel.

Keep the patterns that work on your chart. Switch the patterns off one at a time in the inputs, and when the success rate rises without a pattern, leave that pattern off. Place your stop loss a few pips beyond the pattern box, where the pattern would fail.

Recommendations

The indicator works on every symbol and timeframe in MetaTrader, including forex pairs, gold, indices and crypto. Start on H1 or a higher timeframe and raise Min. Bars Between Patterns when you want fewer signals and a cleaner chart. Your EA can also read the buy signal, the sell signal and the pattern code.

Input parameters

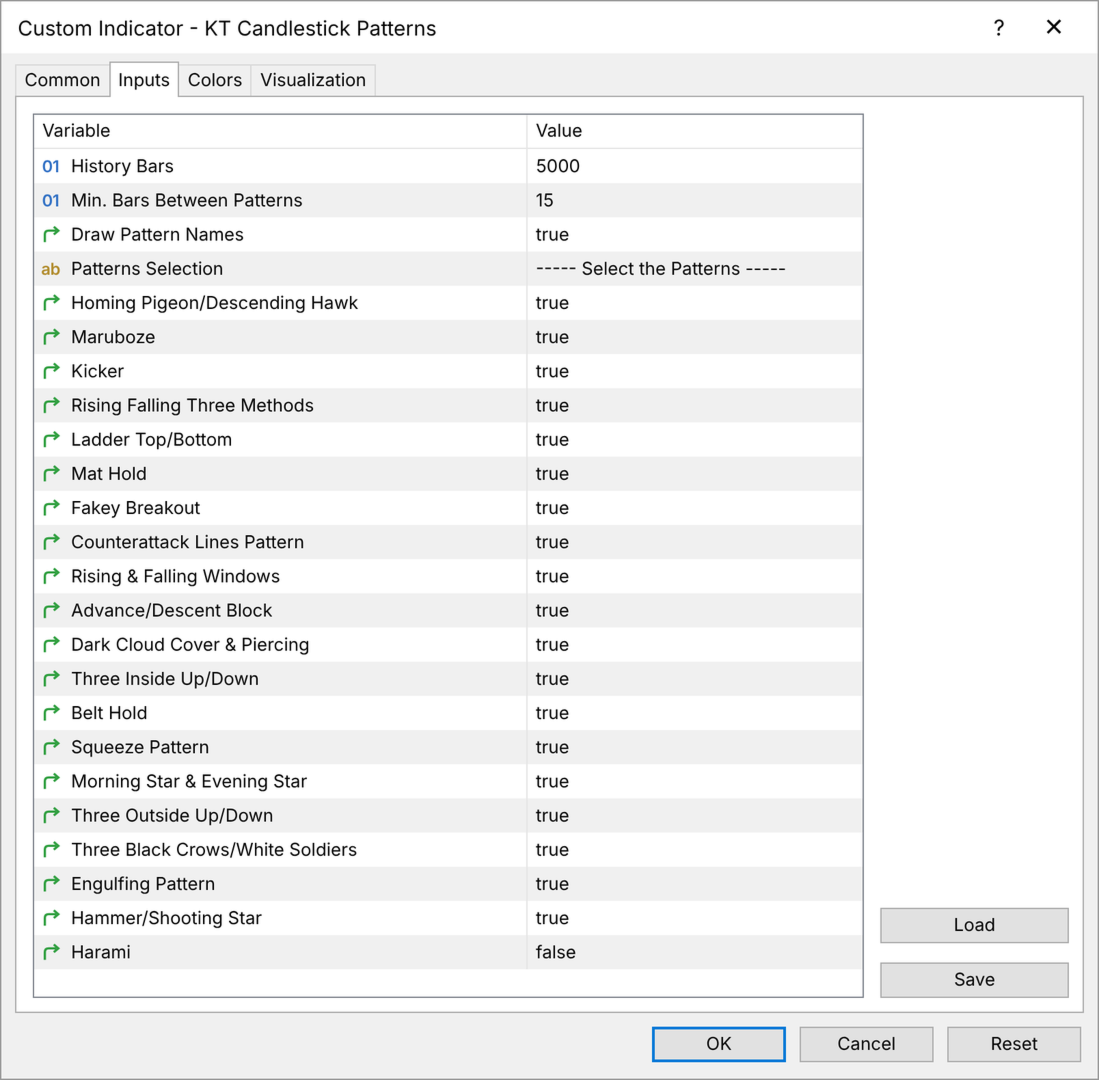
  • History Bars: how many candles are checked for patterns and counted in the record.
  • Min. Bars Between Patterns: the smallest gap between two signals (15 by default).
  • Draw Pattern Names: writes the name of each pattern on the chart.
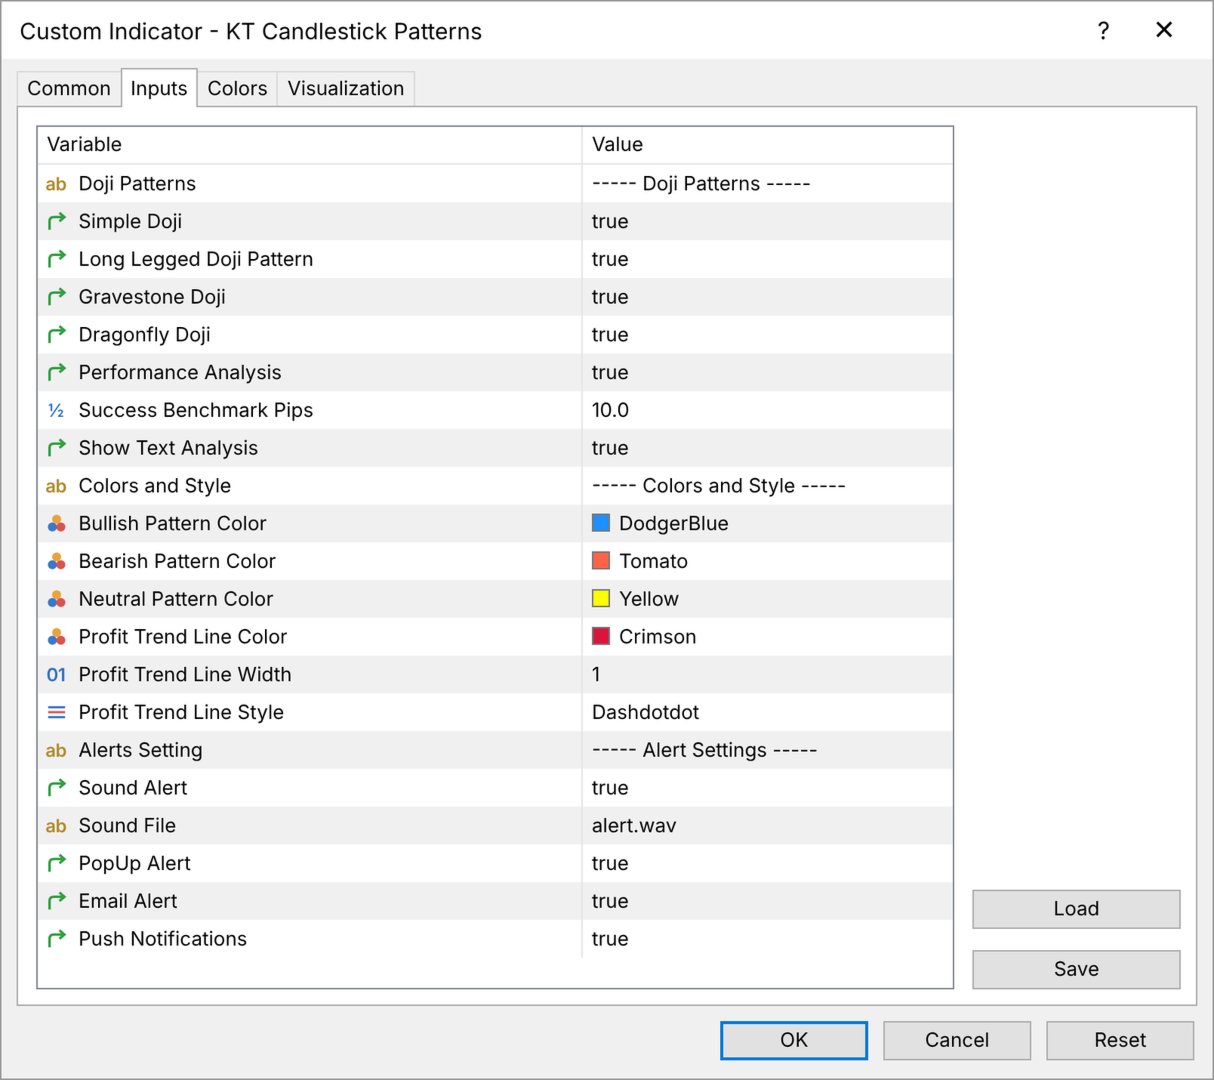
  • Pattern switches: switch each of the 20 patterns and the four Doji types on or off. Harami is off by default.
  • Performance Analysis: draws the result line of every signal and keeps the record.
  • Success Benchmark Pips: the pips a signal must move in its direction to count as a win (10 by default).
  • Show Text Analysis: shows or hides the record panel.
  • Colors and style: the colors of bullish, bearish and neutral patterns, and the color, width and style of the result line.
  • Alerts: sound with your own sound file, popup, email and push notifications.

Let your own chart pick the patterns

You get 24 candlestick patterns marked where they make sense, an alert the moment one forms on a closed candle, and the result of every past signal on your own chart. Keep the patterns that reach your target, and trade the next signal with the record behind it.
Produtos recomendados
Multi-Confluence Reversal Alert | RSI + Heikin Ashi + Divergence + Key Levels | SL/TP Lines | No Repaint Confluence Reversal Alert is a professional-grade reversal detection indicator for MetaTrader 4. It combines five powerful trading concepts into a single, clean alert system — giving you high-probability reversal signals with automatically drawn Entry, Stop Loss, and Take Profit levels directly on your chart. Designed for traders who use VSA (Volume Spread Analysis), price action, and multi-
KillzoneLens - ICT Killzones for MT5 The ICT killzones are the hours when the big players move the market: the London open and the New York open above all. KillzoneLens draws them on your chart in the right place every day, converting New York time to your broker's server time automatically, including the US and European daylight-saving changes. Killzones (New York time, all adjustable) - Asian 20:00-00:00, London open 02:00-05:00, New York open 07:00-10:00, London close 10:00-12:00. - A colo
[b]Titan Pro V7 Institutional Dashboard[/b] is an advanced quantitative HUD terminal engineered for MetaTrader 5, designed for institutional market analysis, quantitative prop-firm verification, and disciplined intraday execution. Unlike conventional single-formula indicators that suffer from lag and market regime shifts, Titan Pro V7 synthesizes a multi-strategy quantitative consensus model combining Trend Momentum, Volatility Breakout, Intraday VWAP, and Smart Money Concepts (SMC) into a sin
JC OB Strategy turns your MetaTrader 5 chart into a complete Order Block engine: it finds institutional demand and supply zones, and the moment an Order Block is confirmed it opens a trade plan with ENTRY, STOP LOSS and three take-profit targets on the chart. WHAT IT DOES - Order Block detection (SMC/ICT engine): a bullish OB is a bearish candle followed by a strong bullish confirmation candle that closes above its high; a bearish OB is the mirror image below the low. Optional classic swing-base
Indicador de Rede Neural       com Aprendizado Integrado. Este é um sistema de inteligência artificial autônomo real,   alimentado por um perceptron personalizável de vários níveis e configurações avançadas de treinamento para prever futuras variações de preços. Você pode treinar o indicador em qualquer símbolo financeiro, sem precisar de nenhum conhecimento especial em aprendizado de máquina. Tudo o que você precisa está reunido nesta ferramenta e implementado convenientemente com modo automáti
AutoTrend Pro
Aram Hussein Mohammed
TL Method — Automatic Trendline Detection & Strength Indicator Tired of drawing trendlines manually? TL Method does it for you — automatically detecting, drawing, and scoring trendlines in real time. What it does: Scans up to 1000 bars to find valid support and resistance trendlines Scores each trendline by counting confirmed anchor touches Generates buy/sell signal arrows when price approaches strong trendlines Alerts you via popup, push notification, or sound — with smart cooldown to avoid spa
Candle Pattern Pro MT5
Komang Putra Riswanjaya
Description : In the world of trading, candlestick patterns are a popular technical analysis tool used by many traders.   There are numerous candlestick patterns, ranging from reversal patterns to continuation patterns. However, remembering all these patterns can be challenging, especially for novice traders. This often leads to traders having to manually memorize and identify candlestick patterns, which can be time-consuming and prone to errors. Candle Pattern Pro is a powerful indicator desig
Visão Geral Break Legs and Order Block Finder é um indicador de estrutura de mercado de última geração para o MetaTrader 5, desenvolvido para traders de Smart Money, operadores com base em estrutura e estratégias de estilo institucional. Ele destaca automaticamente os principais eventos do mercado — como Break of Structure (BOS) , Market Structure Shift (MSS) , Fair Value Gaps (FVG) e Order Blocks (OB) — diretamente no gráfico. Projetado para traders profissionais e varejistas sérios, este indic
VibeFox Inside Bar — rompimento de compressão da barra-mãe com pontos de entrada automáticos O VibeFox Inside Bar é um indicador de price action em tempo real para o MetaTrader 5. Ele detecta o clássico padrão inside bar, desenha um retângulo limpo ao redor de cada barra-mãe que contém uma compressão de inside bars e marca o momento exato em que o preço rompe esse intervalo diretamente no gráfico. Todos os controles são reunidos em um painel interativo moderno, de modo que, em vez de examinar ve
IQ FX Gann Levels a precision trading indicator based on W.D. Gann’s square root methods . It plots real-time, non-repainting support and resistance levels to help traders confidently spot intraday and scalping opportunities with high accuracy. William Delbert Gann (W.D. Gann) was an exceptional market analyst, whose trading technique was based on a complex blend of mathematics, geometry, astrology, and ancient mathematics which proved to be extremely accurate. We don't offer free or bonus indic
Supply Demand Entry — MT5 All-in-one trading assistant for precision Supply & Demand analysis, entries, and trade management.   Supply & Demand Zones — Fresh zone detection & retests   Buy / Sell Setups — Clear trade signals & entry levels   S/R Levels — Support & resistance across all timeframes   Multi-Timeframe Analysis — M1 to MN   Economic Calendar — High-impact news awareness   Mobile Alerts — Signal, zone & trade-level notifications   Trade Levels — Entry, SL, TP & R :R   Trading Journal
SMC Order Block Delta Validator - Confirmação por Fluxo Você está cansado de ver seus Order Blocks tradicionais serem rompidos sem nenhuma reação do preço? A maioria dos indicadores de SMC falha porque eles olham apenas a estrutura gráfica, ignorando o que realmente move o mercado: o Volume e a Agressão. O SMC Order Block Delta Validator é o primeiro indicador de Smart Money Concepts que valida cada bloco de ordens analisando a microestrutura de fluxo dentro da vela de origem. Ele calcula
KT Inside Bar MT5
KEENBASE SOFTWARE SOLUTIONS
KT Inside Bar plots the famous inside bar pattern in which the bar carries a lower high and higher low compared to the previous bar. The last bar is also known as the mother bar. On smaller time-frames, the inside bar sometimes appears similar to a triangle pattern. Features Also plots entry, stop-loss, and take-profit levels with the inside bar pattern. No complex inputs and settings. Erase unwanted levels when the price reaches the entry line in either direction. All Metatrader alerts include
Outside bars  (Außenstäbe)  are important in professional price action trading and were made popular by Michael Voigt.  Highs and lows of outside bars ( Aussenstäbe ) can be utilized as entry and exit for trades following different strategies. With combining different timeframes you can more easily detect the overall trend of the market, see potential resistance and support levels and also detect change in trend and framing of the market.  Examples for strategies with inside bars (Innenstäbe) an
Indicador Crypto_Forex "Padrão de Barra de Rompimento" para MT5, sem repintura, sem atraso. - O indicador "Padrão de Barra de Rompimento" é um indicador muito poderoso para negociação de Price Action. - O indicador detecta padrões de Barra de Rompimento no gráfico: - Padrão de Barra de Rompimento de Alta - Sinal de seta azul no gráfico (veja as imagens). - Padrão de Barra de Rompimento de Baixa - Sinal de seta vermelha no gráfico (veja as imagens). - PC, Mobile alerts. - O indicador "Padrão de
Chart Patterns Builder Premium
Florea E. Sorin-Mihai Persoana Fizica Autorizata
The Chart Patterns Builder Premium expert advisor is an extension of the freely available Chart Patterns Builder Basic :         it provides 1 new chart pattern: the rectangle breakout (besides the double top & bottom pattern already provided in the basic edition);         in most configurations, backtesting usually shows more than double (2x) average yearly return rate;         the account growth curve is also smoother, due to approximately double number of trades,  compared to the free version
CRT Multi-Timeframe Market Structure & Liquidity Sweep Indicator Non-Repainting | Multi-Asset | MT4 Version Available Full Setup Guide:   https://www.mql5.com/en/blogs/post/767525 MT4 Version: https://www.mql5.com/en/market/product/162556 Indicator Overview CRT Ghost Candle HTF Fractal is a complete institutional-grade market structure toolkit for MetaTrader 5. It projects higher-timeframe candle structure, CRT trap levels, session levels, previous period highs and lows, pivot points, and a re
Bastion Sentinel Core
Matthew David Cracknell
Bastion Sentinel Core — Daily Zones, 4-Hour Rejection Signals Overview Bastion Sentinel Core identifies supply and demand zones on the Daily timeframe — price levels where the market has previously attempted to break through and failed — and marks non-repainting BUY/SELL arrows when price re-tests and rejects those zones on the 4-Hour timeframe. Timeframes are fixed in this edition: zones are always mapped from Daily, and rejections are always confirmed on the 4-Hour close.  This is an analysis
Yawabeh SD Pro –  Professional Supply and Demand Indicator Trade Smarter with Volume-Confirmed Supply/Demand Zones Our institutional-grade algorithm identifies high-probability reversal zones before price reacts, giving you the edge in Forex, Crypto, and Stocks. Key Features Multi-Timeframe Confirmation – View trend strength across multiple timeframes simultaneously – Align your trades with higher timeframe momentum Smart Alert System – Real-time notifications for: – Strong demand/supply zone
Supertrend Volume Confirm
Isaac Alexander Pinero Garcias
DESCRIPTION Supertrend Volume Confirm — Trend Signals Confirmed by Volume and RSI Supertrend Volume Confirm is a buy/sell signal indicator based on the classic Supertrend, with two additional confirmation filters: volume and RSI. Unlike more complex multi-timeframe systems, this indicator works on a single timeframe, designed for traders who want something direct and easy to read. It works on any market symbol (forex, gold, indices, stocks, crypto) thanks to its default use of tick volume, unive
SR Zones Sync: Support & Resistance Zones with Break-on-Close Logic SR Zones Sync automatically draws support and resistance zones from swing pivots, then recolours them when price actually breaks through. Only a fully closed candle can break a zone, so wicks and the still-forming candle never trigger a false signal. How it works Zones are built by clustering swing highs and lows into price areas. Each zone’s thickness adapts to the average candle range. Each zone gets a role from its latest pi
Tma Poc Gold
Ignacio Agustin Mene Franco
POC + TMA SCALPER GOLD - Expert Advisor Professional DESCRIPTION: Automated trading system designed specifically for XAU/USD, combining Point of Control (POC) with Triangular Moving Average (TMA) to identify high-volume and trending zones. It uses advanced risk management with dynamic trailing stops and an intelligent grid system. TECHNICA
MTF Liquidity Rays Pro — Stop Manually Drawing Liquidity Areas The "Liquidity Trap" of Manual Charting: As a price action trader, you know that liquidity is the fuel of the market. But let’s be honest: manually scanning Weekly, Daily, and 4-hour charts every morning to draw your rays is tedious, prone to human error, and mentally draining. By the time you’ve mapped out your levels, the trade setup has often already moved. Worse yet, how many times have you missed a trade because you forgot to de
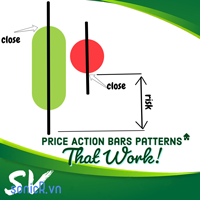
The problem with trading candlestick patterns becomes obvious, after some experience in live markets. Hypothetical branching of candlestick patterns, are not necessary for successful trading. As a Price action trader, my principle is to keep things simple and consistent. My focus is on buying and selling pressure, which is visible in market structure. Trade Management and discipline are my secondary core elements. This indicator detect 4 Simple but Effective Price action Patterns! Yellow = Insi
Indicador de sinais de compra e venda sem repintura para MT5 com plano de trade e estatísticas reais Guardian Signal — o único indicador de sinais que mostra os seus números reais. A maioria dos indicadores de sinais promete taxas de acerto. O Guardian Signal mostra factos: cada sinal que imprimiu no seu gráfico e o que realmente aconteceu depois. Sem repintura, sem setas apagadas, sem estatísticas de fantasia — uma ferramenta honesta para traders disciplinados. O que recebe com cada sinal: Seta
Harmonic Patterns SwingCore Pro | For MetaTrader 5 (MT5) Technical analysis indicator for detecting and visualizing harmonic patterns on the chart, with Fibonacci level projection and configurable alert system. ================================================================================ WHAT THIS INDICATOR IS It is a visual analysis tool. Its function is to identify structures on the chart that satisfy the geometric relationships of six classic harmonic patterns: Gartley, Bat, Butterfly
SwingCross
Subho Adhikary
Short description (one line) ZigZag-style swing indicator that plots swing highs/lows, leg midpoints, range labels and dynamic Small/Medium/Large target levels with a latched target-chaser line. Full description Swing Cross is a highly customizable ZigZag-style indicator that identifies swing highs and lows, draws the connecting legs, and automatically builds dynamic target levels from your symbol's recent leg-range history. How it works Detects local swing highs/lows using the classic ZigZag
The ZigZag Buy Level is a specialized tool for traders who utilize market structure and classic ZigZag patterns to define key support and entry points. It automatically identifies "Main Highs"—significant highs confirmed by the subsequent price action—and then calculates a high-probability "Buy Level" based on a specified percentage pullback from that Main High to the last corrective low. This indicator helps you anticipate deep retracement entries, clearly marking them on the chart with labels
Deep State Regime Classifier
Matheus Rodrigues Satriano
Deep State Regime Classifier pinta os candles do gráfico de acordo com o regime de mercado detectado em cada barra fechada. É um classificador determinístico, baseado em regras e em estatísticas conhecidas: uma estimativa por rescaled range do expoente de Hurst, um índice de dimensão fractal (FDI), o desvio padrão das variações de preço e o momentum. Os mesmos dados sempre geram as mesmas cores. Como funciona Para cada barra fechada o indicador olha para trás numa janela configurável (padrão 144
Pattern Oracle
Fwaz A A Almebyad
Pattern Oracle is an all-in-one chart pattern engine for MetaTrader. It scans three zigzag levels at once, finds more than 30 harmonic, chart, continuation and reversal patterns, scores every setup and draws a complete trade plan with entry, stop-loss and two take-profit levels. A built-in teaching mode explains every pattern right on the chart. Pivots are only used once they are confirmed and every decision is made on a closed bar, so signals do not repaint . Patterns detected Reversal : Double
Os compradores deste produto também adquirem
Trend Sniper X
Sarvarbek Abduvoxobov
4.86 (44)
Trend Sniper X é um indicador de acompanhamento de tendência para múltiplos tempos gráficos no MetaTrader 5 que ajuda os traders a identificar a direção da tendência e potenciais pontos de reversão com clareza e precisão. para MT4: https://www.mql5.com/en/market/product/193245 Informações sobre o preço: O preço atual é promocional e está sujeito a alterações à medida que novas atualizações e funcionalidades forem lançadas. Oferta Bônus: Para obter o Auto-Trade Assistant EA GRATUITO para este in
O Entry Points Pro mostra onde entrar, onde colocar o stop e com qual lote operar — antes de você colocar a ordem. PREÇO Agora 199 USD: 8 cópias por este preço, depois 249 USD. O preço final é 349 USD. Eu ganho meu dinheiro operando nos mercados e mostro isso, por isso não preciso vender este indicador para todo mundo. É uma ferramenta para traders que pensam por conta própria, não um botão mágico. Sem rompimento, não há operação. Uma seta cinza é um sinal cancelado: o preço não rompeu o candle
Ultra Indicator
Ihor Otkydach
5 (1)
O ULTRA é um indicador técnico que funciona numa base «tudo-em-um» — analisa o mercado de forma independente, gera sinais de negociação, apresenta níveis para definir ordens de stop-loss e sugere quando encerrar as negociações para garantir lucros ou minimizar perdas. Por outras palavras, não importa se não sabe analisar o mercado, determinar níveis — onde definir o seu stop-loss — ou se tem dificuldades com a gestão do capital. O ULTRA fará tudo isso por si! BÓNUS PARA O COMPRADOR: Após adquiri
Gann Made Easy   é um sistema de negociação Forex profissional e fácil de usar, baseado nos melhores princípios de negociação usando a teoria do sr. W. D. Gann. O indicador fornece sinais precisos de COMPRA e VENDA, incluindo níveis de Stop Loss e Take Profit. Você pode negociar mesmo em movimento usando notificações PUSH. Entre em contato comigo após a compra para receber instruções de negociação e ótimos indicadores extras gratuitamente! Provavelmente você já ouviu muitas vezes sobre os método
Boba Analysis Suite
Trade Ready Solutions LLC
5 (2)
Boba Analysis Suite O Boba Analysis Suite é um indicador de análise para o MetaTrader 5. Reúne a estrutura do mercado, as zonas de preço relevantes e o contexto geral do mercado numa única visualização do gráfico. Desenvolvido a partir da experiência prática como trader e formador de traders, apoia um processo de análise estruturado: avaliar a direção do mercado, identificar níveis importantes e analisar vários períodos gráficos em conjunto. Análise em contexto O significado de cada sinal depend
Azimuth Pro
Ottaviano De Cicco
5 (7)
Azimuth Pro V2: Estrutura Fractal Sintética e Entradas Confirmadas para MT5 Visão geral Azimuth Pro é um indicador de estrutura swing multinível da Merkava Labs . Quatro camadas de swing aninhadas, VWAP ancorado em swings, detecção de padrões ABC, filtragem estrutural de três timeframes e entradas confirmadas em barra fechada — um gráfico, um fluxo de trabalho dos micro-swings aos macro-ciclos. Este não é um produto de sinais cegos. É um fluxo de trabalho baseado em estrutura para traders que v
FiboSniper Pro
Van Minh Nguyen
5 (4)
FiboSniper Pro – Multi-Filter Fibonacci System with Auto SL/TP and Control Panel FiboSniper Pro é um indicador técnico que combina Fibonacci Envelopes dinâmicos com vários filtros de confirmação para gerar sinais seletivos de Buy e Sell. Os níveis de Fibonacci são calculados com base em Moving Average e ATR e, em seguida, filtrados por ADX, EMA, RSI, ATR, Volume, Time e estrutura das velas. O indicador exibe diretamente no gráfico os níveis automáticos de Stop Loss e Take Profit baseados em ATR,
M1 Sniper MT5
Oleg Rodin
5 (7)
O   M1 SNIPER   é um sistema indicador de negociação fácil de usar. É um indicador de seta projetado para o período M1. O indicador pode ser usado como um sistema independente para scalping no período M1 e pode ser usado como parte do seu sistema de negociação existente. Embora este sistema de negociação tenha sido projetado especificamente para negociação no M1, ele também pode ser usado em outros períodos. Originalmente, desenvolvi este método para negociar XAUUSD e BTCUSD. Mas considero-o úti
Apex Patterns PRO Compre o indicador - Obtenha um Expert Advisor baseado nele GRATUITAMENTE. Inteligência Auto-otimizada de Padrões e Rompimentos Os rastreadores de padrões tradicionais dependem de entradas fixas, frequentemente apresentando baixo desempenho quando a volatilidade e as estruturas do mercado mudam. O Apex Patterns PRO foi projetado para se adaptar às mudanças nas condições do mercado, combinando o reconhecimento estrutural de padrões de gráfico, filtragem de momentum e auto-otimi
SQN Max indicator for MT5 by ITC
Renaud Herve Francois Candel
Sqn Max Indicator Sqn Max is an exclusive indicator to trade the market with high effectiveness. The indicator is based on price action, volatility and trend. This indicator is as simple as possible but not too simple. The indicator can generate alerts to ease the trading process. You don't have to stay all day in front of your screen. The indicator can be used with any class of assets and with any time frame. It is possible to achieve better results trading our list of selected assets. We achi
Adaptive Price Action Engine Compre um indicador, ganhe o EA de graça Análise Auto-Otimizada de Tendências e Padrões de Candlestick em Múltiplos Timeframes Os mercados estão em constante mudança, e nem todos os padrões de Price Action têm o mesmo valor em todas as condições de mercado. O Adaptive Price Action Engine foi desenvolvido para se adaptar às mudanças nas condições do mercado, combinando estrutura de tendência, análise Multi-Timeframe, padrões de candlestick e otimização estatística em
Divergence Bomber
Ihor Otkydach
4.89 (94)
Cada comprador deste indicador recebe adicionalmente, e de forma gratuita: A ferramenta exclusiva "Bomber Utility", que acompanha automaticamente cada operação, define os níveis de Stop Loss e Take Profit e fecha operações de acordo com as regras da estratégia; Arquivos de configuração (set files) para ajustar o indicador em diferentes ativos; Set files para configurar o Bomber Utility nos modos: "Risco Mínimo", "Risco Balanceado" e "Estratégia de Espera"; Um vídeo tutorial passo a passo que a
Power Candles MT5
Daniel Stein
4.58 (12)
Power Candles V3 - Indicador de força com auto-otimização O Power Candles V3 transforma a força da moeda e do instrumento num plano de negociação prático em todos os gráficos aos quais está associado. Em vez de se limitar a colorir as velas, executa uma otimização automática em tempo real em segundo plano e apresenta-lhe os melhores valores de Stop Loss, Take Profit e limiar de sinal para o símbolo em questão. Basta um clique para o adotar na negociação em tempo real — as linhas de entrada, Stop
Currency Strength Wizard   é um indicador muito poderoso que fornece uma solução completa para uma negociação bem-sucedida. O indicador calcula o poder deste ou daquele par forex usando os dados de todas as moedas em vários intervalos de tempo. Esses dados são representados em uma forma de índice de moeda fácil de usar e linhas de energia de moeda que você pode usar para ver o poder desta ou daquela moeda. Tudo o que você precisa é anexar o indicador ao gráfico que deseja negociar e o indicador
Naked Forex Tweezer Pro Indicator Tweezer Pro Indicator is a pattern recognition indicator for Forex, Stocks, Indices, Futures, Commodities and Cryptos. The standard Tweezer is a two bar pattern. Our enhanced version is a multi-bar pattern. We filter the patterns for you so that you only get the     best and most effective patterns   and ignore the noise. The Tweezer pattern is a simple and effective pattern to trade. The strategy that comes with the Tweezer is based on price action. The Twe
Auto Optimized SpeedAngle é um sistema de vetorização de momentum de nível institucional que elimina o sobreajuste ( curve-fitting ) por meio da otimização contínua de avanço ( Walk-Forward Optimization , WFO). Em vez de depender de entradas estáticas que se degradam quando os regimes de mercado mudam, o indicador recalibra dinamicamente seus parâmetros utilizando validação fora de amostra ( Out-of-Sample , OOS), garantindo que os sinais exibidos representem vantagens estatísticas genuínas e não
Indicador multi-moeda de força e momentum MT5 O Dynamic Forex28 Navigator é a evolução dos nossos indicadores populares de longa data, reunindo o poder de cinco em um: Advanced Currency Strength28 Indicator (700 avaliações) Advanced Currency IMPULSE with ALERT (530 avaliações) Currency Strength EXOTICS GOLD Impulse with Alert CS28 Combo Signals (bônus atual) Não é necessário comprar quatro indicadores e empilhá-los nos seus gráficos. Tudo está reunido em um único indicador poderoso: a força dos
ARICoins
Temirlan Kdyrkhan
ARICoin is a powerful trading companion designed to generate high-probability entry signals with dynamic TP/SL/DP levels based on volatility. Built-in performance tracking shows win/loss stats, PP1/PP2 hits, and success rates all updated live. Key Features: Buy/Sell signals with adaptive volatility bands Real-time TP/SL/DP levels based on ATR Built-in MA Filter with optional ATR/StdDev volatility Performance stats panel (Success, Profit/Loss, PP1/PP2) Alerts via popup, sound, push, or email Cust
PZ Swing Trading MT5
PZ TRADING SLU
5 (5)
Swing Trading é o primeiro indicador projetado para detectar oscilações na direção da tendência e possíveis oscilações de reversão. Ele usa a abordagem de negociação de linha de base, amplamente descrita na literatura de negociação. O indicador estuda vários vetores de preço e tempo para rastrear a direção da tendência agregada e detecta situações nas quais o mercado está sobrevendido ou sobrecomprado em excesso e pronto para corrigir. [ Guia de instalação | Guia de atualização | Solução de prob
O Apollo SR Master é um indicador de Suporte/Resistência com recursos especiais que tornam a negociação com zonas de Suporte/Resistência mais fácil e confiável. O indicador calcula as zonas de Suporte/Resistência em tempo real, sem qualquer atraso, detectando topos e fundos de preço locais. Em seguida, para confirmar a área de Suporte/Resistência recém-formada, o indicador exibe um sinal especial que indica que a zona pode ser considerada e usada como um sinal de VENDA ou COMPRA. Nesse caso, a f
Neuro Poseidon MT5
Daria Rezueva
4.68 (53)
Neuro Poseidon is a new indicator by Daria Rezueva. It combines precise trading signals with adaptive TP/SL levels - creating best possible trades as a result! Message me and get  Neuro Poseidon Assistant  as a gift to automize your trading process! What makes it stand out? 1. Proven profitability on all assets and timeframes 2. Only confirmed BUY and SELL signals present on the chart 3. Adaptive TP & SL levels generated by the software for each trade 4. Easy to understand - suitable for al
SIO Oscillator: oscilador auto-otimizável de desequilíbrio de semivariância Compre o indicador e receba GRÁTIS o Expert Advisor (EA) baseado nele. A maioria dos osciladores trata todo movimento de preço da mesma forma. O SIO separa a pressão de alta da pressão de baixa e mede o desequilíbrio entre elas, mostrando qual lado realmente controla o mercado: compradores ou vendedores. Quando o desequilíbrio atinge um extremo, o SIO gera um sinal claro com níveis de entrada, Stop Loss e Take Profit. O

Advanced Supply Demand MT5
Bernhard Schweigert
4.53 (15)
Atualmente com 33% de desconto! A melhor solução para qualquer Trader Novato ou especialista! Este indicador é uma ferramenta de negociação exclusiva, de alta qualidade e acessível porque incorporamos uma série de recursos proprietários e uma nova fórmula. Com esta atualização, você poderá mostrar fusos horários duplos. Você não só será capaz de mostrar um TF mais alto, mas também mostrar ambos, o TF do gráfico, MAIS o TF mais alto: MOSTRANDO ZONAS ANINHADAS. Todos os traders de Oferta e Demanda
ScalpPoint
Temirlan Kdyrkhan
ScalpPoint is a powerful trading companion designed to generate high-probability entry signals with dynamic TP/SL/DP levels based on volatility. Built-in performance tracking shows win/loss stats, PP1/PP2 hits, and success rates — all updated live. Key Features: Buy/Sell signals with adaptive volatility bands Real-time TP/SL/DP levels based on ATR Built-in MA Filter with optional ATR/StdDev volatility Performance stats panel (Success, Profit/Loss, PP1/PP2) Alerts via popup, sound, push, or emai
Astral Structure
Ottaviano De Cicco
Astral Structure Avalie o setup. Veja o plano inicial. Oferta de lançamento - $99. $149 após o lançamento. Um setup de estrutura levanta várias perguntas: a visão mais ampla concorda, onde está a referência de stop e como os alvos são definidos? O Astral Structure reúne essas questões em um espaço de trabalho para traders discricionários que baseiam suas decisões na estrutura do mercado. Concentre-se no setup relevante. Revise em conjunto o setup elegível mais recente, sua direção e sua qualific
Superhero
Ihor Otkydach
5 (3)
O indicador SUPERHERO é um sistema de negociação multimoeda concebido numa base «tudo incluído». O indicador analisa o mercado de forma independente e fornece sinais sobre quando abrir e encerrar posições. Utiliza ordens Stop Loss e Take Profit. O rácio R:R é de 1:1. Este sistema pode enviar notificações push para o seu smartphone, para que possa realizar transações «em qualquer lugar», sem precisar de estar preso a um computador. É perfeito para empresas de negociação por conta própria. UM BÓNU

Bill Williams Advanced
Siarhei Vashchylka
5 (11)
Bill Williams Advanced is designed for automatic chart analysis using Bill Williams' "Profitunity" system. The indicator analyzes four timeframes at once. Manual (Be sure to read before purchasing) Advantages 1. Analyzes the chart using Bill Williams' "Profitunity" system. Signals are displayed in a table in the corner of the screen and on the price chart. 2. Finds all known AO and AC signals, as well as zone signals. Equipped with a trend filter based on the Alligator. 3. Finds "Divergence Bar

Naked Forex Kangaroo Tail Pro Indicator Kangaroo Tail Pro Indicator is a pattern recognition indicator for Forex, Stocks, Indices, Futures, Commodities and Cryptos. The Kangaroo Tail is a multi-bar pattern. The Kangaroo Tail pattern is very effective and is very simple to trade. The strategy that comes with the Kangaroo Tail is based on price action. The indicator does what it was designed for: displaying Kangaroo Tail patterns.     Don't expect to follow the up and down arrows and make mone
AriFocus
Temirlan Kdyrkhan
AriFocus - Non-Repainting Buy/Sell Signals AriFocus - one clear signal. AriFocus marks buy and sell signals directly on the chart and suggests a stop-loss level for each one. Every signal is confirmed on bar close and never repaints. - Buy/sell arrows, confirmed on bar close - Suggested stop-loss level for every signal - Trend band and candle coloring to show direction at a glance - 10 ready-made presets, or your own settings (14 calculation methods) - Pop-up, push and email alerts with entr
RSI Thunder MT5
Muhammad Abdulrahman Omar Naima Allah Al-rais
RSI Thunder é um indicador de trading poderoso e inteligente, desenvolvido para traders que valorizam precisão e consistência. Ele gera sinais somente após o fechamento da vela, evitando repaint e sinais falsos. O indicador combina RSI, EMA, ADX e ATR com um filtro de tendência baseado na SMA40. Analisa as últimas cinco velas e confirma operações apenas quando a ação do preço é clara. As entradas são exibidas por setas visuais, com Take Profit automático baseado no ATR. Ideal para traders inici
Mais do autor
KT Support and Resistance Levels MT5
KEENBASE SOFTWARE SOLUTIONS
5 (1)
KT Auto Support Resistance Levels: S&R multi-timeframe, Smart Zones e painel de níveis para MetaTrader 4/5 Topos de swing. Pivôs. Order blocks. Máximas e mínimas anteriores. Cada trader marca o mercado de um jeito um pouco diferente, e quem paga o preço é o gráfico. Coloque métodos demais em uma única tela e ele deixa de ser um mapa. Vira ruído. KT Auto Support Resistance Levels resolve isso. Ele escaneia ao mesmo tempo o timeframe mensal, semanal, diário e o seu timeframe atual, depois desenha
KT Stoch Divergence MT4
KEENBASE SOFTWARE SOLUTIONS
Se você já viu o preço fazer uma nova máxima enquanto o Estocástico não confirmou o movimento, então já entende por que os traders acompanham divergências. O KT Stoch Divergence marca essas diferenças diretamente no gráfico, ajudando a encontrar possíveis reversões e continuações de tendência sem precisar desenhar cada linha manualmente. O indicador identifica divergências regulares e ocultas entre o preço e o oscilador Estocástico. Ele oferece contexto, não uma ordem automática. A decisão final
ACB Breakout Arrows
KEENBASE SOFTWARE SOLUTIONS
4.15 (34)
Sinais de rompimento com contexto de mercado ACB Breakout Arrows detecta uma fase de estabilização do preço seguida por um rompimento direcional e marca a configuração com uma seta de compra ou venda. A seta identifica um padrão de rompimento. Ela não garante que todo sinal se transforme em um grande movimento. Uma seta de compra destaca uma configuração de rompimento de alta, enquanto uma seta de venda destaca uma configuração de baixa. Como o preço pode testar novamente a área rompida ou retor
ACB Trade Filter MT4
KEENBASE SOFTWARE SOLUTIONS
5 (1)
Antes de abrir uma operação, o ACB Trade Filter ajuda a responder uma pergunta prática: o mercado está apoiando esta entrada ou você está tentando forçar um sinal em condições contraditórias? O indicador analisa o sentimento do mercado e a tendência, e apresenta o resultado por meio de um histograma colorido e da direção da tendência. Use o filtro depois do seu sinal normal de entrada, não no lugar dele. Três estados do mercado de forma rápida Histograma verde com tendência de alta: as condições
KT Momentum Arrows
KEENBASE SOFTWARE SOLUTIONS
O KT Momentum Arrows marca rompimentos de momentum de alta e de baixa com setas quando um candle fecha além de suas bandas de preço adaptativas. As bandas respondem ao desvio do preço e às mudanças de volatilidade. Uma seta azul para cima confirma um fechamento acima da banda superior, enquanto uma seta vermelha para baixo confirma um fechamento abaixo da banda inferior. O sinal fica fixo depois que o candle fecha, portanto a seta não muda para outra barra quando você revisa o gráfico mais tarde
KT COG Advanced MT4
KEENBASE SOFTWARE SOLUTIONS
1 (1)
KT COG is an advanced implementation of the center of gravity indicator presented by John F. Ehlers in the May 2002 edition of Technical Analysis of Stocks & Commodities magazine. It's a leading indicator which can be used to identify the potential reversal points with the minimum lag. The COG oscillator catches the price swings quite effectively. MT5 version of the same indicator is available here KT COG Advanced MT5 Calculation of COG The COG indicator is consist of the two lines. The main l
KT Pin Bar
KEENBASE SOFTWARE SOLUTIONS
KT Pin Bar identifies the pin bar formation which is a type of price action pattern which depicts a sign of reversal or rejection of the trend. When combined with support and resistance, BRN and other significant levels, Pin Bar pattern proved to be a very strong sign of reversal. Basically, a pin bar is characterized by a small body relative to the bar length which is closed either in upper or lower 50% part of its length. They have very large wicks and small candle body. A pin bar candlestic
KT Trend Magic
KEENBASE SOFTWARE SOLUTIONS
Leia a direção da tendência diretamente no gráfico O KT Trend Magic combina momentum e volatilidade em uma linha colorida que acompanha o preço. A linha oferece uma visão contínua do estado atual da tendência e muda de cor quando a direção calculada se altera. Linha verde: mostra um estado de tendência altista. Linha vermelha: mostra um estado de tendência baixista. Mudança de cor: marca uma nova transição direcional no gráfico. Durante um movimento sustentado, a linha também pode servir como re
KT Auto Fibo
KEENBASE SOFTWARE SOLUTIONS
Auto Fibonacci indicator that draws the Fibonacci retracement on the swing you are looking at, and redraws it the moment you zoom or scroll the chart. Zoom in on a pullback and the levels measure that pullback. Zoom out and they measure the whole trend. There are no anchor points to drag and no levels to redraw after every new high. Key features Measures the highest high and the lowest low on your screen, the current candle included. Follows zoom, scroll and window size at once, even when the ma
KT Psar Arrows
KEENBASE SOFTWARE SOLUTIONS
O KT Psar Arrows plota setas no gráfico utilizando o indicador padrão Parabolic SAR. Uma seta de alta é desenhada quando a máxima da vela toca o SAR. Uma seta de baixa é desenhada quando a mínima da vela toca o SAR. Os sinais são gerados em tempo real, sem a necessidade de esperar o fechamento da vela.  Recursos Uma ferramenta útil para traders que desejam experimentar estratégias de negociação que envolvem o indicador Parabolic SAR.  Pode ser usado para identificar pontos de reversão no mercad
KT Ichimoku Trader
KEENBASE SOFTWARE SOLUTIONS
1 (1)
Cinco estratégias Ichimoku operadas automaticamente KT Ichimoku Trader é um Expert Advisor que abre e fecha operações automaticamente com cinco estratégias clássicas de Ichimoku Kinko Hyo. Você ativa as estratégias que deseja e cada uma opera por conta própria: com suas próprias regras de entrada, suas próprias regras de saída e no máximo uma operação aberta por estratégia ao mesmo tempo. Cada entrada é verificada em um candle fechado. Quando um novo candle abre, o EA lê o candle que acabou de f
KT Volatility Oscillator
KEENBASE SOFTWARE SOLUTIONS
O Oscilador de Volatilidade KT analisa os dados de mercado passados e atuais utilizando uma fórmula matemática para exibir o resultado na forma de um oscilador. As ondas crescentes e decrescentes equivalem a alta e baixa volatilidade do ativo.  Em resumo, a volatilidade é simplesmente uma medida das flutuações de preço de um ativo ao longo de um determinado período de tempo. Sem volatilidade, haveria pouco movimento no mercado e os traders não poderiam lucrar com as variações de preço. Uso da V
KT COG Robot
KEENBASE SOFTWARE SOLUTIONS
KT COG Robot is a fully automated Expert Advisor based on the KT COG Indicator . The COG indicator was originally presented by John F. Ehlers in the May 2002 edition of Technical Analysis of Stocks & Commodities magazine. The EA fires a long trade when COG line cross above the signal line and a short trade is fired when the COG line cross below the signal line.  Adaptive Filtration Our adaptive filtration algorithm combines the original COG formula with the major trend direction and market acce
ACB Breakout Arrows EA
KEENBASE SOFTWARE SOLUTIONS
Automatize o fluxo de rompimento ACB O ACB Breakout Arrows EA avalia sinais de rompimento no gráfico ativo e gerencia operações com a lógica integrada do ACB Breakout Arrows e do ACB Trade Filter. Anexe o EA ao ativo e período gráfico que deseja monitorar, habilite a negociação automática e depois escolha as regras de posição, sessão, filtros e saída adequadas ao seu plano de teste. Os indicadores e componentes necessários estão incorporados ao EA, portanto não é preciso fazer download separado.
KT Asian Breakout
KEENBASE SOFTWARE SOLUTIONS
4 (1)
KT Asian Breakout carefully analyzes the range-bound market during the Asian session and then fires a long or short trade after doing some preassessment based on its inbuilt technical analysis module. The executed orders are closed within a day before the completion of the next day session. The inbuilt technical analysis module checks for the session range and compares it with the last 20 days price movement. If it finds any erratic price movement within the session, the orders are not executed
KT London Breakout
KEENBASE SOFTWARE SOLUTIONS
First thirty minutes are essential for a trading session. The early reaction of traders and market players sets a path for the rest of the day. KT London Breakout EA takes advantage of this phenomenon, and after analyzing the first thirty minutes of London session, it places two bidirectional pending orders. One of pending order is eventually canceled after realizing the market direction with certainty. It has been strictly tested and developed for EUR/JPY using 30-Min Time Frame. You can expe
KT Auto Support Resistance Levels: S&R multi-timeframe, Smart Zones e painel de níveis para MetaTrader 4/5 Topos de swing. Pivôs. Order blocks. Máximas e mínimas anteriores. Cada trader marca o mercado de um jeito um pouco diferente, e quem paga o preço é o gráfico. Coloque métodos demais em uma única tela e ele deixa de ser um mapa. Vira ruído. KT Auto Support Resistance Levels resolve isso. Ele escaneia ao mesmo tempo o timeframe mensal, semanal, diário e o seu timeframe atual, depois desenha
Currency strength and pair correlation in one indicator KT Currency Strength and Correlation ranks the eight major currencies from strongest to weakest and shows, in a colored matrix, how closely ten currency pairs of your choice move together. Before you open a trade from your own strategy, you can check whether the two currencies of the pair are really moving apart, and whether the new trade adds risk to a trade you already hold. What you see on the chart Strength lines: a separate window belo
MACD Divergence Seeker
KEENBASE SOFTWARE SOLUTIONS
KT MACD Divergence Seeker trades the regular and hidden divergence signals generated by our free indicator named KT MACD Divergence indicator. Trading the standalone divergences can be a risky affair that's why the KT MACD Divergence Seeker combines the standard divergence signals with an advanced analysis module to exploit the price inefficiencies on some FX pairs. What is the Divergence exactly? As a general conception if the price is making higher highs, then macd should also be making hig
KT Asian Breakout Indicator
KEENBASE SOFTWARE SOLUTIONS
Marque o intervalo da sessão asiática O KT Asian Breakout Indicator marca a máxima e a mínima de uma janela de quatro horas da sessão asiática e acompanha o preço depois que o intervalo é concluído. O parâmetro GMT Offset alinha a sessão ao horário do servidor da sua corretora, enquanto Draw Session Box controla a exibição do intervalo. Veja o rompimento e os níveis da operação juntos Uma seta altista aparece quando o preço fecha acima da máxima da sessão. Uma seta baixista aparece quando o preç
MACD Divergence MT4
KEENBASE SOFTWARE SOLUTIONS
O KT MACD Divergence mostra as divergências regulares e ocultas formadas entre o preço e o oscilador. Se sua estratégia de trading antecipa uma reversão de tendência, você pode usar a divergência regular do MACD para identificar possíveis pontos de virada. Já se sua estratégia é baseada na continuação da tendência, a divergência oculta do MACD será uma boa escolha. Limitações do KT MACD Divergence Usar a divergência do MACD como único sinal de entrada pode ser arriscado. Nem toda divergência d
KT Bollinger Bands Trader MT4
KEENBASE SOFTWARE SOLUTIONS
O KT Bollinger Bands Trader é um consultor especializado 100% automatizado que utiliza uma estratégia de reversão à média com base nas Bandas de Bollinger durante períodos de baixa volatilidade. O preço frequentemente reage nas linhas superior ou inferior das bandas, mas a reversão nem sempre ocorre. No entanto, as chances de reversão aumentam em momentos de baixa volatilidade. Entradas Uma compra é ativada quando o preço se alinha corretamente abaixo da linha inferior das Bandas de Bollinger.
KT CCI Divergence MT4
KEENBASE SOFTWARE SOLUTIONS
KT CCI Divergence shows the regular and hidden divergence created between the price and CCI oscillator. Divergence is one of the vital signals that depicts the upcoming price reversal in the market. Manually spotting the divergence between price and CCI can be a hectic and ambiguous task. Limitations of KT CCI Divergence   Using the CCI divergence as a standalone entry signal can be risky. Every divergence can't be interpreted as a strong reversal signal. For better results, try to combine it w
KT Heiken Ashi Smoothed MT4
KEENBASE SOFTWARE SOLUTIONS
Acompanhe o estado suavizado do Heiken Ashi O KT Heiken Ashi Smoothed transforma o movimento do preço em velas azuis e vermelhas suavizadas. Ele adiciona uma seta azul para cima quando o estado muda de baixista para altista e uma seta vermelha para baixo quando muda de altista para baixista, facilitando a visualização das transições de direção no gráfico. O período e o método de suavização controlam a intensidade da suavização das velas. Isso oferece uma visão mais estável que o Heiken Ashi padr
KT MA Crossover MT4
KEENBASE SOFTWARE SOLUTIONS
O KT MA Crossover desenha setas de compra e venda com base no cruzamento das médias móveis selecionadas. Além disso, ele também gera os alertas apropriados e exibe o valor de MFE (Excursão Mais Favorável) para cada sinal consecutivo. O cruzamento de médias móveis é uma das estratégias mais utilizadas por traders em todo o mundo. Normalmente envolve uma média móvel rápida e uma lenta para identificar sinais de compra e venda com base na direção do cruzamento. Sinal de compra – quando a média móv
KT Round Numbers MT4
KEENBASE SOFTWARE SOLUTIONS
KT Round Numbers plots the round number levels which are also commonly known as psychological levels in the Forex world. In the context of Forex trading, round number levels are those levels in which there are two or more zeroes at the end. They are named as 00 levels on the chart. Some traders also consider the halfway points as a valid round number level. They are named as 50 levels on the chart. Use of round number levels in trading Round number levels work as strong support and resistance
KT Inside Bar Advanced MT4
KEENBASE SOFTWARE SOLUTIONS
Despite the popularity of inside bar pattern among the traders, using it as a standalone signal doesn't provide any edge in the market. KT Inside Bar Advanced indicator solves this problem by combining the classic inside bar pattern with the "ECE" cycle and Fibonacci extensions. Using this indicator in place of our classic inside bar indicator will provide a tremendous advantage and edge in the market. What is the ECE cycle? In financial markets, the price never moves in a straight line but u
KT Inside Bar Hunter MT4
KEENBASE SOFTWARE SOLUTIONS
Despite the popularity of inside bar pattern among traders, using it as a standalone entry signal doesn't provide any evidentiary advantage. KT Inside Bar Hunter trades only selected inside bar patterns using some preassessment and ECE price action cycle. Trading Strategy On successful detection of the required pattern, EA places a pending order in the direction of the forecasted price expansion phase. Pending orders are canceled if they are not triggered within the next bar. Once triggered, ac
KT CCI Surfer MT4
KEENBASE SOFTWARE SOLUTIONS
KT CCI Surfer uses a mean reversion trading strategy with a combination of extreme overbought/oversold zone detection using the Commodity Channel Index (CCI). Developed by Donald Lambert in 1980, CCI is a leading indicator that helps to identify the overbought/oversold region in the market without any lag. Obviously, not every overbought/oversold signal turns out into a price reversal. However, when combined with a well-planned mean reversion strategy, it produces excellent results. Recommend
KT RSI Divergence Robot MT4
KEENBASE SOFTWARE SOLUTIONS
Negocie divergências RSI confirmadas O KT RSI Divergence Robot monitora divergências regulares e ocultas entre o preço e o Índice de Força Relativa no símbolo e período gráfico em uso. Ele avalia novos sinais depois que uma barra é concluída. Uma divergência de alta pode abrir uma posição de compra, enquanto uma divergência de baixa pode abrir uma posição de venda. Quando surge um sinal oposto, o EA pode fechar posições na outra direção antes de avaliar uma nova entrada. Escolha as condições de
Filtro:
jets2270
21
jets2270 2023.04.24 08:51 

thought it was a bot but i was wrong , was looking for it to go auto trading

KEENBASE SOFTWARE SOLUTIONS
61179
Resposta do desenvolvedor Nitin Raj 2025.03.25 18:28
Fully automated candlestick patterns ea is available here: https://www.mql5.com/en/market/product/62261
Responder ao comentário