KT Candlestick Patterns MT5
- 지표
-
KEENBASE SOFTWARE SOLUTIONS
 Keenbase Trading은 트레이더가 더욱 정확하고 신뢰할 수 있는 거래 결정을 내릴 수 있도록 MetaTrader 4 및 MetaTrader 5용 전문 지표와 Expert Advisor(EA)를 개발합니다.
당사의 제품은 실전에서 활용할 수 있는 거래 로직과 직관적인 사용자 경험을 결합하여 안정성, 사용 편의성, 그리고 체계적인 리스크 관리에 중점을 두고 설계되었습니다. 모든 도구는 철저한 테스트를 거쳐 실제 시장 환경에서도 일관되고 안정적인 성능을 제공할 수 있도록 개발됩니다. - 버전: 1.1
- 활성화: 5
KT Candlestick Patterns는 실시간으로 24가지 가장 신뢰할 수 있는 일본 캔들 패턴을 찾아 차트에 표시합니다. 일본 트레이더들은 18세기부터 이러한 패턴을 사용해 가격 방향을 예측해왔습니다.
모든 캔들 패턴이 동일한 신뢰도를 가지는 것은 아니지만, 지지/저항 같은 다른 기술적 분석과 결합하면 시장 상황을 명확하게 보여줍니다.
이 지표는 Steve Nison의 책 "Japanese Candlestick Charting Techniques"에 소개된 많은 패턴을 포함하고 있습니다.
책에서 다루지 않는 복잡한 패턴들도 감지할 수 있어 더욱 강력한 기능을 제공합니다.
기능
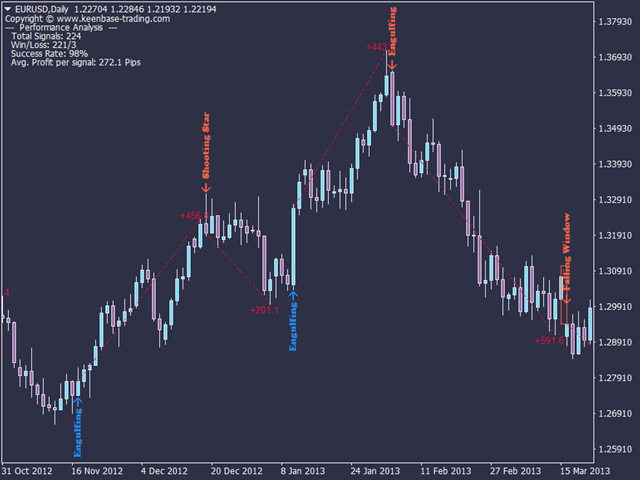
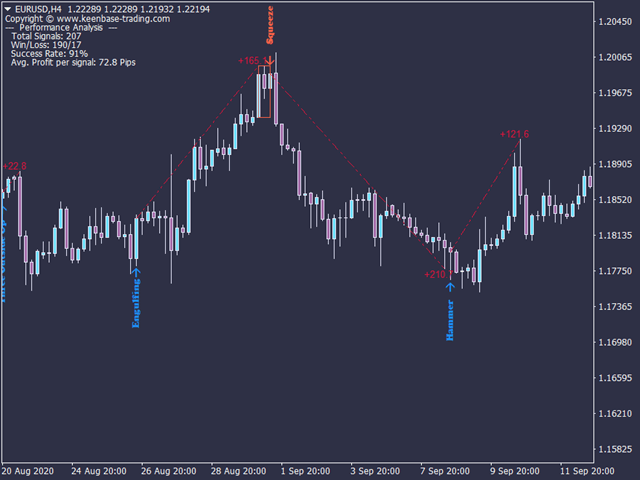
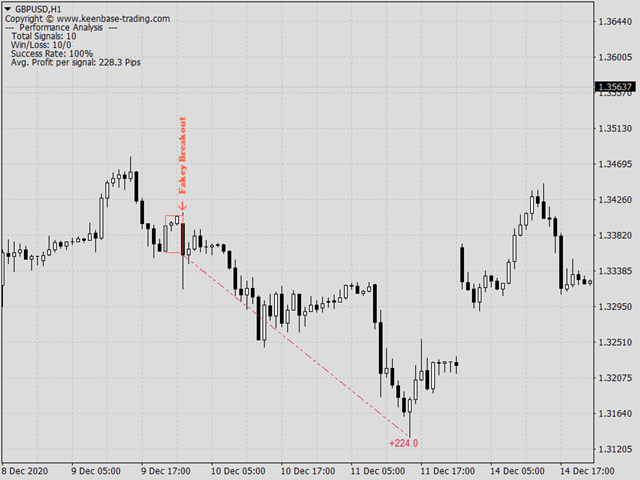
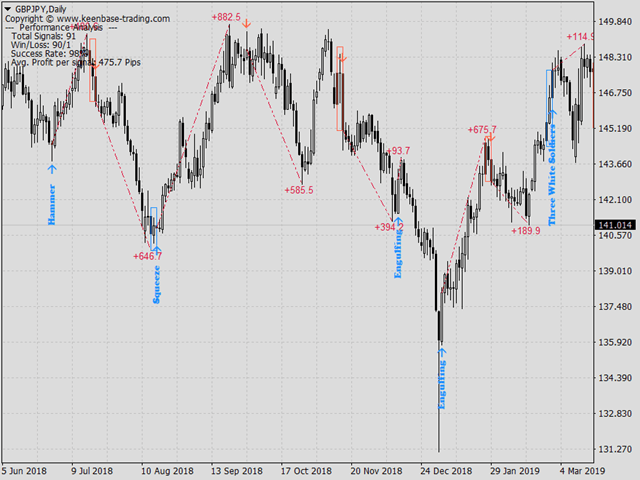
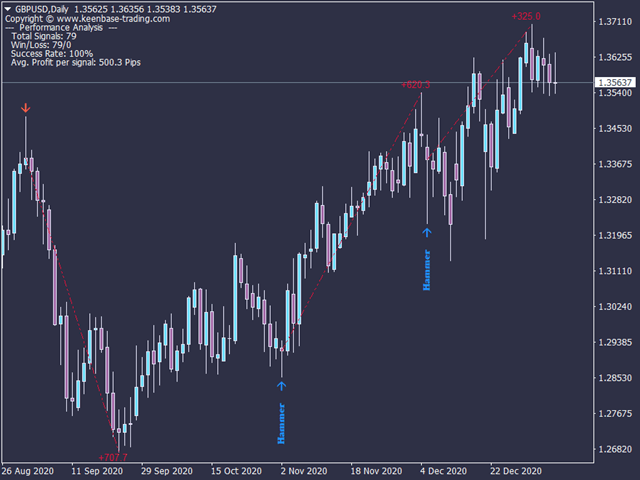
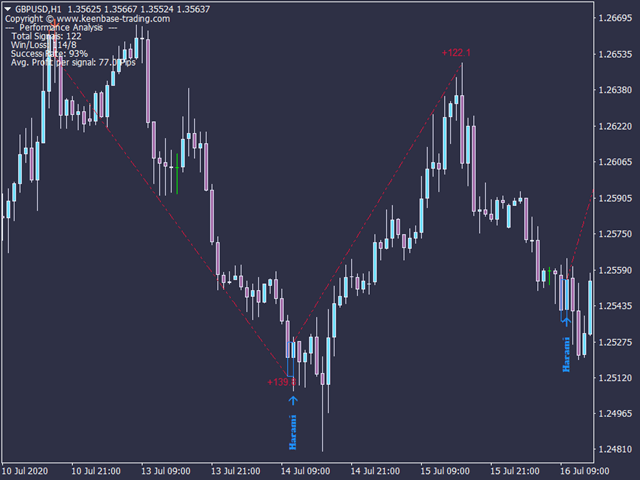
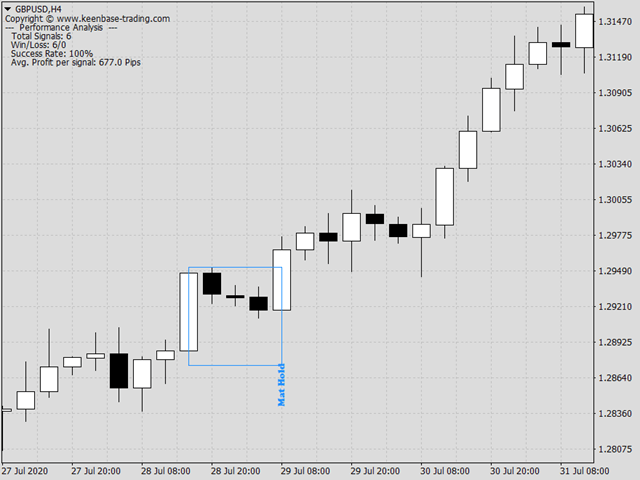
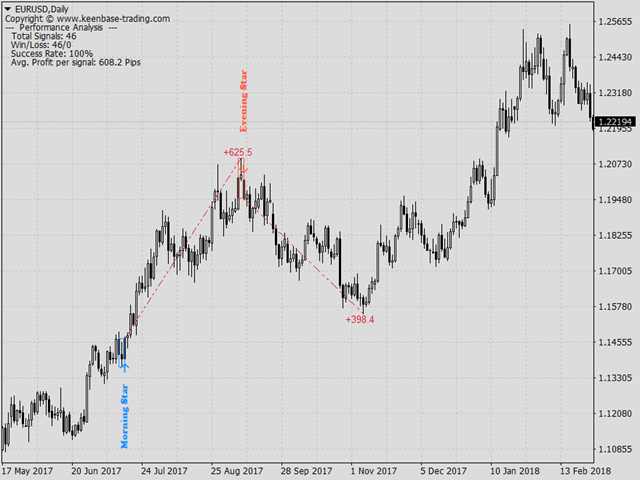
- 각 신호에서 고정된 핍 수익을 목표로 설정하면, 지표가 해당 목표에 대한 성공률을 실시간으로 계산합니다.
- 일본의 유명한 24가지 캔들 패턴을 높은 정확도로 식별합니다.
- 각 패턴의 성능을 분석하고 정확도를 실시간으로 보여주는 모듈이 내장되어 있습니다.
- 패턴 간 최소 바 수를 설정할 수 있어 차트를 깔끔하게 유지하며 신호의 신뢰도를 높입니다.
- 시장 추세와 함께 패턴을 식별하여 더 정확한 분석이 가능합니다.
- 반전형, 추세 지속형, 중립형(도지) 패턴을 모두 포함합니다.
- 모든 메타트레이더 알림 기능이 포함되어 있습니다.
포함된 패턴
----- 반전 패턴 -----
- 하라미
- 망치 / 유성
- 엔골핑
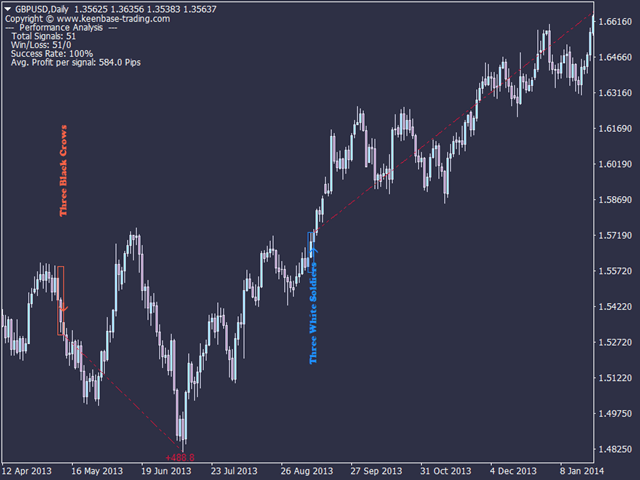
- 세 개의 백병 / 세 개의 흑조
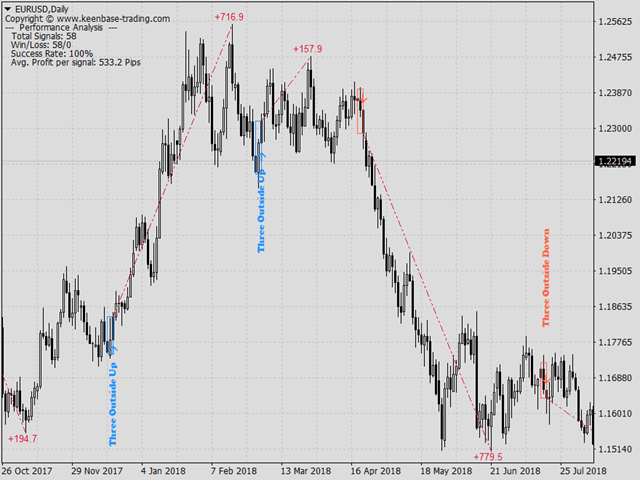
- 세 개 외부형
- 세 개 내부형
- 아침별 / 저녁별
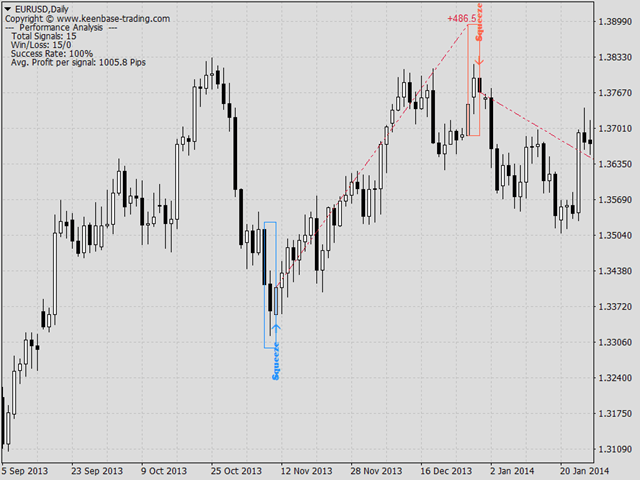
- 스퀴즈
- 벨트 홀드
- 먹구름 / 관통선
- 전진 차단 / 하강 차단
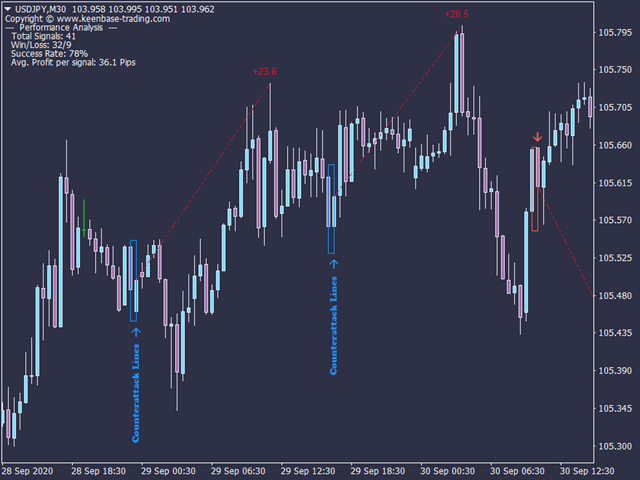
- 역습선
- 사다리 바닥 / 꼭대기
- 킥커
- 집비둘기 / 하강 매
----- 추세 지속 패턴 -----
- 마루보주
- 상승 창 / 하락 창
- 가짜 돌파
- 매트 홀드
- 상승 삼법 / 하락 삼법
----- 중립 패턴 -----
- 단순 도지
- 긴 다리 도지
- 묘석형 도지
- 잠자리 도지
신호 정확도 최적화
- 각 패턴이 True로 설정되어 있는지 확인하세요.
- 원하는 성공 기준 핍 수치를 입력하세요.
- 각 패턴을 하나씩 꺼보고 성공률을 확인하세요.
- 성공률이 오르면 끈 상태를 유지하세요.
- 떨어지면 다시 켜세요.
- 패턴 사이 최소 바 수를 10~50으로 조정하세요.
바 수를 늘리면 정확도가 향상되지만 신호 수는 줄어듭니다. 10~50 사이에서 적절한 값을 선택하세요.
입력 파라미터
- 히스토리 바: 계산에 사용할 캔들의 수입니다. 느려지면 수치를 줄이세요.
- 패턴 사이 최소 바 수: 신호 간 최소 거리 설정.
- 패턴 이름 표시: 각 패턴의 이름을 차트에 표시.
- 패턴 선택: 종목과 시간 프레임에 맞는 패턴을 활성화/비활성화.
- 성능 분석: 각 신호의 성공률을 실시간으로 보여줍니다.
- 성공 기준 핍: 성공률 평가 기준이 되는 목표 수익 핍.
- 텍스트 분석 보기: 차트 왼쪽 상단에 정보 표시 여부 설정.
thought it was a bot but i was wrong , was looking for it to go auto trading