KT Renko Patterns MT5

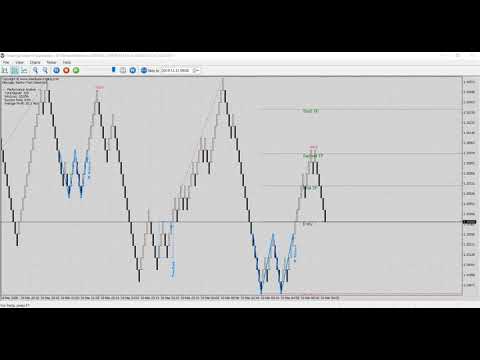
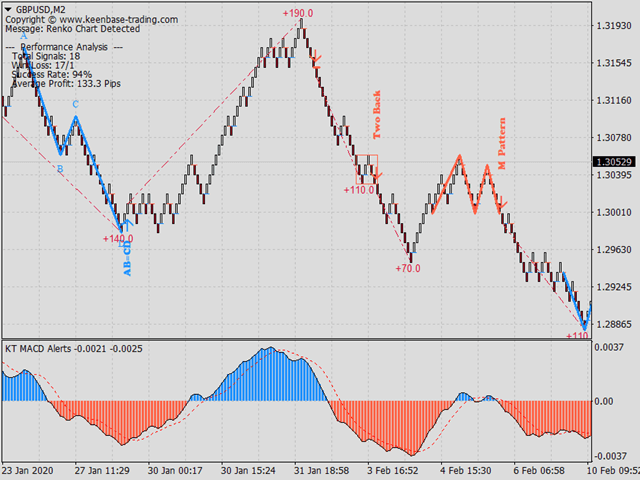
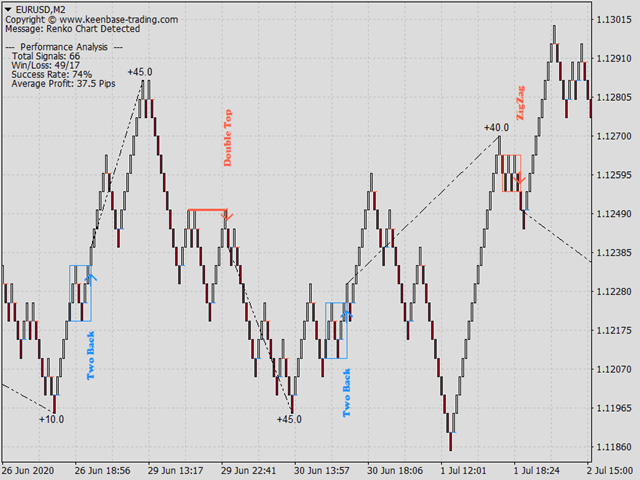
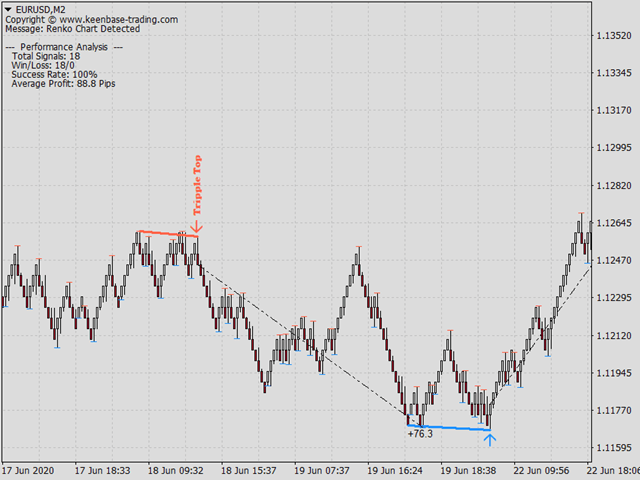
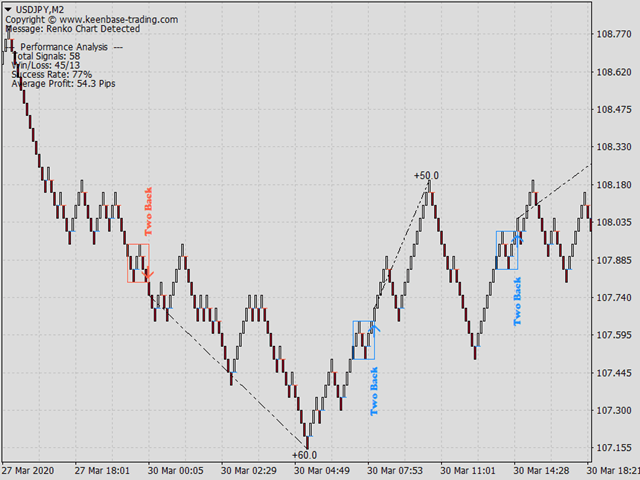
KT Renko Patterns は、レンコチャートの各レンガをスキャンしながら、さまざまな金融市場でトレーダーによく使用されている有名なチャートパターンを検出します。

時間ベースのチャートと比較して、レンコチャートは視認性が高くシンプルなため、パターンベースのトレードがより簡単かつ明確になります。

KT Renko Patterns は複数のレンコパターンを搭載しており、その多くは Prashant Shah 氏の著書『Profitable Trading with Renko Charts』でも詳しく解説されています。

KT Renko Patterns インジケーターに基づいた 100% 自動化された EA は、こちらからご利用いただけます - KT Renko Patterns EA


機能一覧

  • 最大8種類の明確なレンコパターンを表示し、あいまいさなく取引をサポートします。
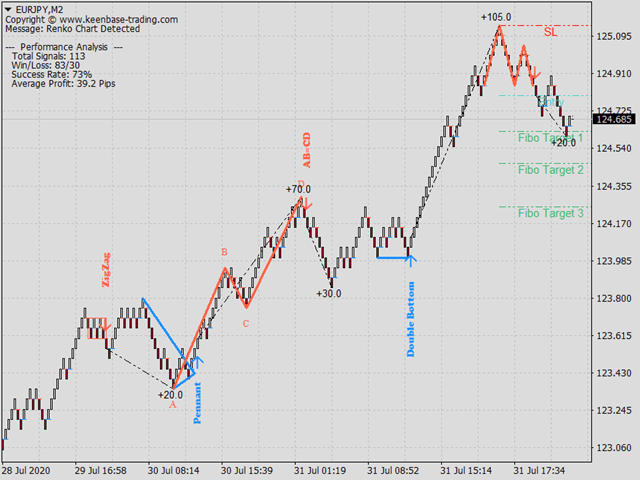
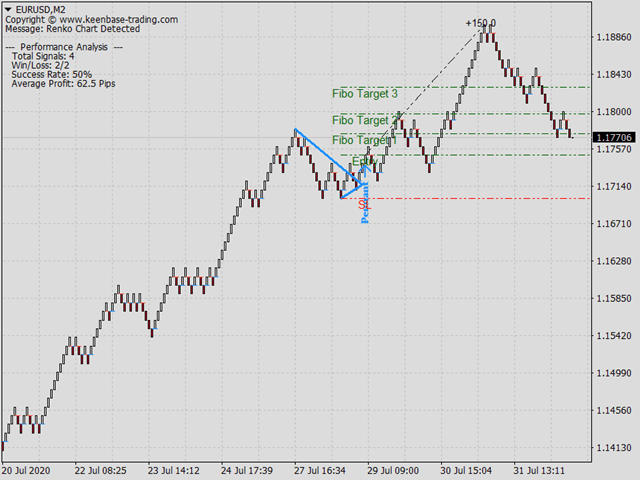
  • 完全な客観性を保つため、すべてのパターンにストップロスとフィボナッチターゲットが設定されています。
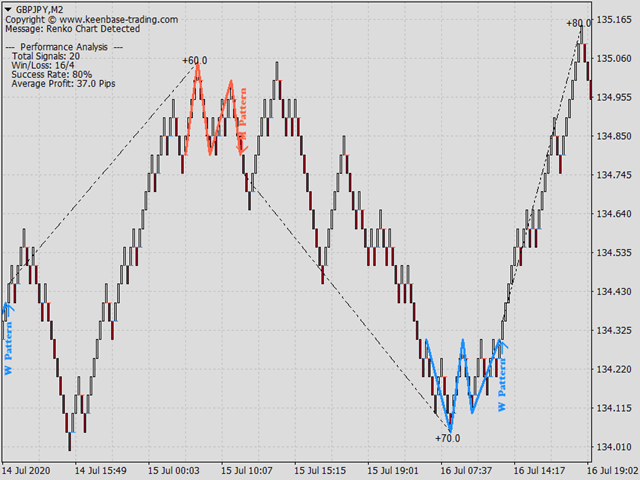
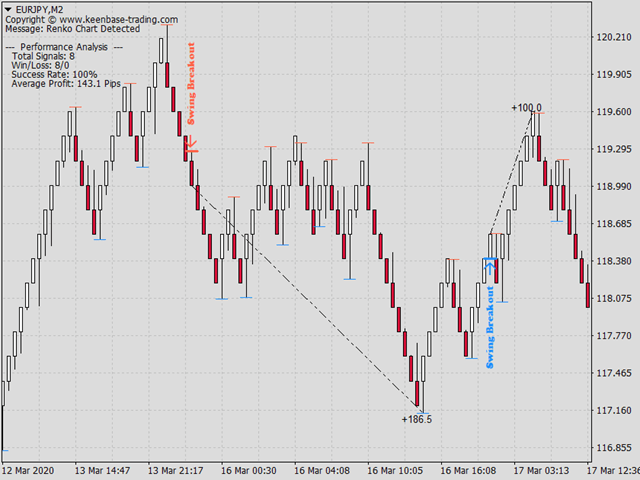
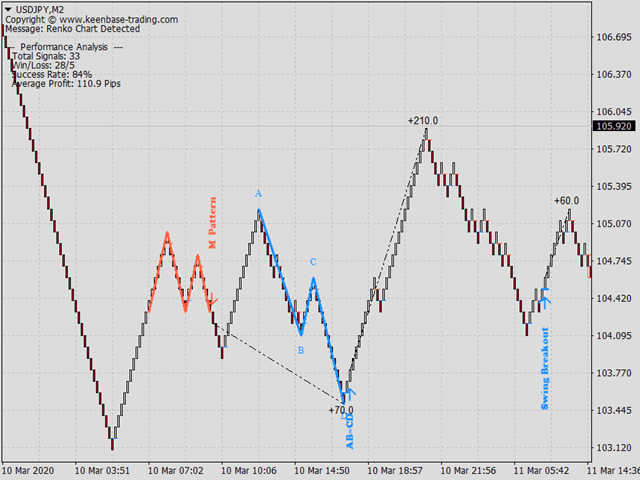
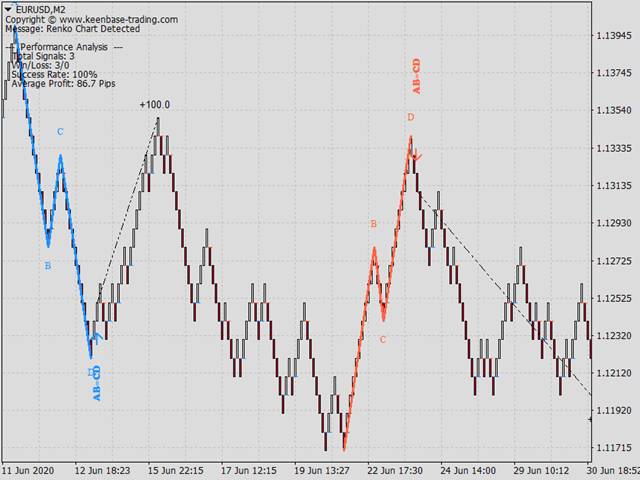
  • KT Renko Patterns は各パターンの精度を継続的に測定し、重要な統計情報をチャート上に表示します。
  • レンガの反転が明確にマークされ、アラートも提供されるため、突然の相場反転時の早期退出が計画しやすくなります。
  • 検出されたパターンは再描画や変更が一切ありません。


搭載パターン

  • W-M パターン
  • パワーペナント
  • AB=CD パターン
  • トリプルトップ/トリプルボトム
  • ダブルトップ/ダブルボトム
  • Two Back Strike
  • ジグザグレンガ
  • スイングブレイクアウト

シグナル精度の最適化 

KT Renko Patterns は複数のパターンを表示しますが、すべてが全ての銘柄に適しているとは限りません。以下の手順を実行することで、シグナルの精度を簡単に向上させることができます。

  1. 各パターンの設定が「True」になっていることを確認します。
  2. 「成功率の基準」を選択します(2つ目のTPがおすすめです)。
  3. 各パターンを1つずつオフにして、成功率の変化を確認します。
  4. 成功率が上がれば、そのパターンはオフのままでOKです。
  5. 成功率が下がった場合は再びオンに戻します。
  6. 「パターン間の最小バー数」を20~100の間で調整します。
パターン同士の間隔(バー数)を増やすことで通常は成功率が向上しますが、高すぎる値はシグナル数を大きく減少させるため、バランスの取れた設定(20~100)をおすすめします。


入力パラメータ

  • パターン間の最小バー数:  各パターンの間に必要な最小バー数。シグナル精度を向上させます。
  • 反転レンガのマーク:  レンコレンガの反転をチャートに表示します。
  • 反転時のアラート:  有効にすると、各反転時にアラートを生成します。
  • パターン名の表示:  各シグナルにパターン名を表示します。
  • パフォーマンス分析:  インジケーターの精度を測定し、主要なメトリクスを表示します。
  • 成功率の基準:  シグナル成功率を測定するための基準を選択します。


よくある質問

Q. 通常の時間ベースのチャートでも使えますか?

A. KT Renko Patterns はレンコチャート専用に設計されています。通常の時間チャートでも使用可能ですが、推奨はされません。


Q. シグナルの精度を最適化する方法はありますか?

A. はい。最適化手順は上記の説明に記載されています。


Q. 新しいパターンの提案があります。追加できますか?

A. メッセージをお送りください。有用と判断されれば、次回バージョンで追加される可能性があります。


Q. このインジケーターを EA に組み込めますか?

A. 可能です。インポート用の開発者コードについてご連絡ください。

おすすめのプロダクト
SMC Venom Model BPR インジケーターは、スマート マネー (SMC) コンセプトで取引するトレーダー向けのプロフェッショナル ツールです。価格チャート上の 2 つの主要なパターンを自動的に識別します。 FVG   (フェアバリューギャップ) は、3 本のローソク足の組み合わせで、最初のローソク足と 3 番目のローソク足の間にギャップがあります。ボリュームサポートのないレベル間のゾーンを形成し、価格修正につながることがよくあります。 BPR   (バランス価格範囲) は、2 つの FVG パターンの組み合わせで、「ブリッジ」を形成します。これは、価格がボリュームアクティビティの少ない動きで動くときに、ブレイクアウトしてレベルに戻るゾーンで、ローソク足の間にギャップを作成します。 これらのパターンは、大規模な市場プレーヤーと一般参加者の相互作用が発生するチャート上のボリュームと価格動向の分析に基づいて、トレーダーが主要なサポート/レジスタンス レベル、ブレイクアウト ゾーン、エントリ ポイントを識別するのに役立ちます。 インジケーターは、長方形と矢印の形でパターンを視覚
これはほぼ間違いなく、MetaTraderプラットフォームで見つけることができる最も完全な調和価格形成自動認識インジケーターです。 19種類のパターンを検出し、フィボナッチプロジェクションをあなたと同じように真剣に受け止め、潜在的逆転ゾーン(PRZ)を表示し、適切なストップロスとテイクプロフィットレベルを見つけます。 [ インストールガイド | 更新ガイド | トラブルシューティング | よくある質問 | すべての製品 ] 19の異なる調和価格形成を検出します プライマリ、派生および補完フィボナッチ投影(PRZ)をプロットします 過去の価格行動を評価し、過去のすべてのパターンを表示します この指標は、独自の品質とパフォーマンスを分析します 適切なストップロスとテイクプロフィットのレベルを表示します ブレイクアウトを使用して適切な取引を通知します すべてのパターン比をグラフにプロットします 電子メール/音声/視覚アラートを実装します スコット・M・カーニーの本に着想を得て、この指標は最も純粋で急を要するトレーダーのニーズを満たすように設計されています。ただし、トレードを容易にする
Triangle Pattern Gann v3.1 - Complete Feature Documentation Core Functionality OverviewTriangle Pattern Gann v3.1 is a sophisticated MetaTrader 5 indicator that combines W.D. Gann's geometric trading principles with advanced triangle pattern recognition to deliver actionable trading signals. Primary Features1. Triangle Pattern Detection SystemAscending Triangle Recognition Function: Automatically identifies bullish continuation patterns Detection Criteria: Flat horizontal resistance line
市場ボリュームプロファイル指標 + スマートオシレーター。通貨ペア、株式、先物、暗号資産など、ほぼすべての銘柄で動作し、リアルボリュームとティックボリュームの両方に対応しています。プロファイル作成範囲は、1週間や1ヶ月などの自動設定のほか、境界線(赤と青の2本の垂直線)を動かして手動で設定することも可能です。ヒストグラム形式で表示され、特定の価格レベルにおけるヒストグラムの幅は、その価格帯で行われた取引量(約定数)を表します。 Mode level line color パラメータを使用すると、価格が反発する可能性が高い重要なボリュームレベルを自動表示できます。また、 Maximum color パラメータは、指定した範囲全体で最も取引が集中した最大ボリュームレベルを個別に表示します。 スマートオシレーターは買われすぎ・売られすぎのゾーンを表示します。複数のインジケーターからの情報を分析し、処理されたデータに基づいて、買われすぎと売られすぎのゾーンを対応する色で塗りつぶします。 Volume every day では、 Range period パラメータでプロファイル作成の時間間隔を
KT Pin Bar MT5
KEENBASE SOFTWARE SOLUTIONS
KT Pin Bar identifies the pin bar formation which is a type of price action pattern which depicts a sign of reversal or rejection of the trend. When combined with support and resistance, BRN and other significant levels, Pin Bar pattern proved to be a very strong sign of reversal. Basically, a pin bar is characterized by a small body relative to the bar length which is closed either in upper or lower 50% part of its length. They have very large wicks and small candle body. A pin bar candlestic
Harmonic Pattern Structure Harmonic Pattern Structure is a professional MetaTrader 5 indicator that automatically detects classic harmonic patterns using strict Fibonacci ratio validation and XABCD price structure. Designed for traders who value precision, clean visuals, and structured analysis, the indicator highlights potential reversal zones based on price geometry, supporting consistent and objective decision-making. SUPPORTED HARMONIC PATTERNS Gartley (222) Butterfly Bat Crab Shark Cy
Monster Harmonics Indicator is a harmonic pattern indicator. It recognizes Gartley, Bat, Crab, Butterfly, Cypher, White Swan, Black Swan, Shark and AB=CD patterns. Projected patterns that are not yet completed are recognized, too. Monster even shows the PRZ (Potential Reversal Zone). Users can add their own user defined patterns to Monster. Besides the current pattern, Monster also shows all patterns in the symbols history. Monster will provide alerts for developing patterns. Introduced by H.M.
Noize Absorption Index - is the manual trading system that measures the difference of pressure between bears forces and bulls forces. Green line - is a noize free index that showing curent situation. Zero value of index shows totally choppy/flat market.Values above zero level shows how powerfull bullish wave is and values below zero measures bearish forces.Up arrow appears on bearish market when it's ready to reverse, dn arrow appears on weak bullish market, as a result of reverse expectation.
The new update makes this indicator a complete tool for studying, analyzing and operating probabilistic patterns. It includes: On-chart Multi-asset percentage monitor. Configurable martingales. Twenty-one pre-configured patterns, including Mhi patterns and C3. An advanced pattern editor to store up to 5 custom patterns. Backtest mode to test results with loss reports. Trend filter. Hit operational filter. Martingale Cycles option. Various types of strategies and alerts. Confluence between patter
Nova AC Trader is a modern automation of the Accelerator Oscillator (AC) — a Bill Williams momentum tool designed to detect shifts in market acceleration before trends fully form. This EA transforms the indicator’s early-warning nature into a structured trading system that reacts only when momentum changes are clear and consistent. Instead of waiting for the trend to be obvious, Nova AC Trader identifies when market acceleration starts to turn — offering opportunities at the earliest stage of mo
The "MR Volume Profile Rectangles 5" indicator is a charting tool that displays trading volume at different price levels rather than time intervals. A key concept in volume profile is the point of control (POC) —the price level with the highest volume traded during the session or time range. While tools like VWAP or OBV provide volume trends, the "MR Volume Profile Rectangles 5" indicator offers granular detail about where the most market activity occurs at specific price levels. This makes it a
ProEngulfingの無料バージョンは、1日あたり1つのシグナル制限と少ない機能を備えたQualifiedEngulfingです。 mql5コミュニティのKoala Trading Solutionチャンネルに参加して、Koala製品に関する最新情報を確認してください。参加リンクはこちら: https ://www .mql5 .com /en /channels /koalatradingsolution この製品のMT4バージョンは、以下のリンクからダウンロード可能です: https ://www .mql5 .com /en /market /product /52023 ProEngulfing – MT4向けのプロフェッショナルなエンガルフパターンインジケーターの紹介 ProEngulfingは、精密なエンガルフパターンを識別し、強調表示するために設計された最先端のインジケーターで、信頼性の高いシグナルを提供します。MetaTrader 4向けに開発され、取引の意思決定に役立ちます。 ProEngulfingの仕組み: ProEngulfingは、高度なアルゴリズムを使
DYJ BoS インジケーターは、次のような市場構造の変化の主な要素を自動的に識別してマークします。 構造のブレイクアウト (BoS): 価格が大きく変動し、構造の前のポイントを突破したときに発生します。 彼は上昇トレンドと下降トレンドの可能性のあるライン(UP と DN、つまり連続した新高値と新安値)をマークし、価格がこれらのラインを突破すると、赤(弱気)と緑(強気)の矢印でマークします。 BoS は通常、価格が以前の価格変動によって確立されたスイング安値または高値を決定的に突破したときに発生します。価格がスイング高値を上回ったりスイング安値を下回ったりすると、単に以前に形成された市場構造から抜け出すだけなので、「ブレイクアウト」構造と呼ばれます。これは多くの場合、市場センチメントとトレンドの方向の変化を示し、既存のトレンドの継続または新しいトレンドの始まりを示唆します。 ポジションのクローズの精度を高めるために、通常はストップロスとテイクプロフィットを設定しないことが推奨されます。最終ポジションは通常、同じ方向の次のブレイクスルー ポイント、または反対方向のブレイクスルー
KT Double Top Bottom MT5
KEENBASE SOFTWARE SOLUTIONS
1 (1)
The double top bottom pattern is arguably one of the technical analysis's most popular chart patterns. These patterns are used to capitalize on recurring patterns and identify trend reversal patterns, thereby creating well-placed entry and exit levels. The KT Double Top Bottom is based on these patterns and fine-tunes the trade signal development process for traders. Features It's based on one of the most reliable trading patterns and brings some fine-tuning and automation to the process. Also
Range Directional Force Indicator – Designed for You to Optimize! The Range Directional Force Indicator is a cutting-edge tool designed to empower traders by visualizing market dynamics and directional strength. Built to offer insights into market trends and reversals, this indicator is an invaluable asset for traders seeking precision in their strategies. However, it is important to note that this indicator is not optimized, leaving room for you to tailor it to your unique trading preferences.
回帰取引を意味する専門的かつ定量的なアプローチを実装する独自の指標。これは、価格が予測可能かつ測定可能な方法で迂回して平均に戻るという事実を利用しており、非定量的な取引戦略を大幅に上回る明確な出入りルールを可能にします。 [ Installation Guide | Update Guide | Troubleshooting | FAQ | All Products ] 明確な取引シグナル 驚くほど簡単に取引できます カスタマイズ可能な色とサイズ パフォーマンス統計を実装します ほとんどの取引戦略を上回ります 適切なSLおよびTPレベルを表示します 電子メール/音声/視覚アラートを実装します 使い方 インディケータは、より高い時間枠からの完全にカスタマイズ可能な移動平均の周りの標準偏差を測定し、トレンドフォローアプローチを使用して正確に取引を見つけます。取引は、現在のチャートの価格アクションに飛び込むことによって見つけられ、価格が選択したより高い時間枠から計算された平均価格帯に戻ったときに閉じられます。それがコード化される方法のために、指標は高ボラティリティと強いトレンドの市場か
Supply and Demand Zones Indicator for MT5 Professional institutional-grade Supply and Demand zone detection with intelligent alerts WHAT IS IT? Supply and Demand Zones is a powerful MT5 indicator that automatically identifies high-probability institutional supply and demand zones on any chart. this professional indicator brings advanced zone detection to MetaTrader 5 with enhanced features. Unlike traditional support and resistance levels, this indicator detects actual institutional footprint
**   All Symbols   x   All Timeframes   scan just by pressing scanner button ** Discount: The price is $50$, But now it is just $39, Limited time offer is active. *** Contact me  to send you instruction and add you in "Trend Reversal group" for sharing or seeing experiences with other users. Introduction: Trendlines are the most famous technical analysis in trading . Trendlines continually form on the charts of markets across all the different timeframes providing huge opportunities for traders
Price Magnet — Price Density and Attraction Levels Indicator Price Magnet is a professional analytical tool designed to identify key support and resistance levels based on statistical Price Density. The indicator analyzes a specified historical period and detects price levels where the market spent the most time. These zones act as “magnets,” attracting price action or forming a structural base for potential reversals. Unlike traditional Volume Profile tools, Price Magnet focuses on price-time d
サポート線と抵抗線のプロットにうんざりしていませんか? サポートレジスタンス は、非常に興味深いひねりを加えてチャート内のサポートとレジスタンスラインを自動検出およびプロットするマルチタイムフレームインジケーターです。価格レベルは時間とともにテストされ、その重要性が高まるにつれて、ラインは太くなり、暗くなります。 [ インストールガイド | 更新ガイド | トラブルシューティング | よくある質問 | すべての製品 ] 一晩でテクニカル分析を強化 チャートを閲覧せずに重要な価格レベルを検出 一目ですべての価格レベルの相対的な強さを認識する すべての取引で最大30時間のプロットラインを節約 インジケーターは、すべての価格レベルの年齢を表示します インジケーターは再描画されていません 過去および現在の価格レベルは近接によって崩壊し、現在の市場行動に合わせて調整されます。動作は、必ずしもピークではない場所に線が引かれます。 価格レベルは、時間とともに拒否されるにつれて、より暗く、より広くなります ノイズを避けるために、重要でない価格レベルは定期的にクリアされます カスタマイズ可能な時間枠の
プレミアムレベルは、正しい予測の精度が80%を超える独自の指標です。 この指標は、最高のトレーディングスペシャリストによって2か月以上テストされています。 あなたが他のどこにも見つけられない作者の指標! スクリーンショットから、このツールの正確さを自分で確認できます。 1は、1キャンドルの有効期限を持つバイナリーオプションの取引に最適です。 2はすべての通貨ペア、株式、商品、暗号通貨で機能します 手順: 赤い矢印が表示されたらすぐにダウントレードを開き、青い矢印が表示されたら閉じます。青い矢印の後に開くこともできます。 試してテストしてください!推奨設定はデフォルトです! 日足チャートで最高の精度を示します! インディケータは、2600 Pipsの収益性に対して、約10Pipsという非常に小さなマージンを使用します。
ADVANCED FUNCTIONALITIES: Trend Score (0-100) with visual bar Intelligent signals with adjustable strength (1-10) Risk management with automatic TP/SL Audible and visual alerts Price zones with smooth filling Multi-indicator analysis (RSI, ATR, BB, EMAs) DESIGN FEATURES Modern Visual: Smooth and well-spaced lines (EMA with 2-3px width) Vibrant and professional colors (Sky Blue, Orange, Gold) Modern arrows (code 233/234) for buy/sell signals Configurable dark/light theme Adjustable transparency f
Cumulative delta indicator As most traders believe, the price moves under the pressure of market buying or selling. When someone redeems an offer standing in the cup, the deal is a "buy". If someone pours into the bid standing in the cup - the deal goes with the direction of "sale". The delta is the difference between purchases and sales. A cumulative delta - the difference between the cumulative sum of purchases and sales for a certain period of time. It allows you to see who is currently contr
Max Min Delta Indicator - Market Volume Imbalance Analysis Gain Deeper Insights into Market Volume Imbalance with Delta Analysis What is the Max Min Delta Indicator? The Max Min Delta Indicator is a powerful market volume analysis tool that visually represents maximum and minimum delta values using a histogram. It helps traders identify market strength, weakness, absorption, and aggressive buying/selling activity with precision. Key Features Histogram Visualization: Displays Max Delta (Green) an
Equinox Gold
Dmitriq Evgenoeviz Ko
Equinox Gold is a high-tech trading expert advisor (EA) specifically designed for the gold market ( XAUUSD ). The system is based on a unique Market Equilibrium algorithm that identifies areas of imbalance between supply and demand during extreme volatility. Unlike most robots that use dangerous sit-and-wait methods, Equinox Gold relies on mathematical momentum confirmation and strict risk control for every trade. MAIN ADVANTAGES VRP Filter (Volatility Range Filter): The robot automatically ada
WAPV Weis Wave Chart Forex
Eduardo Da Costa Custodio Santos
The Weis Wave Chart Forex for MT5 is a Price and Volume indicator. The Price and Volume reading was widely disseminated through Richard Demille Wyckoff based on the three laws created by him: Supply and Demand, Cause and Effect and Effort vs. Result. In 1900 R.Wyckoff already used the wave chart in his analyses. Many years later, around 1990, David Weis Automated R. Wyckoff's wave chart and today we bring you the evolution of David Weis' wave chart. It shows the amount of Volume and the amount o
Indicator Name: Fibaction – price action candle Detector Description: Fibo Signal Boxes is a powerful Smart Money Concept (SMC)-inspired indicator that auto-detects price action candles. bullish hammers and shooting stars, then draws precise Fibonacci entry zones and multiple take-profit levels directly on the chart. as for the SL personally i use 40 pips rules  Key Features: Detects bullish hammer and shooting star reversal candles. Automatically draws Fibonacci entry and TP boxes. as
Was: $249  Now: $99   Market Profile defines a number of day types that can help the trader to determine market behaviour. A key feature is the Value Area, representing the range of price action where 70% of trading took place. Understanding the Value Area can give traders valuable insight into market direction and establish the higher odds trade. It is an excellent addition to any system you may be using. Inspired by Jim Dalton’s book “Mind Over Markets”, this indicator is designed to suit the
URガンマ (機械学習システムで見られる同様の計算を利用) UR Gamma は、従来の WaveTrend インジケーターを新しく改善したものを提供する最先端の財務分析ツールです。 高度なデジタル信号処理技術を組み込むことにより、UR Gamma は、従来の WaveTrend アルゴリズムの制限の一部に対処し、価格行動の傾向を特定および測定するためのより正確で堅牢で動的なアプローチを提供します。 UR ガンマを使用する利点: ミニマルなセットアップ すべてのデータはバックグラウンドで計算されており、ユーザー向けの出力は 1 つだけで、明確かつ適切です。 疲労を示唆する背景レベル あらゆる種類のアセットに調整されます。 ツールの最新情報を入手できる特別な電報チャットがあり、何か不足していると感じた場合はリクエストを送信することもできます! なぜURガンマ? 目標は、0 を中間点として、-1 と 1 の間で確率分布を振動させることです。 これを実現するために、アクティベーション関数と呼ばれる機械学習の手法を使用してデータを変換します。 そのような関数の 1 つは双曲線正接
This Indicator enhances the default Relative Strength Index (RSI) by introducing several improvements. First, it visually highlights overbought and oversold regions by changing the RSI color from white to red. Second, it includes additional reference lines at 20, 40, 50, 60, and 80, providing a clearer framework for assessing RSI values. The most notable feature is the use of the middle 50-line to indicate the current market cycle. The color of the 50-line dynamically reflects the cycle: green f
このプロダクトを購入した人は以下も購入しています
このインジケーターを購入された方には、以下の特典を 無料 で提供しています: 各トレードを自動で管理し、ストップロスとテイクプロフィットを設定し、戦略ルールに基づいてポジションを決済する補助ツール 「Bomber Utility」 様々な銘柄に合わせたインジケーターの設定ファイル(セットファイル) 「最小リスク」、「バランスリスク」、「待機戦略」 の3つのモードで使用できる Bomber Utility 用の設定ファイル このトレーディング戦略をすぐに導入・設定・開始できる ステップバイステップのビデオマニュアル ご注意: 上記の特典を受け取るには、MQL5のプライベートメッセージシステムを通じて販売者にご連絡ください。 オリジナルのカスタムインジケーター 「Divergence Bomber(ダイバージェンス・ボンバー)」 をご紹介します。これは、MACDのダイバージェンス(乖離)戦略に基づいた 「オールインワン」型のトレーディングシステム です。 このテクニカルインジケーターの主な目的は、価格とMACDインジケーターの間に発生するダイバージェンスを検出 し、将来の価格の動きを示す
ARICoin is a powerful trading companion designed to generate high-probability entry signals with dynamic TP/SL/DP levels based on volatility. Built-in performance tracking shows win/loss stats, PP1/PP2 hits, and success rates all updated live. Key Features: Buy/Sell signals with adaptive volatility bands Real-time TP/SL/DP levels based on ATR Built-in MA Filter with optional ATR/StdDev volatility Performance stats panel (Success, Profit/Loss, PP1/PP2) Alerts via popup, sound, push, or email Cust
優れたテクニカルインジケーター「Grabber」をご紹介します。これは、すぐに使える「オールインワン」トレーディング戦略として機能します。 ひとつのコードに、市場のテクニカル分析ツール、取引シグナル(矢印)、アラート機能、プッシュ通知が強力に統合されています。 このインジケーターを購入された方には、以下の特典を無料で提供します: Grabberユーティリティ:オープンポジションを自動で管理するツール ステップバイステップのビデオマニュアル:インジケーターのインストール、設定、取引方法を解説 カスタムセットファイル:インジケーターをすばやく自動設定し、最大限の成果を出すための設定ファイル 他の戦略はもう忘れてください!Grabberだけが、あなたを新たなトレードの高みへと導いてくれるのです。 Grabber戦略の主な特徴: 推奨タイムフレーム:M5〜H4 対応通貨ペア・資産:どれでも使用可能ですが、私が実際に検証した以下を推奨します(GBPUSD、GBPCAD、GBPCHF、AUDCAD、AUDUSD、AUDSGD、AUDCHF、NZDUSD、NZDCAD、EURCAD、EURUSD、E
トレンド スクリーナー インジケーターでトレンド取引の力を解き放ちます。ファジー ロジックと複数通貨システムを活用した究極のトレンド取引ソリューションです。 ファジー ロジックを活用した革新的なトレンド インジケーターである Trend Screener を使用して、トレンド取引を向上させます。 これは、13 を超えるプレミアム ツールと機能、および 3 つの取引戦略を組み合わせた強力なトレンド追跡インジケーターであり、Metatrader をトレンド アナライザーにする多用途の選択肢となります。 期間限定オファー : トレンド スクリーナー インジケーターは、わずか 100 ドルで生涯ご利用いただけます。 (元の価格 50$ ) (オファー延長) Trend Screener の 100% 非再描画精度の揺るぎない精度を体験して、取引の決定が過去の価格変動の影響を受けないようにしてください。 マルチタイムフレームおよびマルチ通貨機能の多用途性を解放し、比類のない自信を持って外国為替、商品、暗号通貨、インデックスの世界を取引できるようにします。 Trend Screener の包括的な
AriX
Temirlan Kdyrkhan
1 (4)
AriX Indicator for MT5 A powerful trend-following and signal-evaluation tool AriX is a custom MT5 indicator that combines Moving Averages and ATR-based risk/reward logic to generate clear buy/sell signals. It visualizes dynamic SL/TP levels, evaluates past trade outcomes, and displays win/loss statistics in a clean on-chart panel. Key features include: Buy/Sell signals based on MA crossovers ATR-based SL/TP1/TP2/TP3 levels with visual lines and labels Signal outcome tracking with real-time stat
Quantum TrendPulse を ご紹介します。これは、   SuperTrend   、   RSI   、および Stochastic のパワーを 1 つの包括的なインジケーターに組み合わせて、取引の可能性を最大限に引き出す究極の取引ツールです。精度と効率を求めるトレーダー向けに設計されたこのインジケーターは、市場のトレンド、勢いの変化、最適なエントリー ポイントとエグジット ポイントを自信を持って特定するのに役立ちます。 主な特徴: SuperTrend 統合: 現在の市場動向に簡単に追従し、収益性の波に乗ることができます。 RSI精度: 買われすぎと売られすぎのレベルを検出し、市場の反転のタイミングに最適で、SuperTrendのフィルターとして使用されます。 確率的精度: 確率的振動を活用して、変動の激しい市場で隠れたチャンスを見つけます。SuperTrend のフィルターとして使用されます。 マルチタイムフレーム分析:   M5 から H1 または H4 まで、さまざまなタイムフレームで市場を常に把握します。 カスタマイズ可能なアラート: カスタム取引条件が満たされ
ご紹介     Quantum Breakout PRO は 、ブレイクアウト ゾーンの取引方法を変革する画期的な MQL5 インジケーターです。 13年以上の取引経験を持つ経験豊富なトレーダーのチームによって開発されました。     クォンタム ブレイクアウト プロ   は、革新的でダイナミックなブレイクアウト ゾーン戦略により、あなたのトレーディングの旅を新たな高みに押し上げるように設計されています。 クォンタム ブレイクアウト インジケーターは、5 つの利益ターゲット ゾーンを備えたブレイクアウト ゾーン上のシグナル矢印と、ブレイクアウト ボックスに基づいたストップロスの提案を提供します。 初心者トレーダーにもプロのトレーダーにも適しています。 量子EAチャネル:       ここをクリック 重要!購入後、インストールマニュアルを受け取るためにプライベートメッセージを送ってください。 推奨事項: 時間枠: M15 通貨ペア: GBPJPY、EURJPY、USDJPY、NZDUSD、XAUUSD アカウントの種類: ECN、Raw、またはスプレッドが非常に低い R
Order Block Pro (MQL5) – バージョン 1.0 作成者: KOUAME N'DA LEMISSA プラットフォーム: MetaTrader 5 説明: Order Block Pro は、チャート上の**強気および弱気のオーダーブロック(Order Blocks)**を自動で検出する高度なインジケーターです。小さな保ち合いローソク足と、その後の強いインパルスローソク足を分析することで、価格が加速する可能性のある重要なゾーンを特定します。 トレーダーに最適: 正確なエントリーとエグジットポイントを特定したい方。 動的なサポートおよびレジスタンスゾーンを把握したい方。 リスク管理と取引戦略を向上させたい方。 主な機能: 強気OB検出: 保ち合いローソク足の後、強い上昇が発生した場合、緑色の矢印で表示。 弱気OB検出: 保ち合いローソク足の後、強い下落が発生した場合、赤色の矢印で表示。 完全にカスタマイズ可能: 保ち合いローソク足の最大実体比率 ( BodyMaxRatio ) 次のローソク足の最小比率で動きを確認 ( NextCandleMinPct ) チャー
これはMT5のインジケーターで、再描画なしで取引に参入するための正確なシグナルを提供します。 外国為替、暗号通貨、金属、株式、インデックスなど、あらゆる金融資産に適用できます。かなり正確な見積もりを提供し、取引を開始して終了するのに最適な時期を教えてくれます。1つのシグナルを処理しただけでインジケーターの元が取れた例の 動画 (6:22)をご覧ください。Entry PointsPro インジケーターの助けを借りたほとんどのトレーダーの最初の1週間の結果が改善しています。 Telegramグループ に登録してください。Entry Points Proインジケーターのメリットは次の通りです。 再描画のないエントリーシグナル 再描画されるインジケーターでは一度表示されたシグナルが削除されて大きな金銭的損失につながることがありますが、これと異なり、表示されて確認されたシグナルは消えることがありません。 エラーなしの取引開始 インジケーターアルゴリズムによって取引を開始する(資産を売買する)理想的な瞬間を見つけることができます。それを使用するすべてのトレーダーの成功率が向上します。 あら
ARIPoint is a powerful trading companion designed to generate high-probability entry signals with dynamic TP/SL/DP levels based on volatility. Built-in performance tracking shows win/loss stats, PP1/PP2 hits, and success rates all updated live. Key Features: Buy/Sell signals with adaptive volatility bands Real-time TP/SL/DP levels based on ATR Built-in MA Filter with optional ATR/StdDev volatility Performance stats panel (Success, Profit/Loss, PP1/PP2) Alerts via popup, sound, push, or email Cu
Market Flow Pro Market Flow Pro is an intelligent trading advisor for the MetaTrader 5 platform, designed for automatic trading on financial markets using algorithmic analysis and strict risk management. -Key features: - Fully automatic trading 24/5 - Adaptive trend and momentum entry algorithm -  Built-in risk management - Flexible lot settings (fixed/auto-calculation) - Support for major currency pairs and indices - Optimised for operation on various timeframes  How it works Market
Azimuth Pro
Ottaviano De Cicco
5 (4)
発売プロモーション Azimuth Proは先着100名様限定で 299ドル でご提供します。最終価格は 499ドル となります。 リテールとインスティテューショナルのエントリーの違いはインジケーターではなく、ロケーションにあります。 多くのトレーダーは、モメンタムを追いかけたり、遅行シグナルに反応して、任意の価格レベルでエントリーします。機関投資家は、需給が実際にシフトする構造的なレベルに価格が到達するのを待ちます。 Azimuth Proはこれらのレベルを自動的にマッピングします:スイングアンカーVWAP、マルチタイムフレーム構造ライン、高確率ロケーションにのみ出現するABCパターン。 Azimuth Proは、構造分析とインテリジェントな自動化の両方を求めるプロフェッショナルトレーダー向けに構築されています。 Azimuthが外科的精度で市場構造をマッピングする一方、Azimuth Proはインテリジェンスレイヤーを追加します:トレーディングスタイルの自動検出、スマート設定された移動平均線、20年のデータでバックテストされた最適化パラメータ。その結果、お使いの銘柄と
Ultimate SMC Indicator
Hicham Mahmoud Almoustafa
1 (1)
Ultimate SMC PRO – Smart Money Concepts Indicator (Order Blocks, FVG, Liquidity, BOS) for MetaTrader 5   After purchasing the product, you will receive an additional copy for free. Just contact me after your purchase. Ultimate SMC PRO is a professional trading indicator designed to visualize Smart Money Concepts directly on the chart. The indicator combines several institutional trading tools in one system to help traders identify potential high-probability trading zones. ULTIMATE SMC INDICATO
RelicusRoad Pro: 定量的市場オペレーティングシステム 【期間限定】無制限アクセス 70% OFF - 2,000人超のトレーダーと共に なぜ多くのトレーダーは「完璧な」インジケーターを使っても失敗するのでしょうか? それは、文脈を無視して 単一の概念 だけでトレードしているからです。文脈のないシグナルは単なるギャンブルです。勝ち続けるには、 根拠の重なり(コンフルエンス) が必要です。 RelicusRoad Proは単なる矢印インジケーターではありません。完全な 定量的市場エコシステム です。独自のボラティリティモデリングを用いて、価格が推移する「適正価値の道(Fair Value Road)」をマッピングし、ノイズと真の構造的ブレイクを判別します。 推測はやめましょう。機関投資家レベルの「ロード・ロジック」でトレードを。 コアエンジン:「Road」アルゴリズム システムの中心となる Road Algo は、市場環境にリアルタイムで適応するダイナミックなボラティリティチャネルです。 安全ライン(平衡点) と、価格が数学的に反転しやすい 拡張レベル を投影します。 Si
Algo Pumping
Ihor Otkydach
4.76 (21)
PUMPING STATION – あなた専用の「オールインワン」戦略 PUMPING STATIONは、あなたのトレードをより楽しく、そして効果的に変えてくれる革新的なFXインジケーターです。ただの補助ツールではなく、強力なアルゴリズムを備えた本格的なトレーディングシステムで、より安定したトレードのスタートをサポートします。 この商品をご購入いただくと、以下の特典を無料でお付けします: 専用セットファイル:自動設定による最大パフォーマンスを実現。 ステップバイステップのビデオマニュアル:PUMPING STATION戦略の使い方を学べます。 Pumping Utility:PUMPING STATION専用の半自動トレードボットで、より快適かつシンプルな運用を可能にします。 ※ご購入後すぐにご連絡ください。追加リソースへのアクセスを提供いたします。 PUMPING STATIONの仕組み: トレンド管理:市場のトレンド方向を即座に判断。トレンドはあなたの最高の味方です。 エントリーサイン:チャート上の矢印で、取引のタイミングと方向を明確に示します。 明確な目標設定:インジケーターが自
Bill Williams Advanced is designed for automatic chart analysis using Bill Williams' "Profitunity" system. The indicator analyzes four timeframes at once. Manual (Be sure to read before purchasing) Advantages 1. Analyzes the chart using Bill Williams' "Profitunity" system. Signals are displayed in a table in the corner of the screen and on the price chart. 2. Finds all known AO and AC signals, as well as zone signals. Equipped with a trend filter based on the Alligator. 3. Finds "Divergence Bar
まず第一に、この取引ツールはノンリペイント、ノンリドロー、ノンラグの指標であり、プロの取引に理想的ですことを強調する価値があります。 オンラインコース、ユーザーマニュアル、デモ。 スマートプライスアクションコンセプトインジケーターは、新米から経験豊富なトレーダーまで、非常 に強力なツールです。Inner Circle Trader AnalysisやSmart Money Concepts Trading Strategiesなど、20以上の有用な指標を1つに組み合わせています。このインジケーターはスマートマネーコンセプトに焦点を当て、大手機関の取引方法を提供し、彼らの動きを予測するのに役立ちます。 特に、流動性分析に優れており、機関がどのように取引しているかを理解しやすくしています。市場のトレンドを予測し、価格の動きを慎重に分析するのに優れています。機関の戦略とトレードを合わせることで、市場の動向についてより正確な予測ができます。このインジケーターは多目的であり、市場構造を分析し、重要な注文ブロックを特定し、さまざまなパターンを認識するのに優れています。 このインジケーター
Get the user guide here  https://g-labs.software/guides/BTMM_State_Engine_Welcome_Pack.html BTMM State Engine Pro — the   all-in-one Banks   & Institutions Market Maker indicator for Meta Trader 5. Built for   BTMM traders who follow the Asian   session breakout methodology with Kill Zone timing , level stacking, peak formation detection , and multi-pair scanning — all   from a single chart. Combines   a full BTMM State Engine   with a built-in multi-pair Scanner dashboard, eliminating the need
Berma Bands
Muhammad Elbermawi
5 (8)
Berma Bands (BBs) インジケーターは、市場のトレンドを特定して活用したいトレーダーにとって貴重なツールです。価格と BBs の関係を分析することで、トレーダーは市場がトレンド段階にあるか、レンジ段階にあるかを判断できます。 詳細については、[ Berma Home Blog ] をご覧ください。 バーマ バンドは、上部バーマ バンド、中部バーマ バンド、下部バーマ バンドの 3 つの異なる線で構成されています。これらの線は価格の周りにプロットされ、全体的な傾向に対する価格の動きを視覚的に表します。これらのバンド間の距離から、ボラティリティや潜在的な傾向の反転についての洞察を得ることができます。 バーマ バンドの線がそれぞれ離れると、市場が横ばいまたはレンジ相場の期間に入っていることを示すことがよくあります。これは、明確な方向性の偏りがないことを示しています。トレーダーは、これらの期間中にトレンドを特定するのが難しいと感じる可能性があり、より明確なトレンドが出現するまで待つ場合があります。 バーマ バンドの線が 1 本の線に収束すると、強いトレンド環境の兆候となること
CGE Trading Suite
Carl Gustav Johan Ekstrom
5 (1)
CGE Trading Suite delivers the analytical edge typically reserved for professional trading desks. The platform integrates a full suite of analytical tools into one seamless workflow: dynamic grid mapping, liquidity behavior analysis, ECM, trend lines, MIDAS, trade cycles, and directional channel projections. Together, these provide a unified view of market structure and momentum. Directional clarity is further enhanced by the capital flow index, which measures currency basket strength to identif
Pointer Trend Switch — precision trend reversal indicator Pointer Trend Switch is a high-precision arrow indicator designed to detect key moments of trend reversal based on asymmetric price behavior within a selected range of bars. It identifies localized price impulses by analyzing how far price deviates from the opening level, helping traders find accurate entry points before a trend visibly shifts. This indicator is ideal for scalping, intraday strategies, and swing trading, and performs equa
「 Dynamic Scalper System MT5 」インジケーターは、トレンド波の中でスキャルピング取引を行う手法のために設計されています。 主要通貨ペアと金でテスト済みで、他の取引商品との互換性があります。 トレンドに沿った短期的なポジションオープンのシグナルを提供し、追加の価格変動サポートも提供します。 インジケーターの原理 大きな矢印はトレンドの方向を決定します。 トレンド波の中では、小さな矢印の形でスキャルピングシグナルを生成するアルゴリズムが機能します。 赤い矢印は強気方向、青い矢印は弱気方向です。 トレンドの方向には敏感な価格変動ラインが描かれ、小さな矢印のシグナルと連動します。 シグナルは次のように機能します。適切なタイミングでラインが現れるとエントリーシグナルが形成され、ラインが開いている間はポジションが保持され、完了すると取引が終了します。 推奨される動作時間枠はM1~H4です。 矢印は現在のローソク足に形成され、次のローソク足が開いている場合は、前のローソク足の矢印は再描画されません。 入力パラメータ Trend Wave Period - トレ
Overview TriParity AfterShock PRO Scanner は、MetaTrader 5 用の裁量判断支援ダッシュボード型インジケーターです。本説明において、トライアッドとは 3 つの通貨ペアまたは銘柄の関係を意味します。Scanner は複数のトライアッドと時間足を 1 つのパネルで確認し、トレーダーが監視対象をより構造的に整理できるよう支援します。目的は、チャートの過密状態を減らし、候補を横並びで比較し、より詳しく確認すべき条件を目立たせることです。 本製品は三角裁定を実行するものではありません。真の三角裁定には、3 レッグのほぼ同時執行、非常に低いレイテンシー、そして非常に小さい取引コストが必要です。Scanner は、パリティ調整後にも一時的に残り得る歪み状態を裁量的にレビューするために設計されています。 Functions Scanner は、選択されたトライアッドを複数の時間足で分析し、NOWCAST によって現在の状態を表示します。NOWCAST はセットアップを A、B、C、または NG として評価します。この文脈で NG は、現在の状態が適して
ARIScalp is a powerful trading companion designed to generate high-probability entry signals with dynamic TP/SL/DP levels based on volatility. Built-in performance tracking shows win/loss stats, PP1/PP2 hits, and success rates all updated live. Key Features: Buy/Sell signals with adaptive volatility bands Real-time TP/SL/DP levels based on ATR Built-in MA Filter with optional ATR/StdDev volatility Performance stats panel (Success, Profit/Loss, PP1/PP2) Alerts via popup, sound, push, or email Cus
Jean Meeus天文アルゴリズムを使用してトレーディングチャート上に月相を表示するテクニカルインディケーターです。プロの天文台と同等の科学的精度で月の周期を表す連続曲線を提供します。MT5のあらゆるシンボルと時間枠に対応し、外国為替、商品、指数、株式取引で使用できます。現在の月相、月の照明パーセンテージ、テクニカル分析用の参照レベルを表示する情報パネルを含みます。色とスタイル設定は完全にカスタマイズ可能です。精密な天文計算に基づくリアルタイム月相データを提供し、トレーダーが客観的に月の情報を市場分析に組み込むことを可能にします。科学的精度と金融市場分析を組み合わせたプロフェッショナル向けツールです。
Trend deviation scalper - is the manual system to scalp choppy market places. Indicator defines bull/bear trend and it's force. Inside exact trend system also defines "weak" places, when trend is ready to reverse. So as a rule, system plots a sell arrow when bull trend becomes weak and possibly reverses to bear trend. For buy arrow is opposite : arrow is plotted on bear weak trend. Such arrangement allows you to get a favorable price and stand up market noise. Loss arrows are closing by common p
Matreshka
Dimitr Trifonov
5 (2)
Matreshka self-testing and self-optimizing indicator: 1. Is an interpretation of the Elliott Wave Analysis Theory. 2. Based on the principle of the indicator type ZigZag, and the waves are based on the principle of interpretation of the theory of DeMark. 3. Filters waves in length and height. 4. Draws up to six levels of ZigZag at the same time, tracking waves of different orders. 5. Marks Pulsed and Recoil Waves. 6. Draws arrows to open positions 7. Draws three channels. 8. Notes support and re
Native Channels
BeeXXI Corporation
5 (1)
This indicator recognizes all support and resistance levels. A number of unique high-performance techniques have been applied, which made the existence of this indicator possible. All formed channels are naturally visible: horizontal linear linear parabolic cubic (Polynomial 3 degrees - Wave) This is due to a bundle of approximating channels. The formed channels form "standing waves" in a hierarchical sequence. Thus, all support and resistance levels are visible. All parameter management is i
The Institutional Secret Method  represents a paradigm shift in market analysis, moving away from lagging indicators and into the realm of Topological Finance . It is engineered to decode the hidden geometry of price movement by calculating the most efficient path—the Geodesic —between current price action and institutional liquidity targets. The system views the market as a physical landscape where price is naturally drawn toward massive pools of liquidity (Stops). It uses two primary calculati
Cyclic Impulse MT5 — このテクニカル指標はチャートを構築し、周期的な価格変動を識別します。これにより、反転する周期的な価格変動とエントリーシグナルを見つけることができます。 指標の仕組み 周期的な下降傾向が検出されると、ローソク足が閉じた後に青い下降バーが生成されます。このバーは現在のローソク足上でちらつく場合があり、シグナルはまだ確認されていません。青い矢印は価格チャートに複製されます。 周期的な上昇傾向が検出されると、ローソク足が閉じた後に赤い上向きバーが生成されます。このバーは現在のローソク足上でちらつく場合があり、シグナルはまだ確認されていません。オレンジ色の矢印は価格チャートに複製されます。 あらゆるチャート、時間枠、取引商品で使用できます。 複数のアラートタイプ。 価格チャートに追加の矢印を表示。 履歴データの再描画は行わず、ローソク足の終値に基づいて機能します。ローソク足が閉じても、矢印またはバーは消えません。 使いやすく、パラメータの設定も簡単で、不要な情報でチャートが乱雑になることはありません。 異なるパラメータを持つ2つのインジケーターを使用
作者のその他のプロダクト
KT Momentum Arrows MT5
KEENBASE SOFTWARE SOLUTIONS
5 (2)
KT Momentum Arrows インジケーターは、一方向への急激なボラティリティとバンドの乖離に基づいて計算される、瞬間的なブレイクアウトを検出するツールです。動きの強さとタイミングを捉えることに特化しており、モメンタムトレードに最適です。 価格が上部バンドを上抜けして終値が確定したときに買いシグナルが、下部バンドを下抜けしたときに売りシグナルが発生します。 バンドの広がりとボラティリティの両方に影響を与える「係数(Magnitude Coefficient)」が入力として用いられます。通貨ペアや時間軸に応じて最適な値を選定し、分析することが推奨されます。 主な特徴 リペイントなし! モメンタムトレーダーにとって優れたエントリーツール。 勝率、平均利益、勝ち/負けなどのパフォーマンス分析機能付き。 デイトレード、スイングトレード、スキャルピングに対応。 入力パラメーター 履歴バー数:  インジケーター計算に使用するローソク足の数。 マグニチュード係数:  バンドの拡張とボラティリティ計測に使う単一の係数。 パフォーマンス分析:  利益傾向のラインを含む分析を表示/非表示に切
KT Asian Breakout
KEENBASE SOFTWARE SOLUTIONS
4 (1)
KT Asian Breakout carefully analyzes the range-bound market during the Asian session and then fires a long or short trade after doing some preassessment based on its inbuilt technical analysis module. The executed orders are closed within a day before the completion of the next day session. The inbuilt technical analysis module checks for the session range and compares it with the last 20 days price movement. If it finds any erratic price movement within the session, the orders are not executed
Use of support and resistance in systematic trading is very subjective. Every trader has their own idea and way to plotting the support and resistance levels on the chart. KT Support and Resistance indicator take out this ambiguity out of the situation and automatically draws support and resistance levels following an algorithmic approach using a unique multi-timeframe analysis. When launched on the chart, It immediately scan the most significant extreme points across all the available timefra
ACB Breakout Arrows
KEENBASE SOFTWARE SOLUTIONS
4.15 (34)
ACB Breakout Arrows インジケーターは、特別なブレイクアウトパターンを検出することで、市場における重要なエントリーシグナルを提供します。このインジケーターは、特定の方向に勢いが定まりつつある状況を常にスキャンし、大きな値動きの直前に正確なシグナルを表示します。  複数通貨ペア・複数時間軸スキャナーはこちら - ACB Breakout Arrows MT4 用スキャナー 主な特徴 ストップロスとテイクプロフィットの水準を自動で表示します。 すべての時間足に対応したMTFスキャナーダッシュボード付き。 デイトレーダー、スイングトレーダー、スキャルパーに適しています。 シグナルの精度を高めるために最適化されたアルゴリズムを採用。 損益分岐点やスキャルピングの目標として利用できる特別な「クイックプロフィットライン」を搭載。 勝敗、成功率、平均利益などのパフォーマンス分析機能を搭載。 リペイントなし(シグナルは表示後に変更されません)。 トレードの確認 -  ACB Trade Filter インジケーター を併用し、低確率の取引を除外しましょう。 強い買い: 上向き矢印
ACB Breakout Arrows MT5
KEENBASE SOFTWARE SOLUTIONS
5 (1)
ACB Breakout Arrows インジケーターは、特別なブレイクアウトパターンを検出することで、市場における重要なエントリーシグナルを提供します。このインジケーターはチャートを常に監視し、一方向に勢いが定着してきた段階で、主要な値動きの直前に精度の高いエントリーシグナルを表示します。 マルチシンボル・マルチタイムフレームスキャナーはこちらから - ACB Breakout Arrows MT5 用スキャナー 主な機能 ストップロスとテイクプロフィットの水準が自動で表示されます。 すべての時間足のブレイクアウトシグナルを監視できるMTFスキャナーダッシュボードを搭載。 デイトレーダー、スイングトレーダー、スキャルパーに最適。 シグナル精度を高めるための最適化されたアルゴリズム。 損益分岐点やスキャルピングターゲットに使える特別なライン(クイックプロフィットライン)。 勝率、平均利益などのパフォーマンス分析メトリクスを表示。 リペイントなし。 トレードの確認 - 低確率のトレードを除外するために ACB Trade Filter インジケーター を使用してください。 強い買い:
KT RSI Divergence robot は、価格と相対力指数 (RSI) オシレーターとの間に発生するレギュラーおよびヒドゥン・ダイバージェンスを取引する 100% 自動のエキスパートアドバイザーです。ダイバージェンスのシグナルは、当社が無料で提供している RSI Divergence インジケーターから取得されます。 すべてのダイバージェンスが必ずしも成功する反転につながるわけではありません。そのため、この EA は生のダイバージェンスシグナルに独自のテクニカル分析モジュールを組み合わせ、選定された一部のダイバージェンス後に発生する価格の非効率を狙います。 推奨設定 Pairs:   EURUSD、EURCAD、EURCHF、EURJPY、GBPJPY、USDCHF、USDJPY、XAUUSD Time-Frame:   1 時間足 Account Type:   すべて Leverage:    1:100 R isk:   1 取引あたり 1% 特徴 RSI ダイバージェンスシグナルを自動で取引し、人間の裁量では実装が難しい多くの改良機能を搭載しています。 ボラテ
ダイバージェンス(乖離)は、市場における価格の反転を示す重要なシグナルのひとつです。KT Stoch Divergence は、価格とストキャスティクスオシレーターの間に発生するレギュラーおよびヒドゥンダイバージェンスを視覚的に表示します。 KT Stoch Divergence の注意点 ストキャスティクスのダイバージェンスだけをエントリーシグナルにするのはリスクがあります。すべてのダイバージェンスが反転を意味するわけではありません。プライスアクションやトレンドの方向と組み合わせて使用するのがおすすめです。 特徴 価格とストキャスティクス間のレギュラーおよびヒドゥンダイバージェンスをマーク。 トレンドの反転・継続両方に対応した戦略に使用可能。 エキスパートアドバイザー(EA)への組み込みに完全対応。 非対称なダイバージェンスは除外し、精度を向上。 エントリーだけでなく、エグジットにも利用可能。 すべてのMTアラート機能に対応。 そもそもダイバージェンスとは? 一般的に、価格が高値を更新するとき、オシレーターも高値を更新すべきです。同様に、安値を更新するときは、オシレーターも安
KT CCI Divergence shows the regular and hidden divergence created between the price and CCI oscillator. Divergence is one of the vital signals that depicts the upcoming price reversal in the market. Manually spotting the divergence between price and CCI can be a hectic and ambiguous task. Limitations of KT CCI Divergence   Using the CCI divergence as a standalone entry signal can be risky. Every divergence can't be interpreted as a strong reversal signal. For better results, try to combine it w
ACB Trade Filter MT4
KEENBASE SOFTWARE SOLUTIONS
5 (1)
The ACB Trade Filter indicator provides a solution for filtering out the low probability trading setups in a trading strategy. The indicator uses a sophisticated filtration algorithm based on the market sentiment and trend. Applications Works great with our indicator " ACB Breakout Arrows ". Filter out low probability signals from any indicator. Avoid overtrading and minimize the losses. Trade in the direction of market sentiment and trend. Avoid the choppiness in the market. How to use Only L
KT Momentum Arrows
KEENBASE SOFTWARE SOLUTIONS
KT Momentum Arrows インジケーターは、一方向への急激なボラティリティとバンドの乖離に基づいて計算される、瞬間的なブレイクアウトを検出するツールです。動きの強さとタイミングを捉えることに特化しており、モメンタムトレードに最適です。 価格が上部バンドを上抜けして終値が確定したときに買いシグナルが、下部バンドを下抜けしたときに売りシグナルが発生します。 バンドの広がりとボラティリティの両方に影響を与える「係数(Magnitude Coefficient)」が入力として用いられます。通貨ペアや時間軸に応じて最適な値を選定し、分析することが推奨されます。 主な特徴 リペイントなし! モメンタムトレーダーにとって優れたエントリーツール。 勝率、平均利益、勝ち/負けなどのパフォーマンス分析機能付き。 デイトレード、スイングトレード、スキャルピングに対応。 入力パラメーター 履歴バー数:  インジケーター計算に使用するローソク足の数。 マグニチュード係数:  バンドの拡張とボラティリティ計測に使う単一の係数。 パフォーマンス分析:  利益傾向のラインを含む分析を表示/非表示に切
KT COG Advanced MT4
KEENBASE SOFTWARE SOLUTIONS
1 (1)
KT COG is an advanced implementation of the center of gravity indicator presented by John F. Ehlers in the May 2002 edition of Technical Analysis of Stocks & Commodities magazine. It's a leading indicator which can be used to identify the potential reversal points with the minimum lag. The COG oscillator catches the price swings quite effectively. MT5 version of the same indicator is available here KT COG Advanced MT5 Calculation of COG The COG indicator is consist of the two lines. The main l
KT Pin Bar
KEENBASE SOFTWARE SOLUTIONS
KT Pin Bar identifies the pin bar formation which is a type of price action pattern which depicts a sign of reversal or rejection of the trend. When combined with support and resistance, BRN and other significant levels, Pin Bar pattern proved to be a very strong sign of reversal. Basically, a pin bar is characterized by a small body relative to the bar length which is closed either in upper or lower 50% part of its length. They have very large wicks and small candle body. A pin bar candlestic
KT Trend Magic
KEENBASE SOFTWARE SOLUTIONS
KT Trend Magic shows the trend depiction on chart using the combination of market momentum and volatility. A smoothing coefficient is used to smooth out the noise from the signal.It can be used to find out the new entries or confirm the trades produced by other EA/Indicators. Usage Drag n drop MTF scanner which scans for the new signals across multiple time-frames. Find new entries in the trend direction. Improve the accuracy of other indicators when used in conjunction. Can be used as a dynami
KT Auto Fibo
KEENBASE SOFTWARE SOLUTIONS
O KT Auto Fibo desenha automaticamente os níveis de retração de Fibonacci com base na direção atual da tendência. Os pontos máximos e mínimos são selecionados automaticamente usando os valores máximos e mínimos disponíveis no gráfico. Você pode dar zoom e rolar o gráfico para ajustar os níveis de Fibonacci conforme necessário. Modos Automático:  Desenha automaticamente os níveis de Fibonacci com base na área do gráfico. Manual: Desenha os níveis de Fibonacci apenas uma vez. Depois disso, você p
KT Psar Arrows
KEENBASE SOFTWARE SOLUTIONS
KT Psar Arrowsは、標準のパラボリックSARインジケーターを使用してチャート上に矢印をプロットします。ローソク足の高値がSARにタッチしたときに上向き矢印が表示され、安値がSARにタッチしたときに下向き矢印が表示されます。シグナルはリアルタイムで生成され、バーの確定を待つ必要はありません。  特徴 パラボリックSARインジケーターを活用した取引戦略を試したいトレーダーにとって有用なツールです。  市場の転換ポイントを見つけるために使用できます。 カスタムPSAR入力が可能です。 MT4のすべてのアラート機能に対応しています。 注意事項:パラボリックSARは遅延型かつ厳密な機械的インジケーターです。すべての取引シグナルは、明確に定義されたルールでフィルタリングする必要があります。     入力パラメーター PSARステップ値:ステップ値を入力します。 PSAR最大値:最大値を入力します。 PSARドット表示:PSARドットを表示/非表示にします。PSARドットがなくても矢印は正常に機能します。 その他の入力項目は直感的に理解できます。
KT Ichimoku Trader
KEENBASE SOFTWARE SOLUTIONS
1 (1)
KT Ichimoku Trader is a fully automated expert advisor that offers five popular trading strategies based on the Ichimoku indicator. Each strategy has it's own entry and exit method without any interference to other strategies. The Ichimoku system can be applied to all major currency pairs and metals. However, we found that it performs reasonably well mainly on two pairs.   MT5 Version is available here  https://www.mql5.com/en/market/product/35043 Features Trade up to 5 famous trading strategi
KTボラティリティオシレーターは、過去と現在の市場データを数学的な計算式で分析し、その結果をオシレーター形式で表示します。成長する波と減少する波は、それぞれ資産の高ボラティリティと低ボラティリティを示しています。  簡単に言えば、ボラティリティとは、一定期間内における資産価格の変動幅を測定する指標です。ボラティリティがなければ市場の動きは少なくなり、トレーダーは価格変動から利益を得ることができません。 外国為替市場におけるボラティリティの活用 外国為替市場でボラティリティを活用することで、より効果的に取引ができ、現実的な期待値を持つことが可能になります。  高ボラティリティ トレンドベースのシステムは、高いボラティリティ環境下では大きな値動きとトレンドの持続によって非常に効果的に機能します。 高ボラティリティの時に発生するブレイクアウトは、より多くのピップスを獲得できる可能性があります。 低ボラティリティ 平均回帰型のシステムは、市場が平均に回帰する傾向があるため、低ボラティリティ環境下で特に効果を発揮します。 チャネルベースのシステムは、低ボラティリティ期間中のレンジ相場でより高
KT COG Robot
KEENBASE SOFTWARE SOLUTIONS
KT COG Robot is a fully automated Expert Advisor based on the KT COG Indicator . The COG indicator was originally presented by John F. Ehlers in the May 2002 edition of Technical Analysis of Stocks & Commodities magazine. The EA fires a long trade when COG line cross above the signal line and a short trade is fired when the COG line cross below the signal line.  Adaptive Filtration Our adaptive filtration algorithm combines the original COG formula with the major trend direction and market acce
ACB Breakout Arrows EA
KEENBASE SOFTWARE SOLUTIONS
このエキスパートアドバイザーは、弊社独自のインジケーター 「ACB Breakout Arrows」 に基づいた100%自動売買システムです。エントリーは双方向で頻繁に発生するブレイクアウトパターンに基づいており、「Signal Sensitivity」という外部パラメーターを使ってシグナルの強度を調整できます。 トレードの確認 ACB Breakout Arrows EA は、弊社のもう一つのカスタムインジケーター ACB Trade Filter を利用して、エントリーをフィルタリングする機能を備えています。 強気買い: 上向き矢印 + 緑のヒストグラム + 上昇トレンド。 強気売り: 下向き矢印 + 赤のヒストグラム + 下降トレンド。 ヒストグラムがグレーでトレンドがレンジの場合、EAはエントリーを回避します。 EA はすべてのインジケーターと依存関係をバックグラウンドで読み込みます。インジケーターはチャート上には表示されません。 主な機能 長らくご要望の多かった完全自動売買が、 ACB Breakout Arrows インジケーター を使ってついに実現しました。 AC
KT London Breakout
KEENBASE SOFTWARE SOLUTIONS
First thirty minutes are essential for a trading session. The early reaction of traders and market players sets a path for the rest of the day. KT London Breakout EA takes advantage of this phenomenon, and after analyzing the first thirty minutes of London session, it places two bidirectional pending orders. One of pending order is eventually canceled after realizing the market direction with certainty. It has been strictly tested and developed for EUR/JPY using 30-Min Time Frame. You can expe
Use of support and resistance in systematic trading is very subjective. Every trader has their own idea and way to plotting the support and resistance levels on the chart. KT Support and Resistance indicator take out this ambiguity out of the situation and automatically draws support and resistance levels following an algorithmic approach using a unique multi-timeframe analysis. When launched on the chart, It immediately scan the most significant extreme points across all the available timefra
もしあなたがFX取引をしているなら、通貨の強さと通貨ペアの相関関係に関する詳細な情報を持つことは、取引パフォーマンスを飛躍的に向上させることができます。相関関係を活用すればリスクを半減でき、強さの分析を活用すれば利益を最大化することが可能です。 このインジケーターは、通貨の強さ分析と通貨ペアの相関関係を組み合わせたハイブリッドなアプローチにより、最適な通貨ペアを選択するサポートをします。 通貨の強さ分析の使い方 例えば、あなたの取引戦略でAUD/JPYの買いシグナルが出たとします。しかしKTの通貨強さ分析を使うと、JPYがAUDよりも強くなっていることがわかりました。この場合、その取引は損失に終わる可能性が高いです。このインジケーターがあれば、そのような損失を未然に防ぐことができます。 通貨ペア相関関係の使い方 例えば、NZD/USDとGBP/JPYの同時売りシグナルが出たとします。KTの通貨ペア相関ツールを使うと、これらのペアの相関率が77%であることが判明します。  これらのペアは強く相関しているため、同時に取引するとリスクが二重になります。もしNZD/USDで損失が出れば、
MACD Divergence Seeker
KEENBASE SOFTWARE SOLUTIONS
KT MACD Divergence Seeker trades the regular and hidden divergence signals generated by our free indicator named KT MACD Divergence indicator. Trading the standalone divergences can be a risky affair that's why the KT MACD Divergence Seeker combines the standard divergence signals with an advanced analysis module to exploit the price inefficiencies on some FX pairs. What is the Divergence exactly? As a general conception if the price is making higher highs, then macd should also be making hig
KT Asian Breakout インジケーターは、アジア市場の重要な時間帯を分析し、価格のブレイクアウト方向に基づいた双方向の売買シグナルを生成します。価格がセッション高値を超えると買いシグナルが発生し、セッション安値を下回ると売りシグナルが発生します。 注意事項 セッションボックスが縦に広すぎる場合、新たな取引は避けるべきです。すでにセッション内で価格の動きが完了している可能性が高いためです。 ブレイクアウトのローソク足が大きすぎる場合、価格は一時的に反転した後に、シグナルの方向へ進むことがよくあります。 機能 買い/売りシグナルには、ストップロスと利益目標が含まれています。 KT Asian Breakout インジケーターは、第一、第二、第三の利益目標を成功基準として継続的にパフォーマンスをチェックします。 勝敗シグナル数、成功率、1シグナルあたりの平均ピップスなど、3つの主要なパフォーマンス指標を表示します。 ブレイクアウトのローソク足が大きすぎる場合、チャート上に警告メッセージを表示します。 推奨設定 時間足: 15分。 通貨ペア: すべての JPY ペア。 入力
MACD Divergence MT4
KEENBASE SOFTWARE SOLUTIONS
KT MACD ダイバージェンスは、価格とオシレーターの間に形成される通常のダイバージェンスと隠れたダイバージェンスを表示します。トレンドの反転を予測する戦略を用いている場合、MACD の通常のダイバージェンスを利用して転換点を特定できます。トレンドの継続に基づく戦略では、MACD の隠れたダイバージェンスが有効です。 KT MACD ダイバージェンスの制限事項 MACD ダイバージェンスを単体のエントリーシグナルとして使うのはリスクがあります。すべてのダイバージェンスが反転を示すとは限りません。より良い結果を得るためには、プライスアクションや他の分析手法と併用することをおすすめします。 主な機能 価格とオシレーターの間の通常および隠れたダイバージェンスを表示します。 非対称なダイバージェンスは精度向上とチャートの見やすさのために除外されます。 トレンド反転戦略およびトレンド継続戦略の両方に対応。 エキスパートアドバイザーへの組み込みに完全対応。 エントリーおよびエグジットの両方で使用可能です。 すべてのMetaTraderアラートに対応。 そもそもダイバージェンスとは? 一般的
KT Bollinger Bands Trader は、ボリンジャーバンドを使った平均回帰戦略に基づき、低ボラティリティ期間中に自動で取引を行う 100% 自動化されたエキスパートアドバイザー(EA)です。価格はボリンジャーバンドの上部または下部ラインに反応することが多いですが、必ずしも反転するとは限りません。ただし、低ボラティリティの時期には反転の可能性が高くなります。 エントリー条件 価格がボリンジャーバンドの下部ラインを正しく下回ると、買い注文が発動されます。 価格がボリンジャーバンドの上部ラインを正しく上回ると、売り注文が発動されます。 エグジット条件 低ボラティリティ期間の終了時にポジションをクローズします。 ストップロスまたはテイクプロフィット到達時にも決済されます。 このEAは、人気のあるボリンジャーバンド戦略に多くの改良を加えたもので、トレンドフィルター、ボラティリティフィルター、Vortex、MMI、曜日別フィルターなどの組み込みフィルターを使用して戦略を細かく調整できます。 入力パラメーター ----- ストラテジー設定 ----- ボリンジャーバンドの期間、シ
KT CCI Divergence shows the regular and hidden divergence created between the price and CCI oscillator. Divergence is one of the vital signals that depicts the upcoming price reversal in the market. Manually spotting the divergence between price and CCI can be a hectic and ambiguous task. Limitations of KT CCI Divergence   Using the CCI divergence as a standalone entry signal can be risky. Every divergence can't be interpreted as a strong reversal signal. For better results, try to combine it w
KT Heiken Ashi Smoothed は、標準の Heiken Ashi をさらに平滑化したバージョンであり、トレンド転換時には買い/売り矢印も表示します。シンプルながら実践的なこのインジケーターは、市場の微妙な変化を視覚的に捉えたいトレーダーに最適です。 状態がベアからブルに変わると買い矢印を描画します。 状態がブルからベアに変わると売り矢印を描画します。 モバイル通知・メール・サウンド・ポップアップの各種アラートに対応。 Heiken Ashi Smoothed とは? 標準 Heiken Ashi に見られるノイズやダマシを排除するため、2 本の移動平均を重ねてローソク情報を滑らかにしています。多少の遅延はあるものの、スイングポイントや新たなトレンドの兆しを視覚化でき、肉眼では捉えにくい価格のリズムを浮き彫りにします。得られたヒントを活用すれば、エントリー/エグジット戦略やリスク管理の精度を高められます。 活用例 本インジケーターは FX、コモディティ、株式など幅広い市場で利用できます。以下はトレード機会を探る際の主なポイントです。 下ヒゲのない青いローソク足は力
KT MA Crossover MT4
KEENBASE SOFTWARE SOLUTIONS
KT MA Crossover は、選択した移動平均線のクロスに基づいて買いと売りの矢印をチャートに描画します。さらに、各シグナルに対して適切なアラートを生成し、MFE(最も有利な価格変動)も表示します。これにより、トレーダーは過去のシグナルのパフォーマンスをより深く理解できます。 移動平均のクロスオーバーは、世界中のトレーダーがよく使う基本的な戦略の1つです。一般的には、速い移動平均と遅い移動平均を組み合わせて、その交差の方向によって買いまたは売りのエントリーシグナルを判断します。 買いシグナル:速いMAが遅いMAを上から下にクロスしたとき。 売りシグナル:速いMAが遅いMAを下から上にクロスしたとき。 特徴 各移動平均の設定は完全にカスタマイズ可能です。 各シグナルに対して MFE の値を表示します。 軽量に設計され、動作が非常にスムーズです。 すべてのMetaTraderアラート機能に対応しています。 デメリット  移動平均は過去のデータに基づくため、遅行性のある指標です。特にレンジ相場では、移動平均のクロスがランダムに見える場合があり、多くのダマしシグナルを発生させる可能
KT Round Numbers MT4
KEENBASE SOFTWARE SOLUTIONS
KT Round Numbers plots the round number levels which are also commonly known as psychological levels in the Forex world. In the context of Forex trading, round number levels are those levels in which there are two or more zeroes at the end. They are named as 00 levels on the chart. Some traders also consider the halfway points as a valid round number level. They are named as 50 levels on the chart. Use of round number levels in trading Round number levels work as strong support and resistance
フィルタ:
レビューなし
レビューに返信