KT Renko Patterns MT5
- Индикаторы
-
KEENBASE SOFTWARE SOLUTIONS
 Welcome to Keenbase Trading,
📢 Join our Telegram for real-time updates & algo trading tips: https://t.me/keenbasetrading - Версия: 2.3
- Обновлено: 15 февраля 2021
- Активации: 5
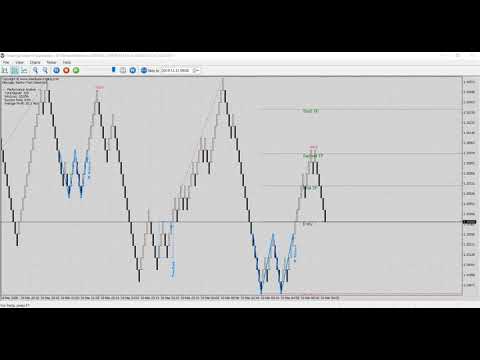
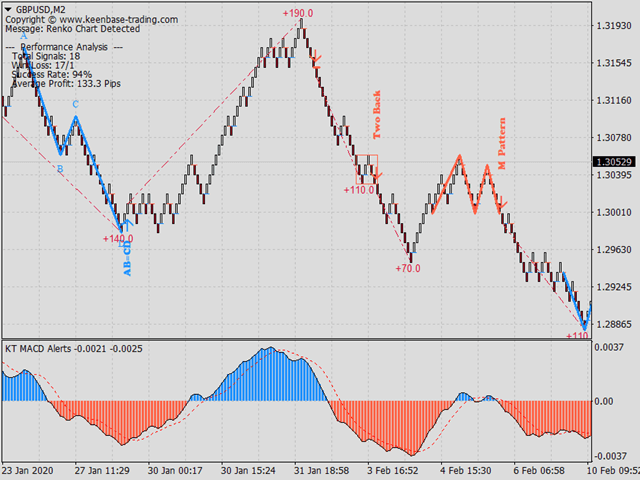
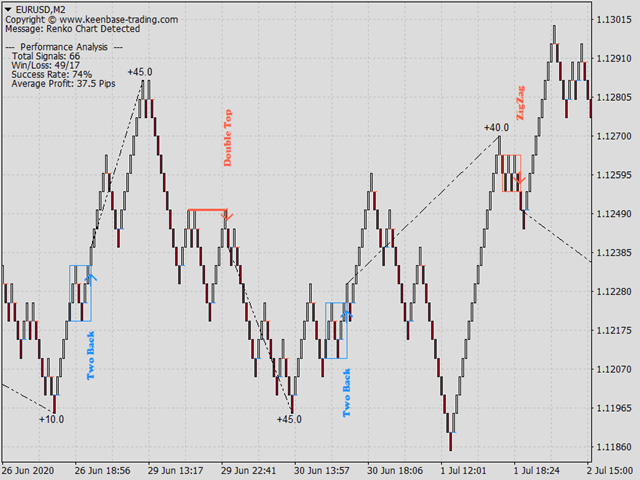
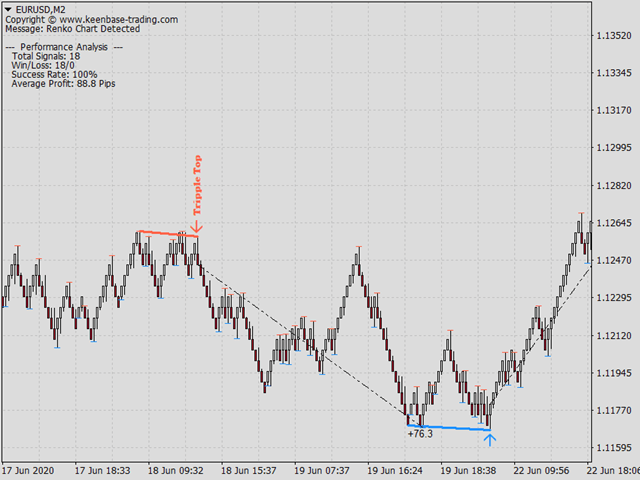
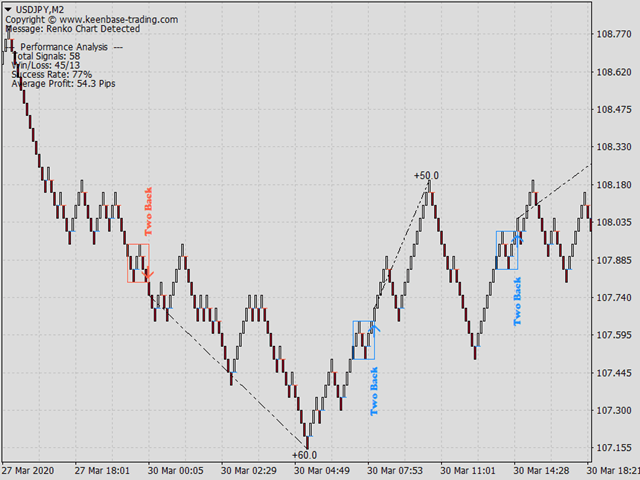
KT Renko Patterns анализирует график Ренко кирпич за кирпичиком, чтобы найти известные графические паттерны, которые часто используют трейдеры на различных финансовых рынках.
По сравнению с графиками на основе времени, торговля по паттернам на графиках Ренко легче и нагляднее благодаря их чистому виду.
KT Renko Patterns включает несколько паттернов Ренко, многие из которых подробно описаны в книге «Профитная торговля с графиками Ренко» авторства Прашанта Шаха.
Полностью автоматизированный советник на основе индикатора KT Renko Patterns доступен здесь - KT Renko Patterns EA.
Особенности
- Торговля до восьми четко определённых паттернов Ренко без двусмысленности.
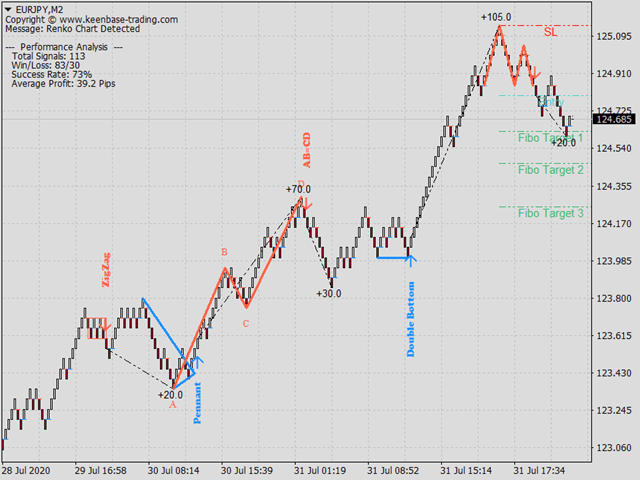
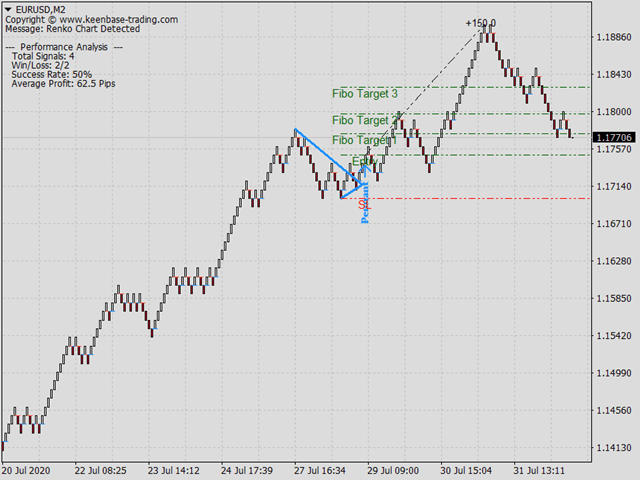
- Для полной объективности к каждому паттерну прилагаются уровни стоп-лосса и цели по Фибоначчи.
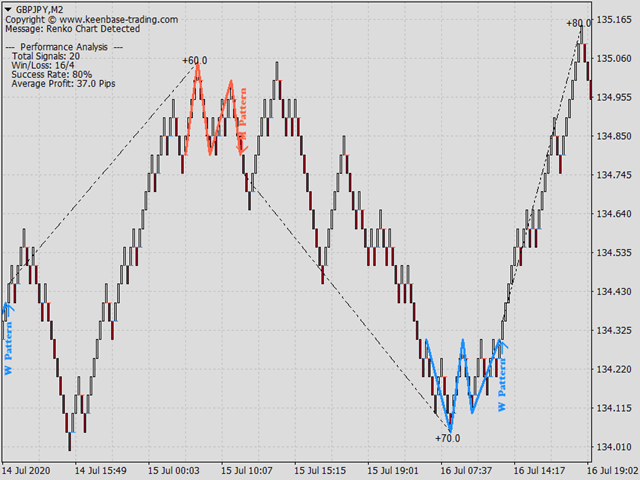
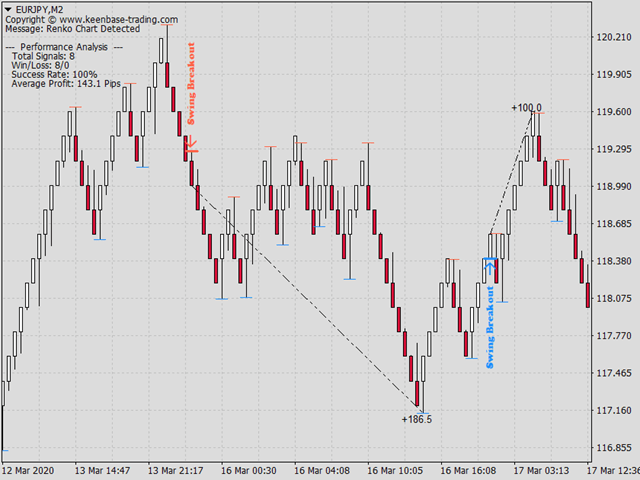
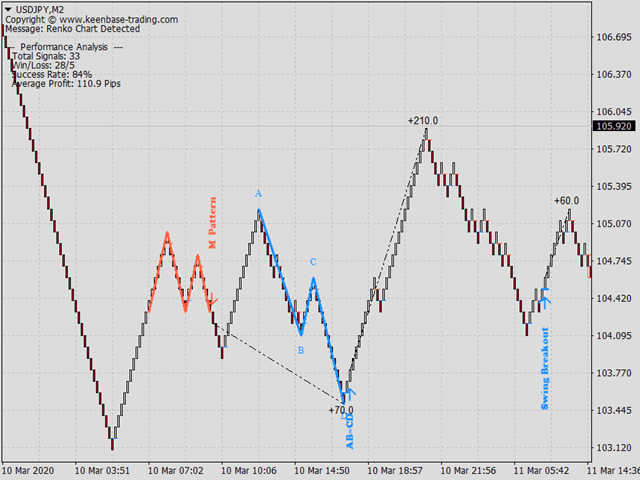
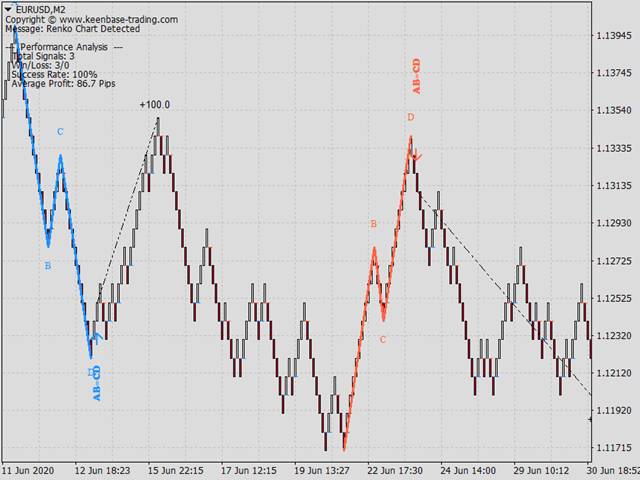
- KT Renko Patterns непрерывно оценивает точность каждого паттерна и отображает важную статистику на графике.
- Развороты кирпичей Ренко отмечаются, и по ним подаются сигналы, что помогает вовремя выйти при внезапном развороте.
- Обнаруженные паттерны не перерисовываются и не изменяются.
Включённые паттерны
- Паттерн W-M
- Сильные вымпелы
- Паттерн AB=CD
- Тройная вершина/тройное дно
- Двойная вершина/двойное дно
- Two Back Strike
- Зигзаг кирпичей
- Пробой свинга
Оптимизация точности сигналов
KT Renko Patterns показывает несколько паттернов, но не каждый из них подходит для всех символов. Повысить точность сигналов можно, выполнив следующие простые шаги:
- Убедитесь, что каждый паттерн установлен в значение True.
- Выберите «Критерий уровня успеха» (рекомендуется второй TP).
- Отключайте каждый паттерн по очереди и следите за процентом успеха.
- Если отключение паттерна улучшает результат — оставьте его выключенным.
- Если результат ухудшается — снова включите паттерн.
- Измените значение "Мин. баров между паттернами" в пределах от 20 до 100.
Параметры ввода
- Мин. баров между паттернами: Минимальное количество баров между каждым паттерном. Помогает повысить точность.
- Отметка разворота кирпича: Отмечает развороты кирпичей Ренко на графике.
- Сигналы при развороте кирпича: Если установлено значение true, при каждом развороте подаётся сигнал.
- Отображение названия паттерна: Показывает название паттерна рядом с сигналом.
- Анализ эффективности: Индикатор оценивает свою эффективность и показывает ключевые метрики.
- Критерий уровня успеха: Эталон для расчета успешности сигналов.
Часто задаваемые вопросы
Q. Работает ли это на стандартных графиках по времени?
A. Индикатор KT Renko Patterns разработан специально для кирпичей Ренко. Он может работать и на стандартных графиках, но это не рекомендуется, так как теряется его смысл.
Q. Можно ли оптимизировать точность сигналов?
A. Да. Инструкции по оптимизации приведены выше в описании.
Q. У меня есть идея нового паттерна для графиков Ренко. Можете добавить его в следующей версии?
A. Пожалуйста, напишите нам. Если наша команда исследований сочтёт паттерн полезным — мы его добавим.
Q. Можно ли импортировать индикатор в советник?
A. Да. Свяжитесь с нами, чтобы получить код разработчика для интеграции.