TimingCycleWithLLV
- Indicators
- Version: 1.0
- Activations: 5

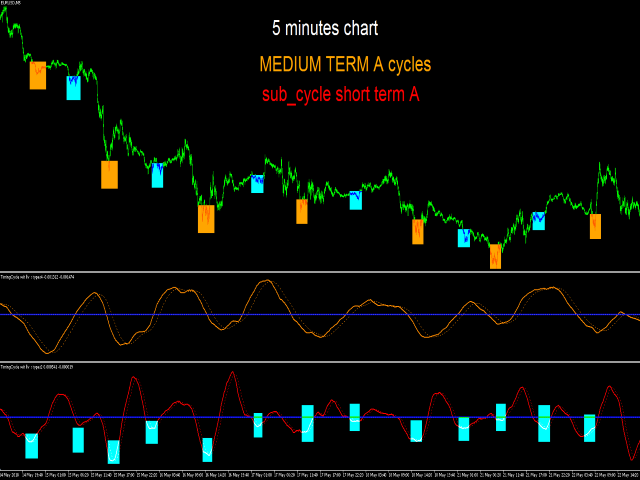
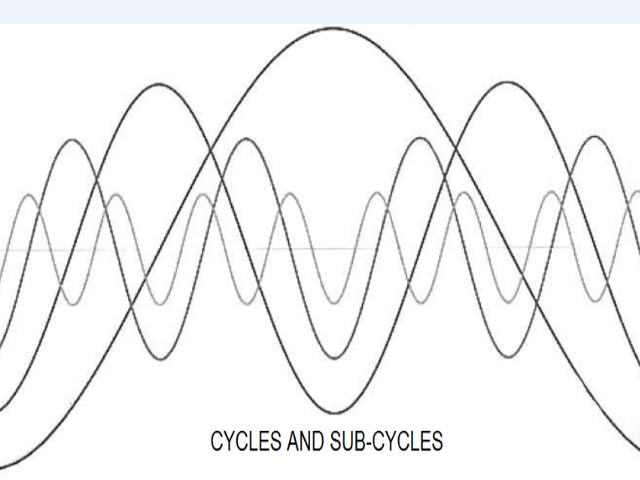
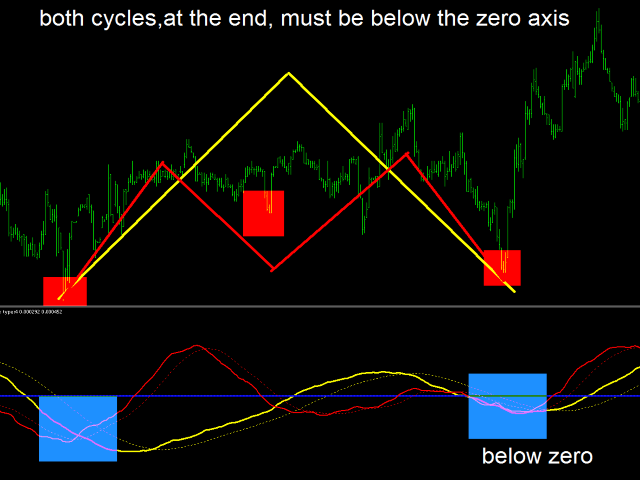
TimingCycleWithLLV is an excellent tool to determine the timing of your entry point!Everyone knows that cycles exist both in nature and in financial markets.Cycles are present in all time frames,from 1 minute to 1 year.Sometimes they are very clear to identify,others there is overlap between cycles of varyng duration.I can say this:the one-day cycle corresponds to the duration of a trading day( for example the one-day cycle for GERMAN DAX index is 14 hours as the trading day is 14 hours).Obviously in forex market the one-day cycle is 24 hours BUT rarely it is exactly 24....the time window ranges from X hours to Y hours (this is the result of my personal research and if you want to go deeper you need to study the meaning of the sacred numbers and do your own research in counting bars from low to low,high to high and low to high).A cycle goes from low to low and each cycle can be divided into sub_cycles and in turn divided into smaller cycles.How do we understand that a cycle ends and a new one starts?We have two answers: the first we have to see that the smaller cycles end up inside the window of the larger cycle (parent cycle);both cycles must be below the zero axis,the small cycle is the first to start.
Therefore,in the case of the one-day cycle we must see if half a cycle and a quarter cycle end in the time window of the parent cycle
The second answer is that a divergence of the half a cycle or a quarter cycle is formed at the end of the parent cycle.
I divided the cycles into various durations:
very short term
short term A
short term B
medium term A
medium term B
long term A
long term B
SUBDIVISIONS:
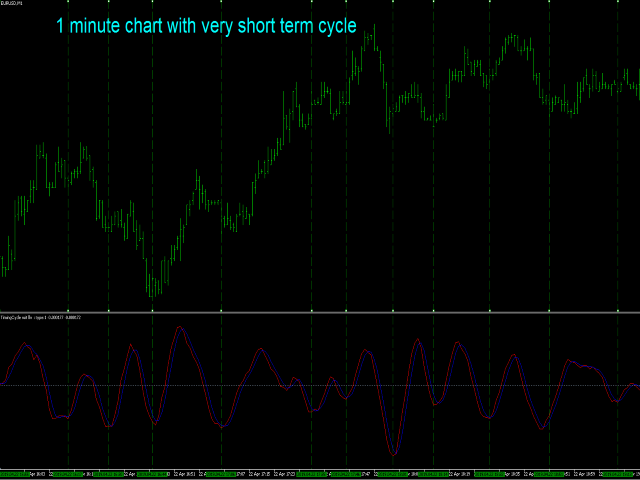
1 minute chart
parent cycle is short term A and sub_cycle is very short term
parent cycle is short term B and sub_cycle is short term A
parent cycle is medium term A and sub_cycle is short term B
parent cycle is medium term B and sub_cycle is medium term A
long term A is sub_cycle of short term A in 5/15 minutes chart
long term B is sub_cycle of short term B in 5/15 minutes chart
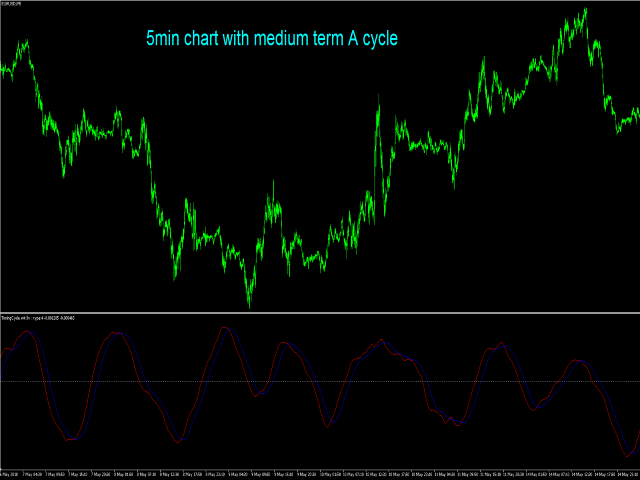
5 minutes and 15 minutes chart
parent cycle is short term A and sub_cycle is long term A of 1 minute chart
parent cycle is short term B and sub_cycle is very short term
parent cycle is medium term A and sub_cycle is short term A/B
parent cycle is medium term B and sub_cycle is short term B
parent cycle is long term A and sub_cycle is medium term A
parent cycle is long term B and sub_cycle is medium term B
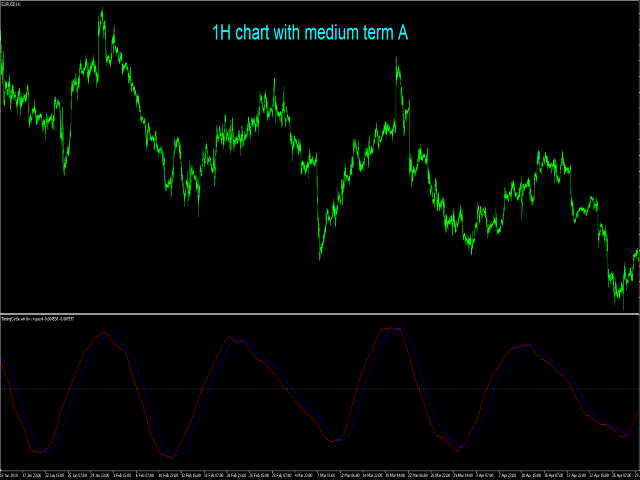
1 H chart
parent cycle is very short term and sub_cycle is long term A/B of 5/15 minutes chart
parent cycle is short term A and sub_cycle is very short term
short term A is a stand alone cycle
parent cycle is medium term A/B and sub_cycle is short term A
parent cycle is long term A and sub_cycle is short term B
parent cycle is long term B and sub_cycle is medium term A/B
In order to do scalping I prefer 1 minute chart with input very short term or short term A or B and medium term A or B.
Cycles for 5 minutes or 15 minutes are the same,they have the same length; my favorite cycles are short term A,short term B,medium term A,medium term B,long term A,long term B...these cycles are the heart of forex,they are the most recurrent and most identifiables ones!
If you want to check longer cycles you have to observe 1H chart,my favorite cycles are very short term,short term A,short term B,medium term A.