TimingCycleWithLLV
- Indikatoren
- Version: 1.0
- Aktivierungen: 5

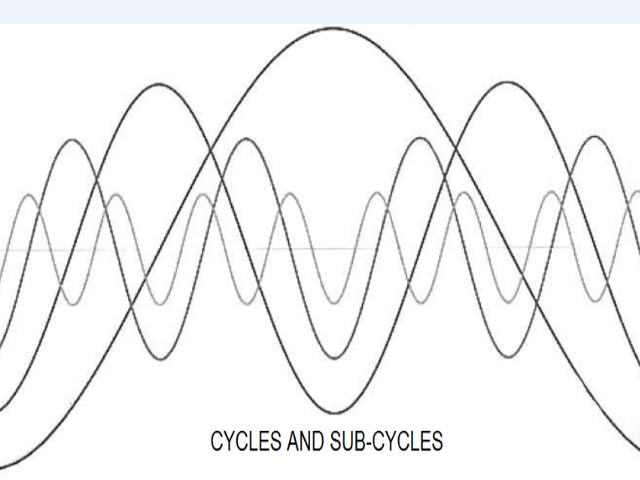
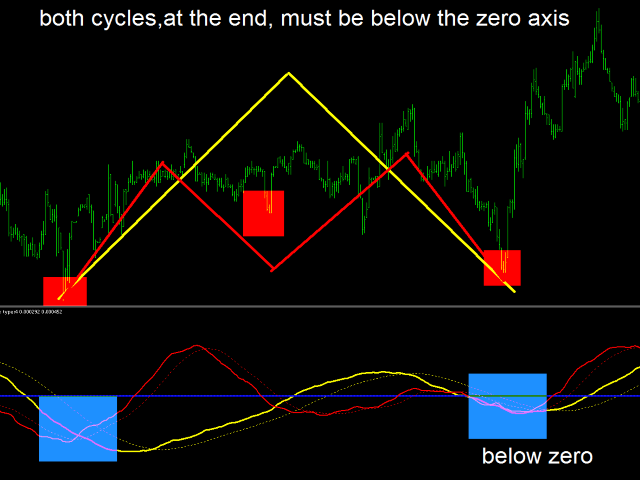
TimingCycleWithLLV ist ein hervorragendes Instrument, um den Zeitpunkt Ihres Einstiegs zu bestimmen!Jeder weiß, dass es sowohl in der Natur als auch auf den Finanzmärkten Zyklen gibt, und zwar in allen Zeitrahmen, von einer Minute bis zu einem Jahr, manchmal sind sie sehr deutlich zu erkennen, manchmal gibt es Überschneidungen zwischen Zyklen von unterschiedlicher Dauer.Der Ein-Tages-Zyklus entspricht der Dauer eines Handelstages (z.B. beträgt der Ein-Tages-Zyklus für den deutschen DAX-Index 14 Stunden, da der Handelstag 14 Stunden dauert).Auf dem Devisenmarkt beträgt der Ein-Tages-Zyklus natürlich 24 Stunden, ABER selten sind es genau 24....das Zeitfenster reicht von X Stunden bis Y Stunden (dies ist das Ergebnis meiner persönlichen Nachforschungen, und wenn Sie tiefer gehen wollen, müssen Sie die Bedeutung der heiligen Zahlen studieren und Ihre eigenen Nachforschungen anstellen, indem Sie die Balken von Tief zu Tief, Hoch zu Hoch und Tief zu Hoch zählen).Ein Zyklus geht von einem Tief zu einem Tief, und jeder Zyklus kann in Unterzyklen unterteilt werden, die wiederum in kleinere Zyklen unterteilt sind.Wie können wir verstehen, dass ein Zyklus endet und ein neuer beginnt?Darauf gibt es zwei Antworten: Erstens müssen wir sehen, dass die kleineren Zyklen innerhalb des Fensters des größeren Zyklus (übergeordneter Zyklus) enden;beide Zyklen müssen unter der Nullachse liegen, wobei der kleine Zyklus der erste ist, der beginnt.
Im Fall des Ein-Tages-Zyklus müssen wir also sehen, ob ein halber Zyklus und ein Viertelzyklus im Zeitfenster des übergeordneten Zyklus enden.
Die zweite Antwort lautet, dass sich am Ende des übergeordneten Zykluseine Divergenz des halben Zyklus oder des Viertelzyklus bildet.
Ich habe die Zyklen in verschiedene Laufzeiten unterteilt:
sehr kurzzeitig
Kurzfristig A
Kurzfristig B
mittelfristig A
mittelfristig B
langfristig A
Langfristig B
TEILWEISE:
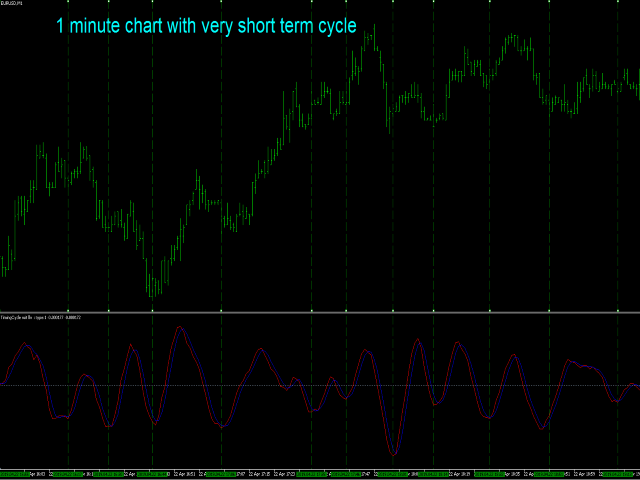
1-Minuten-Diagramm
übergeordneter Zyklus ist kurzfristig A und sub_cycle ist sehr kurzfristig
übergeordneter Zyklus ist kurzfristig B und sub_cycle ist kurzfristig A
übergeordneter Zyklus ist mittelfristig A und sub_cycle ist kurzfristig B
Der übergeordnete Zyklus ist mittelfristig B und der Unterzyklus ist mittelfristig A
Langfristiger A ist Unterzyklus von kurzfristigem A im 5/15-Minuten-Chart
Langfristig B ist der Unterzyklus von Kurzfristig B im 5/15-Minutenchart
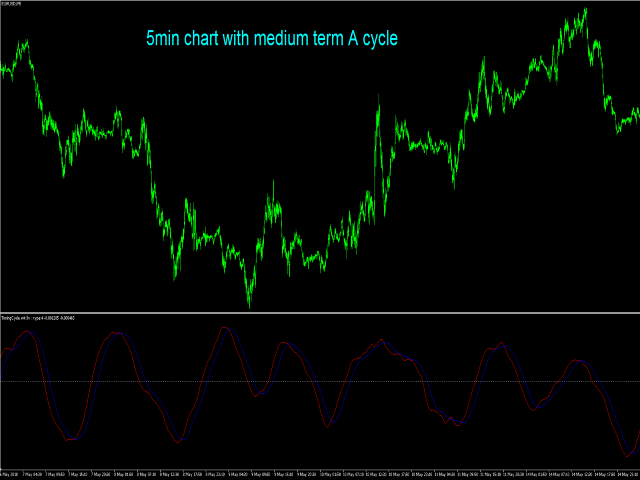
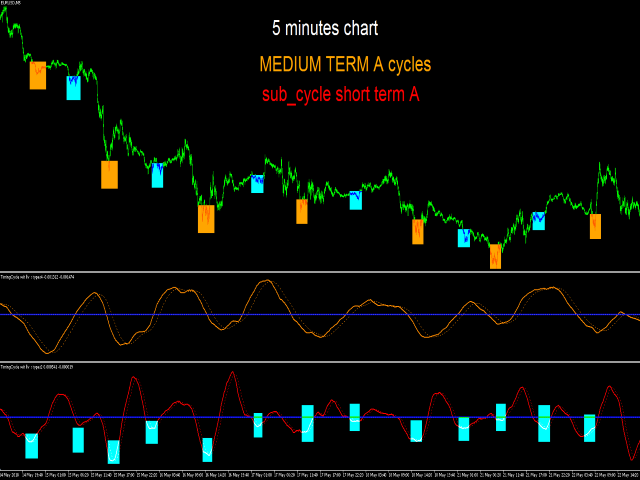
5-Minuten- und 15-Minuten-Chart
übergeordneter Zyklus ist kurzfristig A und sub_cycle ist langfristig A im 1-Minuten-Chart
übergeordneter Zyklus ist kurzfristiger B und sub_cycle ist sehr kurzfristiger
übergeordneter Zyklus ist mittelfristig A und sub_cycle ist kurzfristig A/B
übergeordneter Zyklus ist mittelfristig B und sub_cycle ist kurzfristig B
Der übergeordnete Zyklus ist langfristig A und der Unterzyklus ist mittelfristig A
übergeordneter Zyklus ist langfristig B und untergeordneter Zyklus ist mittelfristig B
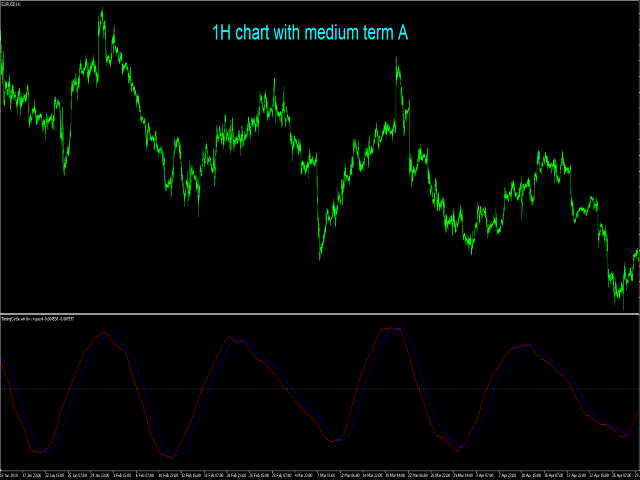
1 H-Diagramm
übergeordneter Zyklus ist sehr kurzfristig und untergeordneter Zyklus ist langfristig A/B von 5/15 Minuten Chart
übergeordneter Zyklus ist kurzzeitig A und untergeordneter Zyklus ist sehr kurzzeitig
Kurzzeit A ist ein eigenständiger Zyklus
übergeordneter Zyklus ist mittelfristig A/B und untergeordneter Zyklus ist kurzzeitig A
übergeordneter Zyklus ist langfristig A und sub_cycle ist kurzfristig B
Der übergeordnete Zyklus ist langfristig B und der Unterzyklus ist mittelfristig A/B
Für das Scalping bevorzuge ich einen 1-Minuten-Chart mit den Eingaben sehr kurzfristig oder kurzfristig A oder B und mittelfristig A oder B.
Zyklen für 5 Minuten oder 15 Minuten sind gleich, sie haben die gleiche Länge; meine Lieblingszyklen sind short term A,short term B,medium term A,medium term B,long term A,long term B...diese Zyklen sind das Herzstück des Forex, sie sind die am häufigsten wiederkehrenden und am besten identifizierbaren!
Wenn Sie längere Zyklen prüfen wollen, müssen Sie den 1H-Chart beobachten, meine Lieblingszyklen sind sehr kurzfristig, kurzfristig A, kurzfristig B, mittelfristig A.