OHCL TimeFrames Osw MT5
- Indicators
-
William Oswaldo Mayorga Urduy
 MQL4 and MQL5 trader and developer since February 2019, delivering projects in under one day and providing post-delivery technical support.
Optimized code, advanced logic, and high-quality code. - Version: 1.0
- Activations: 7
OHLC Timeframes Osw
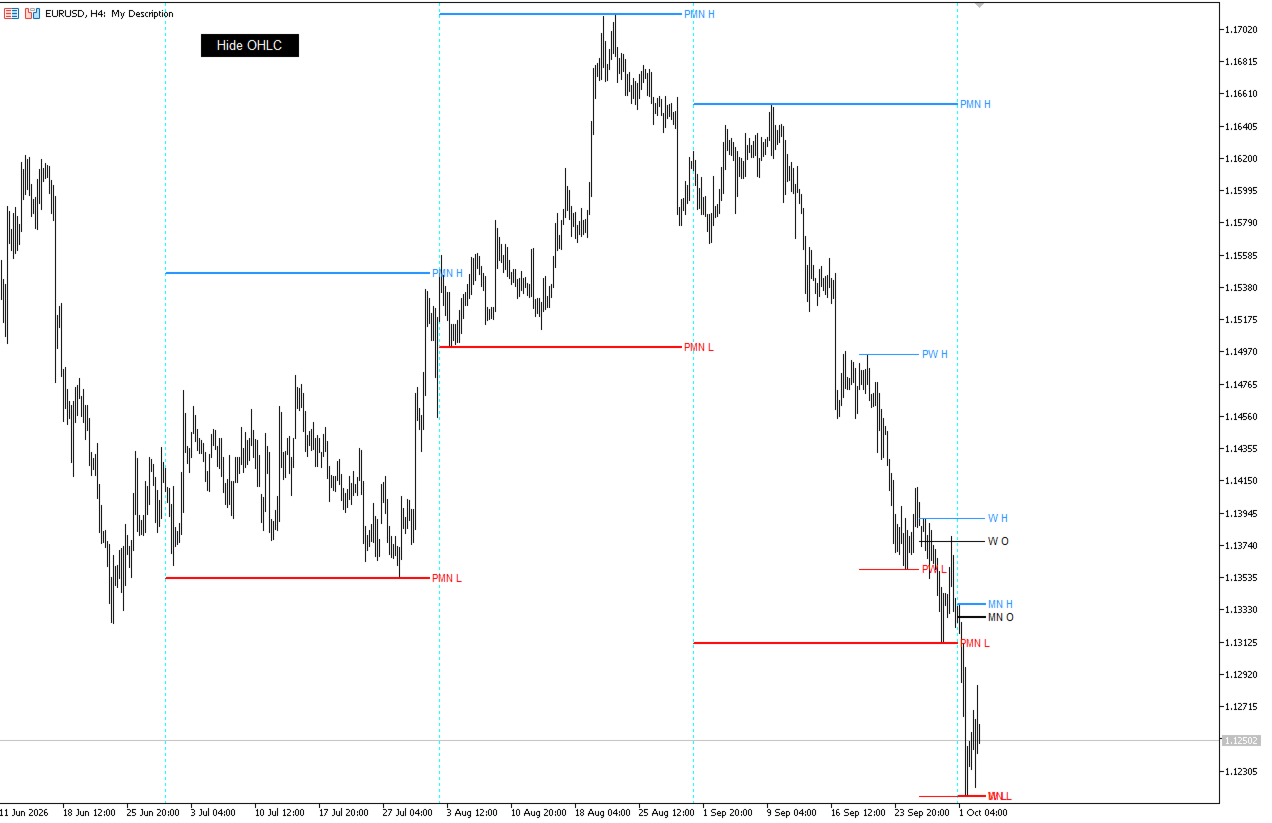
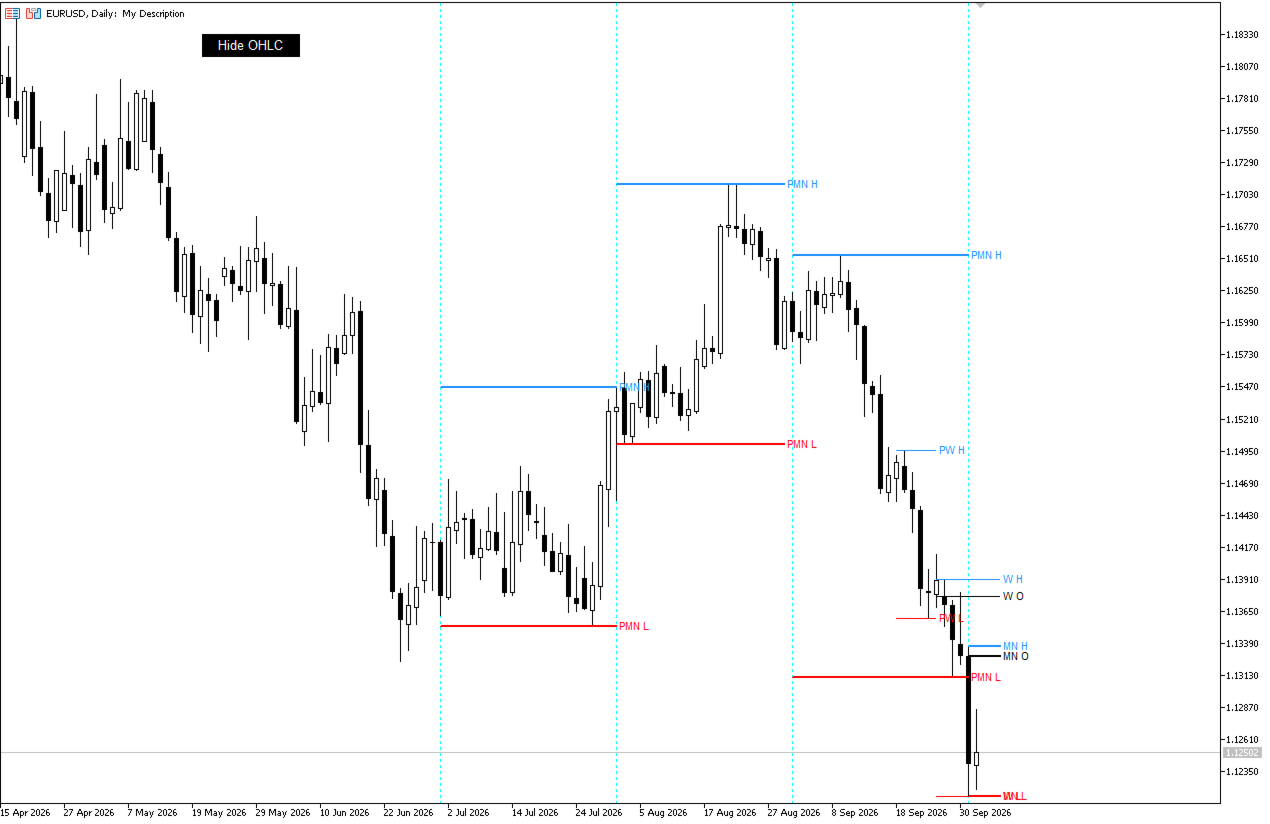
OHLC Timeframes Osw is an essential multi-timeframe indicator designed to clearly and accurately project the key Open, High, Low, and Close levels from up to 4 higher timeframes directly onto your current chart. It allows Price Action and ICT traders to identify liquidity points, institutional support, and resistance with total visual control and an integrated interactive on-chart button to toggle the view instantly.
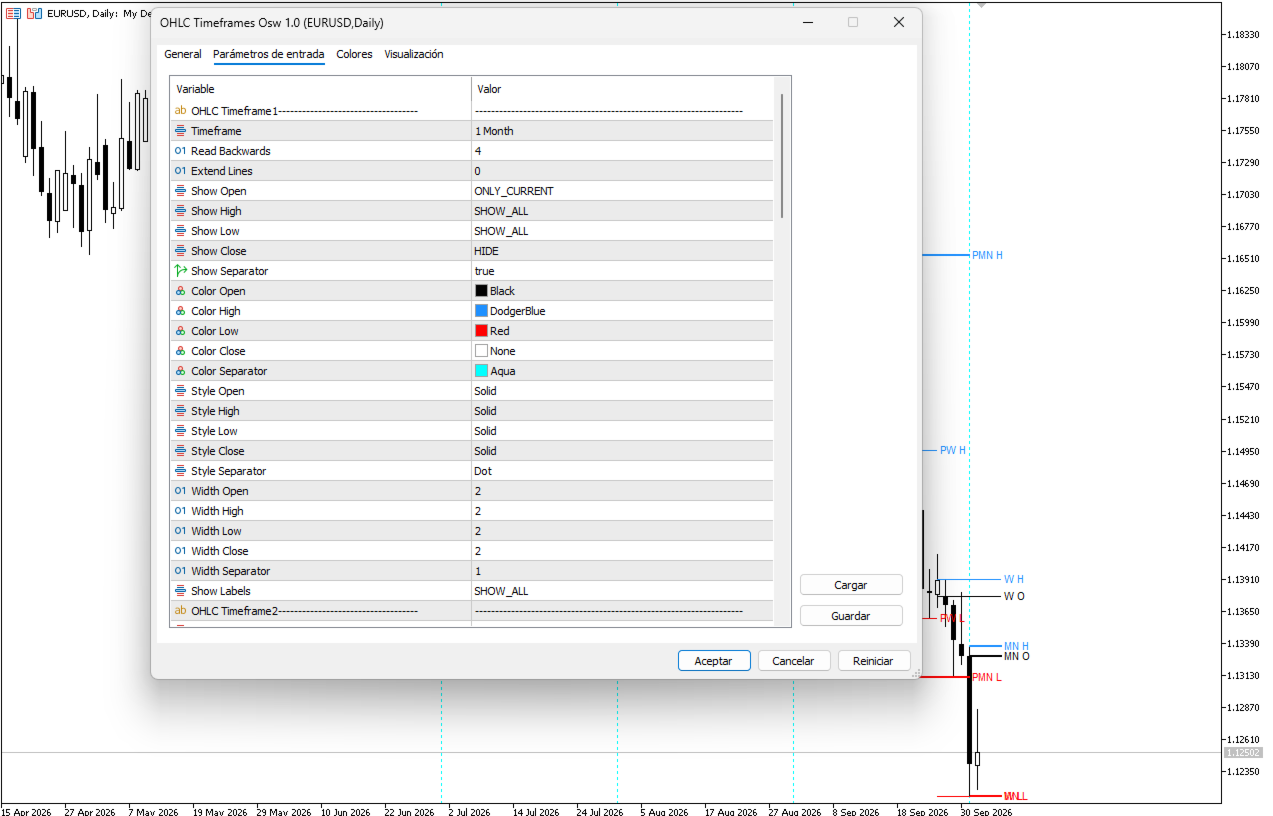
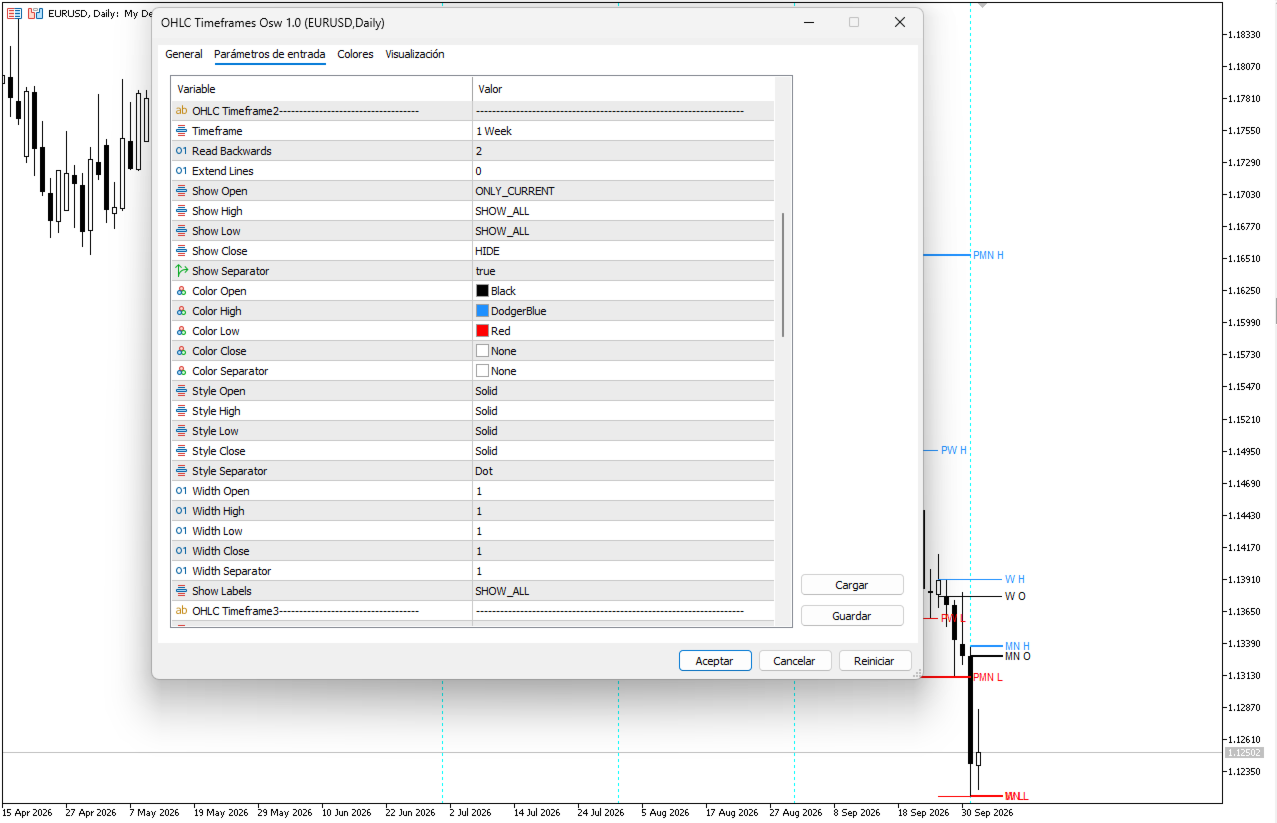
Parameter Guide (Inputs Menu)
Timeframe Configuration (Timeframe 1 to 4)
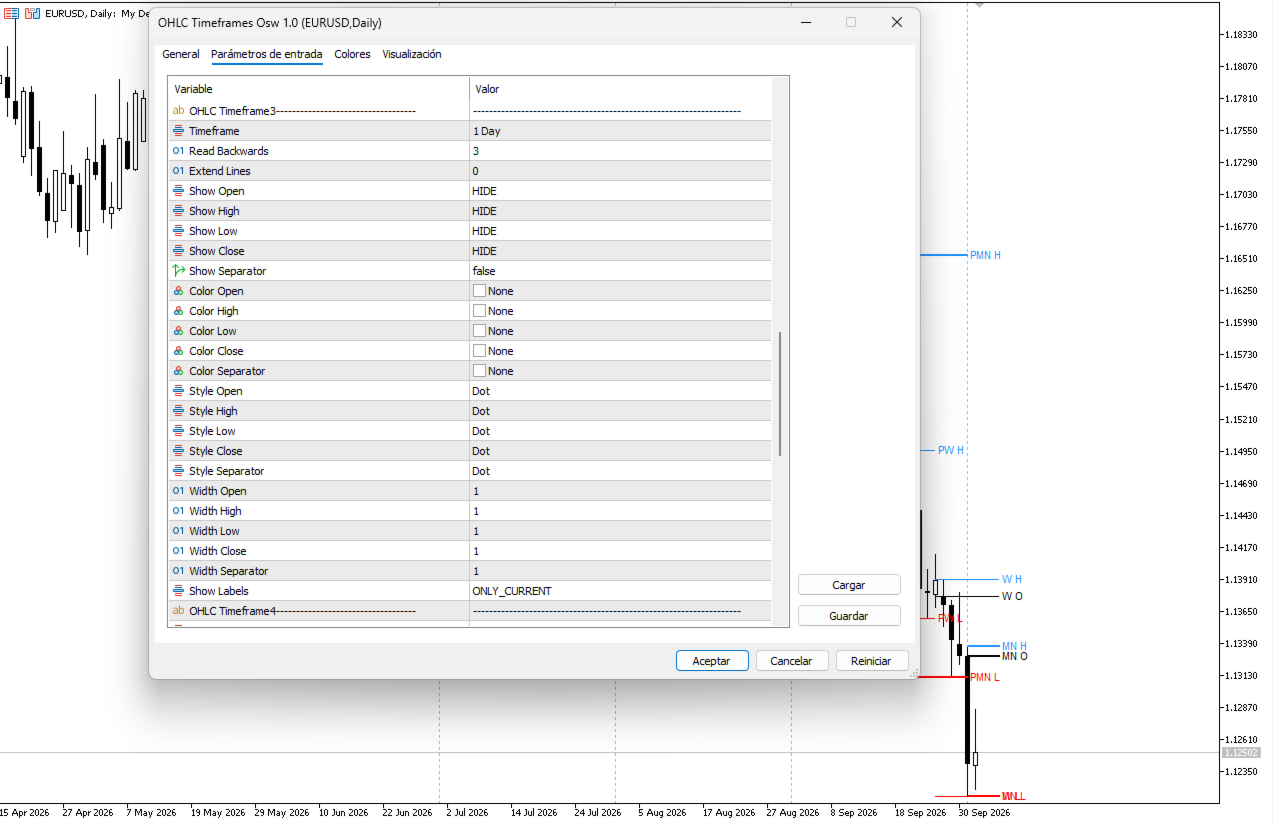
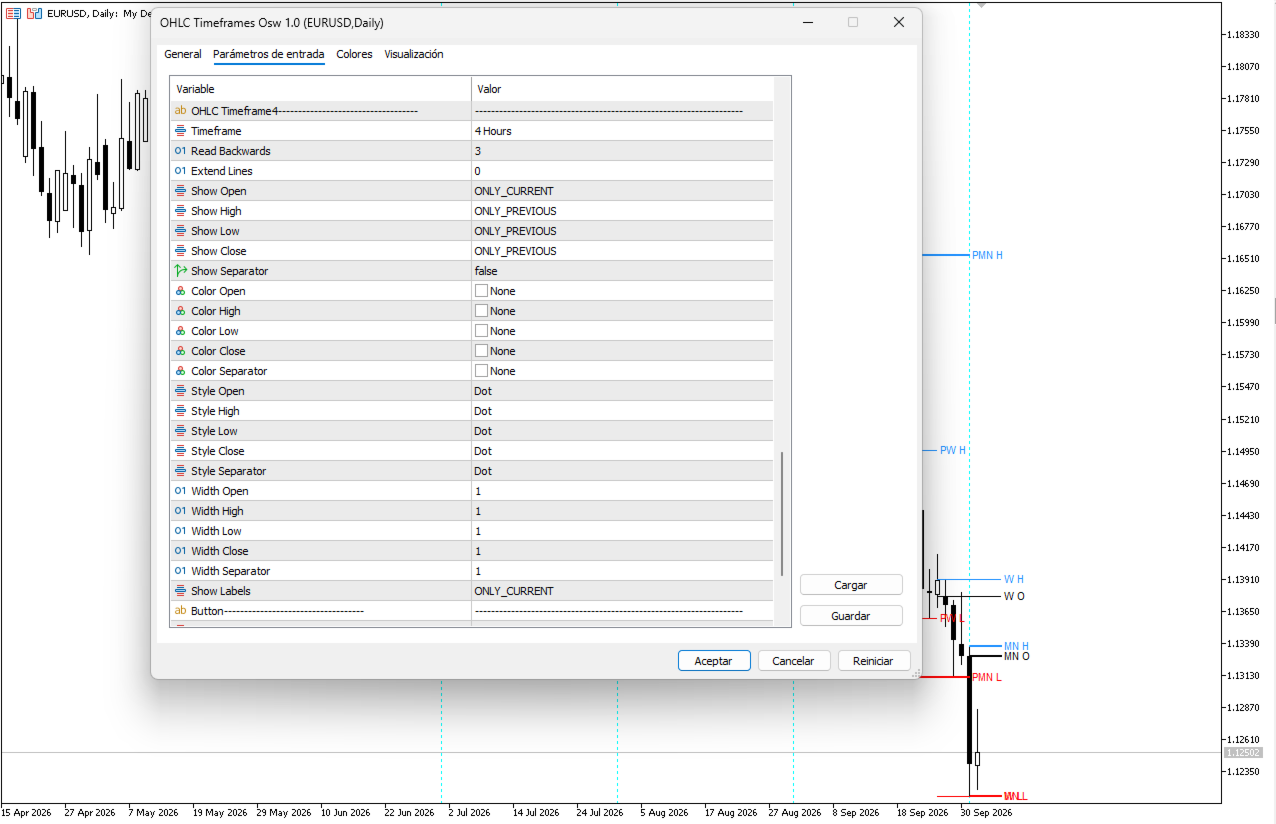
- Timeframe: Select the higher timeframe to analyze (e.g., Monthly, Weekly, Daily, H4).
- Read Backwards: Number of past periods to plot to compare current levels with previous ones.
- Extend Lines: Length of level line extension into the future on the chart.
- Show Open / Show High / Show Low / Show Close: Controls visibility of each level (Options: Hide, Only Current, Only Previous, Show All).
- Show Separator: Toggles the vertical separator line for the selected period.
- Color Open / High / Low / Close / Separator: Assign custom colors for each price line and separator.
- Style Open / High / Low / Close / Separator: Defines line style (Solid, Dashed, Dotted, etc.).
- Width Open / High / Low / Close / Separator: Adjusts the visual thickness of each line.
- Show Labels: Determines visibility of informative labels for levels on the chart.
Button and Refresh Configuration (Button)
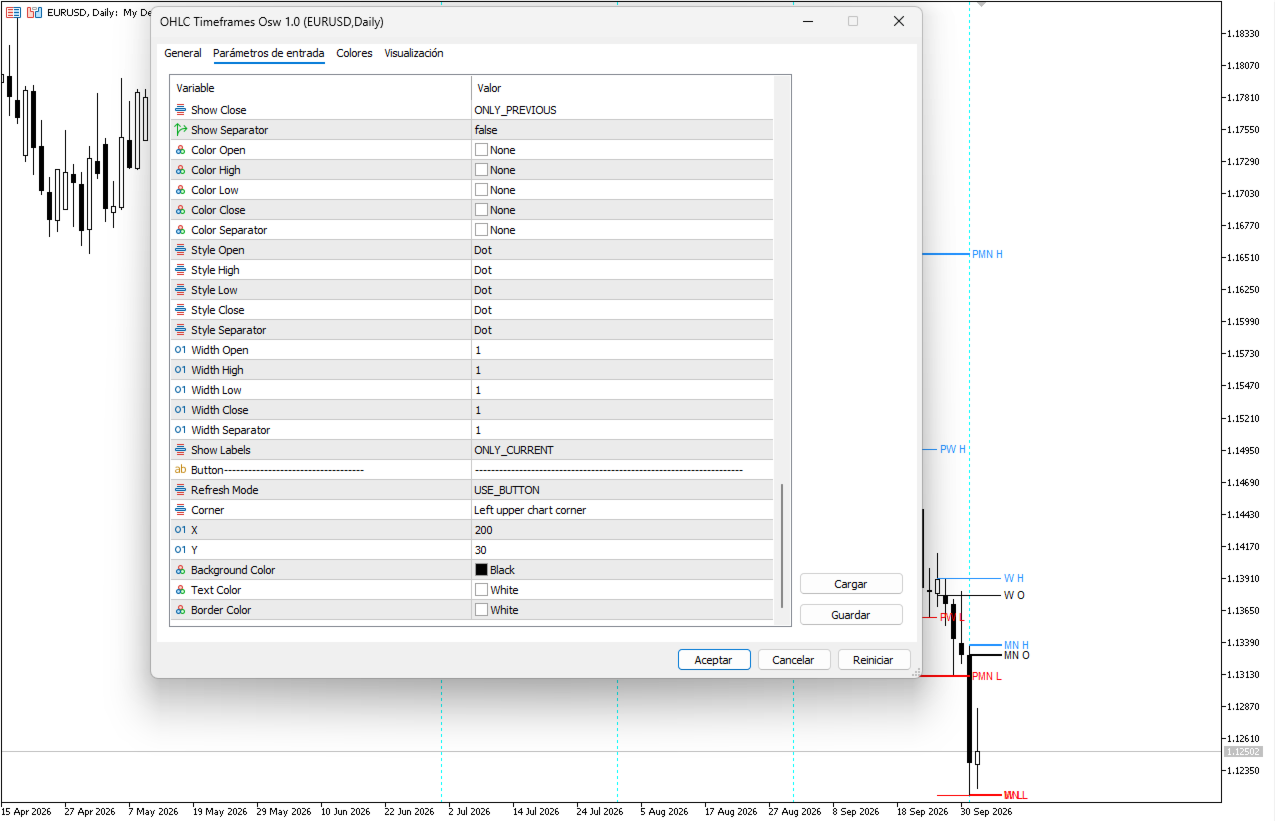
- Refresh Mode: Select between manual control via dynamic button (USE_BUTTON) or automatic update (SHOW_AUTOMATICALLY).
- Corner: Chart corner for the control button placement.
- X / Y: Horizontal and vertical distance in pixels from the selected corner.
- Background / Text / Border Color: Customizes the appearance of the interactive button.
Visual Interpretation
The indicator projects custom horizontal lines representing structural levels of the selected higher timeframes. Each line includes an identification label (e.g., MN O for monthly open, D H for daily high, or P W L for previous weekly low). Vertical lines function as temporal dividers to mark the start of each session or major cycle.
Operation Guide
- Liquidity Identification: Use previous highs and lows as primary liquidity sweep targets or reaction/reversal zones.
- Daily and Weekly Bias: Monitor the current period's open level to determine if price is trading in a premium zone (above open) or discount zone (below open).
- Efficient Visual Management: Use the 'Show OHLC / Hide OHLC' floating button during analysis and keep the chart clean during execution.
Optimization and Recommendations
- Trading Styles: Ideal for Intraday, Swing Trading, and strategies based on Smart Money Concepts / Price Action.
- Recommended Assets: Forex, Indices, Cryptocurrencies, and Commodities.
- Suggested Setup: Set Timeframe 1 to Weekly (W1), Timeframe 2 to Daily (D1), and Timeframe 3 to H4 for balanced multi-timeframe analysis without cluttering the chart.
Don't forget to visit my other indicators and Experts.